The Manaus Effect

During the United States' game against Germany on Thursday, it was hard to go 10 minutes without hearing Ian Darke or Taylor Twellman mention Manaus and its effect on the players. The US Men's National team played its previous game against Portugal in the "Jungle City," as did Italy, England, Croatia and Cameroon, before each dropping three points in their next games.

Business Insider pointed out that those first four teams to play in Manaus lost by a combined score of 10 - 3, though it conceded the tiny sample size. A Washington Post article cited the same statistics, and pondered the possibility of a curse in Manaus. The Independent, based in the United Kingdom, noted on June 24th that each of the seven teams that played in Manaus lost its next game. That was confusing since only six teams had played in Manaus to that point, and only four of those had actually played a "next game." But whatever. #stats Graham Zusi, Sporting Kansas City's All-star midfielder and starter for the USMNT, wasn't having any of it, stating "I don’t think it was that bad to be honest. When it got down to it, at night it cooled off and the humidity wasn’t as bad. I think after about 24 hours the bodies felt great." Hugh Laurie would tell us that everybody lies, especially athletes on record, but there might be something to Zusi's statement. Below is a chart depicting the average temperature, humidity and heat index for each game site. The weather stats were taken from Weather Underground at the beginning of the second half of each game.

City  Games  Temp  Humidity  Index
Fortaleza 4 82.4 62% 85.4
Salvador 4 80.2 73% 83.5
Manaus 4 79.3 81% 82.1
Natal 4 78.5 83% 80.7
Cuiaba 4 78.4 66% 79.1
Brasilia 4 77.5 43% 78.7
Sao Paulo 4 69.4 55% 78.3
Belo Horizonte 4 76.1 40% 77.8
Recife 4 77.5 86% 77.8
Rio De Janeiro 4 75.7 71% 76.6
Porto Alegre 4 65.8 71% 75.5
Curitiba 4 64.0 79% 71.5

It's reasonable to theorize that more extreme environments take their toll on the human body, even professional athletes. But if we're going to get serious here, we need to consider all locales that were exceptionally uncomfortable. Manaus actually ranked third in average heat index, and had a lower average humidity than fourth-place Natal. Italy and England were the first to play in Manaus on June 14th and sparked the notion that it was a hell hole. But while they were duking it out in Manaus, Costa Rica and Uruguay were playing in Fortaleza, number one on that list up there. Though it was less humid to start the second half in Fortaleza, it was actually hotter, and Fortaleza's halftime heat index beat that of Manaus by a few points, 87.3 to 84.6.

It turns out that teams which most recently played in Natal, Salvador or Fortaleza---the other three extreme locations---did alright. Those teams outscored their opponents by a combined five goals. That makes it hard to believe that the conditions of Manaus were responsible for the downfalls of Italy, England and Croatia, though that still leaves the possibility of a non-weather-related curse.

To make this a legit study, there are some other factors we need to control for, and that is why God invented linear regression. Using ESPN's (Nate Silver's) Soccer Power Index, I controlled for each team's overall ability, and then I measured the effects of extra rest and past-game heat index on the goal differential outcome. The output is below:

Variable Estimate P-Value
Intercept -0.37 15.8%
SPI Ratings Differential 1.01 0.1%
Additonal Days Rest (home) -0.21 68.1%
Heat Index Differential 0.01 74.3%

If you're not a linear regression kind of person, then basically what that chart up there says is that neither the heat index of the teams' past games nor any rest discrepancy seemed to matter during this tournament. At least not in terms of goal differential. But we know that goal differential is finicky, and Expected Goals are a better indicator of team performance. Good thing we've got our World Cup Expected Goals data up and running! If we measure team performance by some Expected Goal Differential statistics (xGD), then we get these linear regression outputs:

Expected Goal Diff Estimate P-value Even Expected Goal Diff Estimate P-value
Intercept -0.06 61.9% Intercept 0.01 88.4%
SPI Ratings Differential 0.46 0.1% SPI Ratings Differential 0.34 0.2%
Additional Days Rest (home) 0.13 57.0% Additional Days Rest (home) 0.17 37.0%
Heat Index Differential 0.00 79.7% Heat Index Differential 0.00 86.3%

Again, regardless of whether we look at overall xGD or even-gamestate xGD, there are no statistically significant effects due to extreme heat index figures from past matches. Expected Goals data are obviously not a direct measurement of how heat impacts the athletes' bodies, but they should be a stable representation the teams' relative strengths during a match.

The Swiss were the last team (that is still in the tournament) to play in an 80+ heat index environment, but I wouldn't expect that to matter much based on what I've shown above. What will matter is that Argentina is much better. Talent has trumped the heat index so far this World Cup.


Big Game in the Big Apple - my picks on who wins/loses in MLS for Week 12

Sorry, a bit late on this and not a lot of time to offer up detailed thoughts so here we go with my picks on who wins and loses this weekend keeping in mind I don't/won't pick draws...  my record without picking draws now hovers at 51%.  

New York at home to Portland - I've already offered up my thoughts on my home blog about this one.  If the Timbers don't make mental mistakes, don't get a red card, don't yield a Penalty Kick and don't score an own goal I think they win... Timbers take three.

Vancouver at home to Seattle - A big game in the great northwest with Cascadia Cup clash written all over it - Vancouver wins...

Columbus at home to Chicago - If the Crew don't win and Chicago does the early season dream start will have started to fade into a mid-season nightmare for Berhalter and his Crew; especially after being gifted three goals in Portland and still only coming away with a draw.  Columbus win...

New England hosts DC United - A huge test for Olsen and his crew coming off that disappointing draw to the worst team in MLS, Montreal.  Can the Revolution continue to win - since I can't pick draws I go with New England to win...

Colorado at home to Montreal - Really - is anyone willing to bet Montreal wins this game?  Colorado wins...

Real Salt Lake entertains FC Dallas - Perhaps a pivot point for FC Dallas as the mid-season approaches.  There might be room this week for Dallas to walk in and take 3 points - RSL are unbeaten this year and if all else fails I can see a draw with these two teams... but Plata should be a difference maker this game - along with the ever under-rated Grabavoy - RSL wins...

LA Galaxy at home to Philadelphia - Is this another one of those stunners for the Union?  Hard to say but with Donovan returning far to early, in my opinion, from the USMNT I see some fire in his eyes and the Union possibly getting crushed... LA wins...

San Jose entertains Houston - with Wondolowski missing, and rightly so... and Davis missing, and rightly so... this has all the makings of a draw but I think Houston wins with a better defense...

Best, Chris

Expected Wins #2 - After 184 MLS Events (92 Games)

Hopefully most of you read Part I of my series on Expected Wins in Major League Soccer. As a quick reminder the Expected Wins analysis is my internal data quality review on the seven data points I use to support my quantitative Possession with Purpose analysis; the stronger the correlation these data points have the more confidence I have in the overall Indices that are created to assess team performance.

For your benefit, in case you forgot, here are the seven data points I continue to analyze as we reach the 92 game point in MLS; which equals 184 events:

  1. Passes Attempted Entire Pitch
  2. Passes Completed Entire Pitch
  3. Passes Attempted Final Third
  4. Passes Completed Final Third
  5. Shots Taken
  6. Shots on Goal
  7. Goals Scored

All data points, at this time, have equal weight.

What is interesting is that over the week to week course of the season 40% (20/50) of the weekly top five teams, in Attacking PWP, have averaged less than 50% possession in their matches.  

For me that's pretty cool as it indicates this analysis is not really biased towards teams that use a shorter-passing scheme in attack.  Week 5, 3 of 5 teams were under 50% and the other two were both under 51% possession.

Some of those teams are possession based teams like DC United, Portland and Seattle but in that week the margin of possession did not have as much effect as the ability of those teams to finish quality chances - the top three teams that week all scored goals equal to their shots on goal.

The five teams that week who exceeded 80% in Passing Accuracy; usually a good indicator of ground based attacking all finished outside the top 5.


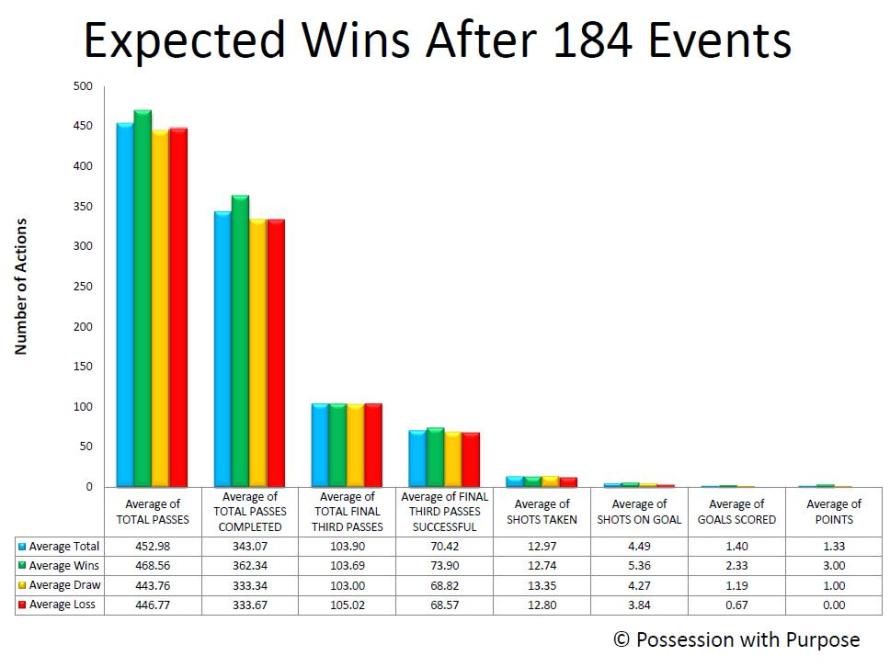
Moving on after that tidbit, here's the averages for overall (blue bar), teams that win (green bar), teams that draw (orange bar) and teams that lose (red bar).

Expected Wins 2 Averages

Facts as they exist today after 184 Events in 2014:

  • The overall tenor of the data points and their relationship really hasn't changed that much since XpW 1.
  • Teams that win average 51.11% Possession; losing teams average 48.89% Possession, (lower)
  • Teams that win average 76.39% in Passing Accuracy; losing teams average 74.10% (lower)
  • Teams that win average 20.48% Penetration in the Final Third based upon Total Passes completed; teams that lose average 20.32% (lower)
  • Teams that win average 18.64% Shots Taken per pass completed in the Final Third, losing teams average 19.22% (higher)
  • Teams that win average 42.67% Shots on Goal per Shot Taken; teams that lose 32.13% (lower) (by over 10%!)
  • Teams that win average 46.18 Goals Scored per Shot on Goal; losing teams 17.03% (lower) (by over 29%!)

Like after XpW 1 (102 Events - 51 games) losing teams shoot the ball more often, on average, but are less accurate when it comes to putting those shots on target and into the net.  Patience in creating quality continues to outweigh quantity...

Overall, the averages for Shots on Goal for winning teams has increased from XpW 1 (4.90) to XpW 2 (5.36); basically the better teams have gotten better and the losing teams have gotten worse (3.84 now) versus (4.10 in XpW 1).

I wonder how that trend will continue through the rest of this year?

Tthe 2% gap in Passing Accuracy between winning teams and losing teams has held from XpW 1 to XpW 2.

The gap in Shots on Goal has increased in losing teams to 10% as opposed to 9% (XpW 1).

The gap in Goals scored has remained near steady at roughly ~30%; though slightly smaller in XpW 2.

Losing teams still continue to take more Shots than winning teams; 12.74 (winning teams) to 12.80 (losing teams) but... that gap has dropped since XpW 1 - perhaps losing teams are looking to be more patient in their shot selection?

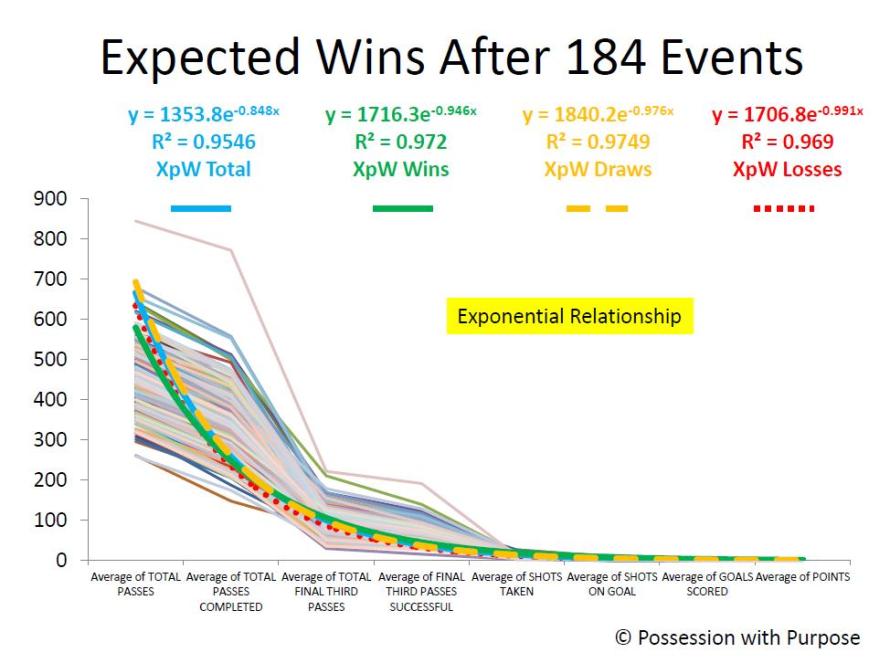
So how does the overall data relate in an Exponential Relationship?

Expected Wins 2 Trend-lines

Observations:

The light shaded lines are the lines of data as in XpW 1 - and the trend-line colors remain the same.

This time the R2 has dropped just a tad.98 to .95 - all things considered most would consider that correlation Rock Solid... I do - and the correlation of these data points, viewed as a whole, have a higher correlation together than Goal Differential (R2 = .88) to Points in the League Table.

Goal differential is usually a great indicator but it also remains a qualitative statistical indicator not a quantitative indicator.

Like last time there remains a difference in the R2 between winning teams, teams that draw, and losing teams; with draws now having greater correlation than wins.  Why?  I'm not sure - but as noted by the closeness of all the data points there still remains a fine line between winning, losing and drawing.

Last time I felt that helped explain the difference between mistakes or unlucky breaks - I continue to sense that is the main difference.  So might this be an indicator of luck - I don't know - what do you think?

I have seen discussions of late, on Telly, and in some articles written elsewhere, that focus more on 'space available' as opposed to just Shots Taken...  hopefully that trend continues!

I also remain hopeful that OPTA and other statistical web sites will offer up more critical events taking place in the Final Third...  One other article written since XpW 1 is my analysis (as promised in Xpw 1) on defensive indicators; here's a link to Hurried Passes and those details.

In closing:

I still don't have enough data, in my opinion, to offer additional thoughts on individual team performance relative to home and away games; that probably won't have statistical reliability until the midpoint of the season (game 323 - events # 646).

There are trends but I'll save that for another article, enough for now.

Best, Chris


How It Happened: Week Six

I know, I know, week seven is already starting. It's not my fault the schedule-makers started putting games on Wednesdays - I can barely finish catching up on the previous week's games before the next weekend begins. Here come my thoughts on the three games I caught from last weekend: DC United 1 - 0 New York Red Bulls

Stat that told the story for New York: 135 passes; 36 crosses; 19 shots in attacking third

ny6


This game wasn't too much different than any others for New York this year - they played passably but were lackluster, especially in the final third. As the image above shows, Red Bulls certainly saw enough of the ball in the attacking third to get a goal. But far too many of the possessions in attack were basically in slow motion. The Red Bulls sent in 36 crosses, yet none of them led to a goal. To build to these crosses, New York slowly passed the ball around for two minutes then fiiinnnaallllyyy got the ball to the flank to be sent in. This slow play let DC's back line get set and ready for any attack. If New York wants to regain last year's Supporters' Shield form, they'll need to find some urgency in attack and build some moves before allowing the opposition to get settled.

Stat that told the story for DC: 1675 career MLS games played by starting eleven

This game wasn't terribly interesting from a DC standpoint (they nicked an early goal from a set piece, then defended resolutely to eke out a 1-0 win), so I'm going to use this space to wax philosophical about this team and the state of the league. United re-made their roster this offseason with veteran MLS players, so much so that the starting lineup this week averaged 152 career games. And that includes two guys who drastically bring that number down: Cristian Fernandez (new to the league this year) and Andrew Dykstra (the team's usual backup 'keeper). Now, experience doesn't mean talent, and a criticism can be made that DC lacks difference makers. But if you took this same roster and put them in the 2010 MLS season, I have trouble imagining that they would miss the playoffs. Here in 2014, they'll likely be in a season-long scrap for one of the final playoff spots. I don't mean this shpiel to diminish DC or their roster; I just want to make a point that MLS has clearly improved over the last several years to a point where even a very solid roster will have trouble making the postseason.

Toronto FC 0 - 1 Colorado Rapids

Stat that told the story for Toronto: 134 recorded actions for Kyle Bekker; 85 recorded actions for Jeremy Hall

tor6


Not all 1-0 soccer games are boring, but this one definitely was. Sorry. The biggest thing that I gleaned from this one about TFC had to do with their central midfield. Kyle Bekker, a high-potential but so far low-performance Canadian, put in a fantastic performance for the Reds. This is only one game and I'm prone to hyperbole, but he kind of looked like a young Michael Bradley in the way he commanded the game. Contrast that with the performance of his midfield partner, the veteran Jeremy Hall. Hall isn't the same type of player as Bekker, better suited to playing sound positionally than creating chances, but he was clearly less influential than Bekker. This isn't meant to be a criticism for either player or Toronto as a club - the fact is, these are the team's third and fourth central midfielders, which means they're pretty well off as far as MLS teams go.

Stat that told the story for Colorado: 4 central midfielders in the starting lineup

For the second game in a row, Pablo Mastroeni started a midfield of Jose Mari, Nathan Sturgis, Dillon Powers and Nick LaBrocca. All four of those guys are central midfielders by trade, putting them in a diamond shape that doesn't provide much width. The fullbacks (especially Thomas Piermayr) and forwards (especially Gabriel Torres) did a decent job of providing that width, but the cramped midfield still struggled at times. Moving the ball through the midfield was a task for the Rapids, and switching the field from one side all the way to the other flank was quite a task for the squad. It comes as no surprise that the game's only goal came from one of the few successful switches of field that the Rapids pulled off; they'll need to continue doing that in the future whether they stick with the diamond midfield or not.

LA Galaxy 1 - 0 Vancouver Whitecaps

Stat that told the story for LA: Robbie Keane & Landon Donovan's heat maps

LAG6


Last week I wrote about LA's diamond midfield and how successful it was against Chivas. I left out a big part of why this was successful: the interchanging of the forwards with that diamond midfield. In Robbie Keane and Landon Donovan, the Galaxy have a couple of special players who don't fit the mold of any particular type of striker. Both of these guys' heat maps were all over the place against Vancouver, and it was their checking to the midfield and midfielders' willingness to run forward into the space that made them hard to defend. LA only scored once, but they looked dangerous on many other occasions thanks to this interplay.

Stat that told the story for Vancouver: Russell Teibert: 5 recoveries, 3 interceptions, 2 clearances

Vancouver has been starting two defensive midfielders for most of this season, generally featuring Matias Laba and Nigel Reo-Coker. Reo-Coker's poor play to start the season led to his benching in Los Angeles, and they were forced to throw regular winger Russell Teibert into that role this weekend. He looked better there than the usual guys, mostly because he has so much ability as a chance creator. Teibert gets pigeon-holed as a pure attacker, but he actually showed a real good ability to break up midfield play and keep possession in the holding role. Teibert played there some for the 'Caps in preseason as well, so I'm not sure where he fits in their long-term plans. I for one would vote that he sees more time in a holding or box-to-box role: he was a major reason Vancouver wasn't stampeded a la Chivas in Week 5 and brings a spark going forward that can also be helpful in that position.

Agree with my thoughts? Think I'm an idiot? Let me know. @MLSAtheist

MLS Prediction Contest - We Have a Winner!

After two weeks of Major League Soccer wins, losses, and, this week, mostly draws, the best predictors were... [googleapps domain="docs" dir="spreadsheet/pub" query="key=0At6qSdpic03PdE4zOE12WWNlSm0zeVBnaXd6SnpDQ0E&output=html&widget=true" width="500" height="300" /]

MLSAtheist and timbertyler tied for first place with 13 correct answers each (out of 20). Normally, we would have gone to the tiebreaker to determine the grand prize winner, but MLSAtheist, a valued contributor to American Soccer Analysis, graciously decided to withdraw his prize eligibility. That leaves timbertyler as the winner of a subscription to MLS Live 2013!

Congratulations to timbertyler; maybe Portland will follow his lead and start amassing some wins of their own.

ASA Fantasy League Update Round 2: A Terrible Case of the Nagbe's

This is your weekly reminder that you're doing MLS fantasy, and if you're taking part in our league you should probably set your rosters so you have an opportunity to win something TBD. And really, since you're probably not doing any work with the NCAA tournament going on, you have some time to make sure your lineup is good to go this week. If you aren't in our league yet, and for some reason you feel the strong need to join, you can do so by figuring out how to use this code: 9593-1668. We grade on a pass/fail scale. If you get in you passed. Here is the current week's worth of data. It's in a jpeg format because, frankly, tables show up for crap on our site and we'll be moving soon enough to this other site that... well, we'll tell you more when we're at that stage.

week2MLSFANTASYHere are the main take aways for this week.

- Stop making Darlington Nagbe your Captain.

- Will Bruin continues to make me look stupid.

- I'm average, and if you are below me, you are not doing yourself any favors.

- I'm ahead of both Matthias and Drew, so while I'm the idiot of the podcast I've so far shown to be the better fantasy player.

- I totally lucked out with Zack MacMath this week.

Now the below image is for the week 2 "dream team" which is basically how you could have gotten the most points last week. Interesting that no one from our league sported a 3-5-2 formation this week and that three main formations were kind of cycled through for everyone.

DreamTeam-week2

Good luck to you all, and we'll see if we can ever catch up to either Bazzo, Cris Pannullo or Chris Gluck. They look poised to possibly run away with this thing. Hopefully this week will set them back so the rest of us can feel better about ourselves.

How It Happened: Week Two

I'll be frank: either week two of the MLS season was much less exciting than week one, or I did a poor job of picking games to watch and analyze this week. My bet is that both are true. Anyway, onto the show in which I take a look at three games from the weekend and pick a stat or Opta chalkboard image for each team that tells the story of how they played (last week's version is here if you missed it):

Sporting Kansas City 1 - 1 FC Dallas

Stat that told the story for Dallas: outpassed 418-213, including 103-41 in the game's first half hour

A thought occurred to me when watching this game: Sporting Kansas City has to look a lot like a prototype of what Oscar Pareja wants out of his teams. From the formation to the high-pressing, KC has long made their money by manhandling opponents as soon as they get on the ball and not letting them get comfortable. In this game, Sporting came out fired up at home and simply punched Dallas in the mouth (not even completely a figure of speech - this game was brutally physical). The high-pressing from KC's entire team had FCD out of sorts for most of the first half, particularly the first 30 minutes, when they mustered only 41 completed passes.

But the Hoops managed a road draw against the defending champs, so the game wasn't completely a story of getting worked over. As the game wore on and Sporting found it difficult to keep up the constant pressure, Dallas was able to grow into the game a bit. They certainly were never dominant, but another very good game from Mauro Diaz and some smart counter-attacks allowed Pareja's team to stem the tide for the majority of the game. In the end, it was fitting that the slugfest of a game saw just two goals, both from set pieces, but Dallas should feel good about how they played as the game progressed and were able to steal a point.

Stat that told the story for Kansas City: lack of production from forward line: 15 offensive actions in attacking third

kc2

Sporting KC won MLS Cup last year and has unquestionably been one of the league's best teams for the last few seasons. But few would argue that this success is built on a very strong defense and midfield. The forward line has often been sort of an Achilles' heel for this squad, especially now that Kei Kamara has moved on. In this game, Graham Zusi was held out so he could stay fresh for CONCACAF Champions League action, and DP forward Claudio Bieler only came on for the last 13 minutes. But the five players who saw time at a forward spot for KC (Bieler, Dom Dwyer, Sal Zizzo, CJ Sapong and Jacob Peterson) combined to register 15 offensive actions in the attacking third. 

To be clear, that 'offensive actions' stat that's illustrated above might have been made up by me just now, but it encompasses successful passes, dribbles, and all shot attempts. Too often on Saturday, and really for the last few years, Kansas City has dominated the game until the last thirty yards of the field, where they lack ideas. Getting Zusi back will likely help, as would playing Claudio Bieler for a full 90 minutes, but Sporting will need some more creativity and production from their forwards if they hope to lift another trophy this season.

Chivas USA 1 - 1 Vancouver Whitecaps

Stat that told the story for Vancouver: only 53 passes in the offensive third (23 of which were after Kekuta Manneh came on in the 60th minute)

I tuned in for the Chivas-Vancouver matchup excited to see an offensive battle between two sides that combined for 7 goals in week one. Instead, I saw an early red card to the Goats' Agustin Pelletieri followed by a lot of dull possession for Vancouver against a surprisingly organized team in red and white stripes. After looking so deadly in attack against New York, the Whitecaps looked completely lost for ideas on Sunday, with the only forays into the offensive third seeming to come from chips over the top from the superb Pedro Morales. That all changed when Kekuta Manneh came on, as he attacked the Chivas defense with and without the ball, causing fits for Eric Avila and eventually scoring the equalizer for the 'Caps. Still, after playing 87 minutes against 10 men, Vancouver has to be rightfully disappointed at only earning a point.

Stat that told the story for Chivas: Mauro Rosales turning back the clock: 151 actions

chv2

The Seattle Sounders traded Mauro Rosales to Chivas this offseason because he was too expensive and too old to fit into the club's plans for 2014. Nobody even really argued with the decision, though Rosales is undeniably a classy player and won the league's Newcomer of the Year award in 2011. So far in 2014, playing in the red and white of the Goat Zombies, Rosales has looked a lot like the 2011 playmaker that Sounders fans knew and loved. Playing down a man, Rosales was everything you could hope from a smart, skilled veteran; he hoofed it up field when in trouble so his team could get organized, he led smart counter-attacks and he kept the ball when possible (with the help of Erick Torres, who also played very well). All in all, he registered 151 actions in Opta's chalkboard, 12 more than any other player and a whopping 47 more than his nearest teammate. Not bad for a washed-up 33-year-old.

Houston Dynamo 1 - 0 Montreal Impact

Stat that told the story for Montreal: Marco Di Vaio's non-existant heat map

mtl2

I've watched about 120 minutes of Montreal Impact soccer in the season's first two weeks, and just about every one of those minutes has been more impressive than I expected from the Impact this season. Despite having zero points from their first two games (both on the road), they've actually looked pretty good on the field. Justin Mapp is doing Justin Mapp things (like this awesome run & assist from week 1), Hernan Bernardello and Patrice Bernier are pinging beautiful balls to open up space, and Felipe and Andrew Wenger are getting in pretty good goal-scoring spots. So what's the reason behind the zero points? Well, not putting chances away against the Dynamo killed Montreal. ASA's shot numbers had their xGF at 1.15 this week, but there were plenty of other times that they wasted dangerous opportunities (one particular Wenger near-breakaway early in the first half stands out). If All-Star Italian striker Marco Di Vaio wasn't suspended, I have a hard time believing the Impact gets shutout last week.

Stat that told the story for Houston: 8 fouls conceded in the defensive third

This was another game where what I ended up watching did not line up with the expectations I had going in. After an open, attack-filled opening game with New England, Houston came out and didn't really do much offensively against Montreal. It was actually sort of a gameplan of old-school Dom Kinnear, as the Dynamo got an early goal thanks to a deflected Will Bruin shot, and then packed it in and made themselves hard to beat. They sat in two organized banks of four so that only the perfect ball from Montreal would be enough to beat them, and when it looked like they might get beaten, they did the professional thing and took a foul. Eight of Houston's 14 fouls conceded were in their defensive third, and while I can't offer much perspective on whether that's a high proportion compared to league average, I can tell you that many of them occurred when Montreal players were breaking away and getting ready to provide a scoring chance.

Agree with my assessments? Think I'm an idiot? I always enjoy feedback. @MLSAtheist or MLSAtheist@gmail.com

How it Happened: Week One

Hello friends. This is the first in what will hopefully be a weekly feature here at ASA by yours truly. First, the background: Not being a fan of any particular MLS team is hard. It's hard to follow an entire league of 19 teams. Seven or eight games a week are difficult to catch up on, even when they aren't all played at the same time. Previously, I've watched highlights and 'condensed games' to try to pick up which teams and players were playing well, but it just doesn't work. The only way to really learn a team's strengths, weaknesses and tendencies is by watching every minute of every game they play. There's no way I can do that with every team in MLS while still working a full-time job. Sorry.

My solution is this: I plan on committing to watching a full 90 minutes of three games per week. This gives me six teams that I'll feel that I truly know (at least for that week), and should certainly teach me a heckuva lot more than just if I just watched their highlight packages. Since this here is an analytical and statistic-focused blog, I'll break down each of the three games by one particular stat or Opta chalkboard image that I think told the story of the game for each team. Think this idea is idiotic? Love it? Please, let me know: feedback is always appreciated. But leave my mom out of this.

DC United vs. Columbus Crew

Stat that told the story for Columbus: 58% of successful passes in attacking half for the fullbacks

clb1

The above image is all of the completed passes for Crew fullbacks Waylon Francis and Josh Williams on Saturday. These two players are clearly defenders who aren't afraid to get forward, but the startling frequency with which they were able to get up the field against DC had to have alarm bells ringing for United fans. For folks who prefer numbers to images, here you are: 49 of the 85 passes that Francis and Williams completed (58%) were in the attacking half. That's a pretty solid attacking contribution from two guys who are listed along the back line.

This was made possible for Columbus by a couple of adjustments made by new coach Gregg Berhalter. Centerbacks Michael Parkhurst and Giancarlo Gonzalez split reallllly wide when in possession, allowing both fullbacks to get forward. This was made possible by holding midfielder Wil Trapp, who sat very deep to cover the gap between centerbacks. It's only one game, but it certainly looked like a good strategy in week one for Columbus.

Stat that told the story for DC: 1 attacking player's pass into the penalty area

dcu1

Really, the above image for Columbus tells a lot of the story for DC, as well: they got hammered because the Crew got the ball wide and stretched DC's shape like a bad hamstring. With a team full of new faces who clearly haven't learned to play with one another yet, the defense was abused by all the space Crew players were able to find. But I can't use the same stat for both teams, so here's what I got for United: one. One successful pass from any of the three players nominally deployed in attack (Eddie Johnson, Fabian Espindola, Luis Silva) that ended in the penalty box.

Seriously: take a look at the Opta Chalkboard above. I get that it's hard to complete passes in the 18, but for the three guys who are tasked with creating chances, there needs to be more than one completed pass that ends up there. Oh, and that one completed pass? It came from a free kick, and ended with a flick-on by Davy Arnaud that didn't even turn into a shot. There was a lot wrong with DC in 2013 and a lot wrong with DC last weekend, but if the new faces of Johnson and Espindola were expected to cure all attacking ills....Ben Olsen may be in for a rude awakening.

Portland Timbers vs. Philadelphia Union

Stat that told the story for Portland: 20 crosses in the second hour of the game

The Timbers came out for the season opener and were dealt a dose of their own medicine from the new-look Philadelphia Union. Playing in a 4-3-3, the Union clogged the center of the field, put a lot of pressure on Portland and really made it difficult for the home team to get into their possession game. But as any good team does, the Timbers made adjustments. After being credited with just two crosses from open play in the games first 35 minutes, Portland emphasized wide play with Michael Harrington getting forward and Darlington Nagbe flaring out wide. After the 35th minute, Opta credited Portland with 20 crosses from open play. Some of this was due to bombing the ball forward as they sought an equalizer late, but recording 10 times as many crosses was certainly the product of an adjustment made by the Timbers.

Stat that told the story for Philadelphia: 12 midfield interceptions & recoveries to start the game

As I said above, the Union started the game very strong, with their midfield really clogging up Portland's attempts to possess the ball. The midfield three of Maurice Edu, Brian Carroll and Vincent Nogueira seemed to be replicating some of what made Portland so successful in 2013: clogging the middle of the field and winning a majority of loose balls. Opta credits those three with 12 combined interceptions and recoveries in the game's first 22 minutes. However, as also noted above, Portland adjusted to the Union's set-up and began to emphasize wide play. The Union didn't really adjust to the adjustment, as the Timbers clearly became more and more comfortable as the game went on. After those 12 interceptions/recoveries in the first 22 minutes, Edu, Carroll and Nogueria only recorded seven more the rest of the game.

LA Galaxy vs. Real Salt Lake

Stat that told the story for LA: 2.39 expected goals; 0 actual goals

lag1

If you're at this site, chances are you know the concept behind expected goals. If not, scroll down a ways and read up. Anyway, look at the above image: that's not a map of shots that typically leads to a shutout. According to the numbers run by ASA's own Harrison Crow, a league average team would've finished 2.39 goals from those shots. They finished zero. If you aren't into the stats and would prefer the English commentator's version: Robbie Keane missed some sitters, Landon Donovan was unlucky not to finish any of his half-chances, and Juninho and Marcelo Sarvas combined for some speculative efforts that nearly bulged the ol' onion bag. Oh, and Nick Rimando had a magisterial day in net to keep his clean sheet.

Stat that told the story for RSL: Joao Plata's complete game

I'm cheating a little here because that's not a real stat, but any time there's a 1-0 game, it's tough to leave out any conversation about the lone goal scorer. In this case, that's the diminutive Ecuadorian, Joao Plata. Plata debuted for Toronto FC three seasons ago, and it seems like he's been around for a lot longer than your average 22-year-old. But it's true. Plata is only 22, and if Saturday night is any indication, he could be in for his best season in MLS yet. Not only was Plata's finish on the game's only goal very cool, he was consistently playing with a lot more tactical awareness than I've seen out of him in the past. Whether it was setting up Alvaro Saborio for golden chances or making intelligent runs to stretch the defense and open up space for Javier Morales, Plata had a very, very good game against LA.

American Soccer Analysis Prediction Contest - Week 2!

Well, wasn't that an exciting first week of games? If you said "no", you're probably a Revolution or Red Bull fan, but that's okay, there are still many, many weeks left in the season. There is, however, only ONE week left of the ASA Prediction Contest. Ten questions separating you from a shiny new subscription to MLS LIVE 2014. Can you handle it? Caaaaaan youuuuuu diiiigggg ittt?!  Only followers of American Soccer Analysis on Twitter (@AnalysisEvolved) will be eligible for the prize. So if you're not following us already... why not? We're cool guys. Some of us have beards, even. Beards are cool. What's cooler than a beard?

Now I’ll shut up and you can get to picking…

[googleapps domain="docs" dir="forms/d/1lzpzytcK8qPVz4ojZIsJgPBisf2cr1UOJlQWJwyzlFM/viewform" query="embedded=true" width="760" height="500" /]


And here's a mini-update of the top scorers after the first legs of the CCL matchups...

[googleapps domain="docs" dir="spreadsheet/pub" query="key=0At6qSdpic03PdHVUb05OVXk5TWZIRVdpWHpJOXo2ZkE&single=true&gid=0&output=html&widget=true" width="500" height="300" /]

Last Chance to Win MLS LIVE 2014 in our Prediction Contest!

First Kick is imminent! Get 'em in! For the first two weeks of the season, we are running a prediction contest to see who can best pick MLS and CCL games. If you answer the most total questions over the next two weeks, you win a subscription to MLS Live 2014. 

Only followers of American Soccer Analysis on Twitter (@AnalysisEvolved) will be eligible for the prize. We are doing this for two reasons: One, shameless self-promotion (well, we feel some shame, but we’re doing it nonetheless), and two, simplicity. We do not have to collect anybody’s name or personal information except for their Twitter handle (though if you have a Twitter account, let’s face it, you’re probably begging for the world’s attention anyway).

Now I’ll shut up and you can get to picking…

[googleapps domain="docs" dir="forms/d/1Cz8M2AkGYxha3xtHw9v_lOtkLTj2sFKQ8ABdoJIvq0w/viewform" query="embedded=true" width="760" height="500" /]