

Shot Limiting: Bringing the heat (maps)
/By Sean Steffen (@seansteffen)
Earlier this year, I decided the world needed a 30 page paper on shot limiting in MLS. Of course, the powers that be found this to be a tad self indulgent, and more accurately, sad that I had the time to do such a thing. They ended up talking me down to a slightly more readable 20 pages, which can be read here.
But my art will not be compromised, gosh darnit! There is still so much to be learned about this topic, and, more to the point, my obsession hadn’t been quenched. Several questions were raised within the paper that I simply didn’t have the necessary data to explore.
Chief among these had to do with the positioning of defensive lines. In part two of my paper, I plotted each player’s passes per game against defensive actions per game, in order to get a rough estimate for where on the field each players were getting their defensive actions. Though less than ideal, it was a novel work around in the absence of actual positional defensive data.
The initial data suggested that teams that limit shots tend to evenly distribute defensive actions along multiple defensive lines, however in the absence of positional data it could be nothing more than a suggestion rather than something concrete.
Furthermore, I had my own suspicions that the correlation between shot limiting and possession allowed in the final third, as outlined in part one of the paper, had a connection to what I was exploring in the papers second part in regard to defensive line spacing and positioning. From a tactical standpoint, it would make sense that teams that limit final third possession, have even lines better equipped to confront the ball higher, but, again, without that positional data, it wasn’t something that could be explored.
Since then, I have desperately sought positional data on defensive actions in order to further explore this topic. You can probably all see where this is going, but long story short, I was able to acquire 2015 positional data on defensive actions, and, with the graphical help of ASA contributor, Kevin Minkus, who created the incredible defensive action maps displayed below. I am now able to more deeply explore the relationship between shot limiting, final third possession, and where teams position their lines.
Before we get to the nifty maps, I want to briefly go over 2015 correlations between possession allowed in the final third to shots given up, because it’s extremely relevant to the tactical concepts we’ll explore with the maps.
In 2014, the correlation between shots against and possession allowed in the final third was 0.388, which was the highest correlation of the paper, for any full year— higher than possession, shots for and tackles per pass allowed.
In 2015 so far, that correlation is even higher, jumping to 0.4768.

Below to the right is a table of the raw data for 2015 through 8/14.
| Team | Games | ShtA | Third%A |
|---|---|---|---|
| SKC | 21 | 9.67 | 0.199 |
| LA | 25 | 10.6 | 0.235 |
| HOU | 23 | 10.78 | 0.235 |
| CHI | 22 | 10.86 | 0.222 |
| FCD | 22 | 10.91 | 0.244 |
| VAN | 24 | 11.25 | 0.236 |
| PHI | 24 | 11.42 | 0.233 |
| NE | 24 | 11.46 | 0.233 |
| NYRB | 22 | 11.95 | 0.268 |
| TOR | 22 | 12 | 0.252 |
| COL | 22 | 12.23 | 0.239 |
| ORL | 24 | 12.38 | 0.23 |
| POR | 24 | 12.38 | 0.267 |
| SJ | 22 | 12.59 | 0.252 |
| MTL | 21 | 12.62 | 0.26 |
| CLB | 24 | 12.71 | 0.275 |
| RSL | 24 | 13.38 | 0.278 |
| SEA | 24 | 14.54 | 0.263 |
| NYC | 23 | 14.61 | 0.244 |
| DCU | 25 | 14.96 | 0.269 |
Rather unsurprisingly, keeping opponents out of the final third seems to be a proven way of limiting their chances on goal. But how do teams go about doing this? This is where defensive shape comes into play and it’s something you can clearly see when you compare defensive maps of the best and worst shot limiting teams, which is something we will do below.
To begin, let’s take a look at the positioning of defensive actions (tackles, blocks, interceptions) amongst the league’s top four shot limiting teams: Sporting KC, LA Galaxy, Chicago Fire, and FC Dallas.
Sporting Kansas City
Before we get to the map, I’d like to point something out. Peter Vermes is a Greek God of shot limiting and his system has been the best in MLS at it since 2012.
| Year | Shots Against |
|---|---|
| 2015 | 9.67 |
| 2014 | 10.2 |
| 2013 | 8.9 |
| 2012 | 9.6 |
To to give you some perspective on just how much SKC outclasses the competition over this period, consider that the league shots against average from 2012 to present is 12.67 while SKC’s is 9.59 over this same period. Vermes’s 4-3-3 system has consistently been able to keep opponents under 10 shots a game for 4 years now, and here is how.

Sporting KC Defensive Actions by location
SKC is known for their high-press, and you can definitely see it on the map. There isn’t another team in MLS who has anywhere near the number of SKC’s defensive actions per game in their opponents half.
But high-press alone is not enough to limit shots. The Red Bulls have implemented a high-press this year and haven’t achieved nearly the same result. The real key to their success is where they dispossess the ball the most. As you can see, the majority of SKC’s defensive actions this year (and throughout the Vermes era) occur between 35-45 on the x axis, which is roughly the threshold of the final third.
By confronting the opponent as near to this threshold as possible, SKC is able to prevent opponents from getting deep enough into the final third to consider shooting (final third and “shooting position” are not one in the same).
Of course, this wall of defense has to be placed so high so SKC’s lines can stay connected as the forward line presses high. That is to say, SKC’s high pressure is the driving force of the teams overall defensive shape. Shape, however, is the operative term, as the high line of confrontation, alone, does not make their defense work.
As with the next three defenses we will explore, the key is having evenly distributed actions along both the midfield and defensive line, and having good spacing between these lines, so they work cohesively to create a double barrier of sorts.
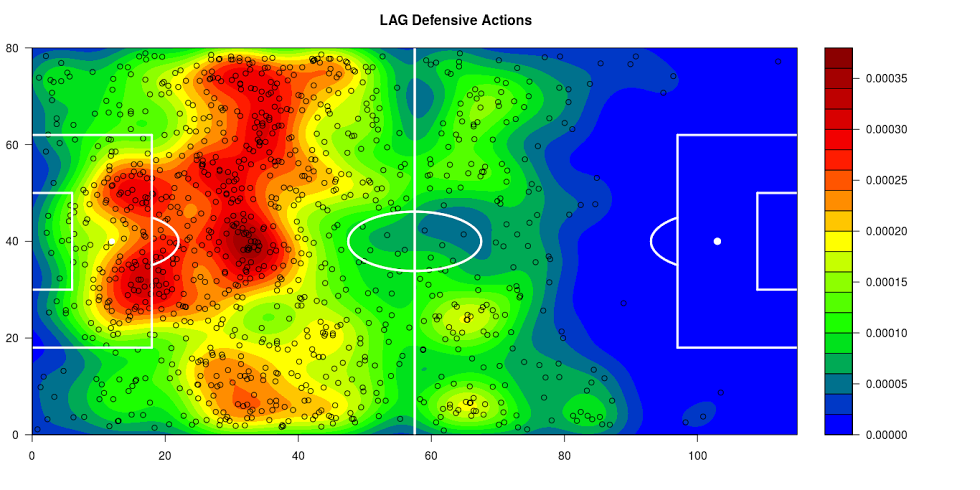
LA Galaxy
| Year | Shots Against |
|---|---|
| 2015 | 10.6 |
| 2014 | 10.2 |
| 2013 | 9.6 |
Since 2013, the LA Galaxy under Bruce Arena have almost been as impressive at shot limiting as SKC under Vermes. Just take a look at the numbers.
With two lines of four stacked on top of each other, the strength of the 4-4-2 is its ready made defensive blocking, and throughout Arena’s storied career, he’s managed to master its balance and intricacies.
Since 2013, LA has pretty much only been vulnerable after turnovers when their fullbacks and one of their center midfielders are caught high, usually isolating Juninho in front of Omar Gonzalez and AJ DeLaGarza. When the lines of four are actually set, however, they have proven to be near impossible to break down.
As you can see, LA’s main line of defensive action is slightly deeper than SKC’s, but not by much. When opponents enter the final third, they, much like with SKC, are immediately pressured—be it by fullbacks, midfielders, or even center backs pushed high.
But the key to success is what lies behind—yet another line, and one that is well spaced with the initial one. As you can see on the map, they have a solid stack of actions centrally, from the beginning of the final third, straight into the box.
It’s a system where everybody does their part equally, and it’s not surprising that it wasn’t until David Beckham left that the team really began to assume this defensive identity.
Chicago Fire
Some may argue that what Bruce Arena is able to do with that 4-4-2 is only possible thanks to their offensive pressure. While there is some truth to this, I would definitely judge the statement to be more false than true, mainly because of teams like Chicago this year, who was also one of the best shot limiting teams last year.

Teams tend to get the majority of possession against Chicago, but through a shape nearly identical to that of the Galaxy’s, Chicago is has been able to keep opponents out of the final third, as evidenced by having the 2nd lowest third%A (percentage of completed passes against in attacking third divided by total completed passes against.) in the league.
While the 4-4-2 is not a magic fix to for a struggling defense, as many teams who run it manage to give up a lot of shots (San Jose in 2014 gave up 16 shots per game in a 4-4-2 and Houston gave up 14), when it is implemented in the right fashion and with the proper personnel, it’s simply harder to break down than formations with more staggered lines, like the ever popular 4-2-3-1
FC Dallas
Speaking of 4-2-3-1, let’s look at a team that is doing it right. People often associate 4-2-3-1’s with a strong defense, mainly because it features not 1 but 2 defensive midfielders shielding the back line. The irony is, this false sense of securirity often leads to teams with overly attacking wingers. At this point, it’s a simple numbers game. A 4-4-2 has eight players defending, while a 4-2-3-1 can often have as few as six depending on the wingers and their willingness to get back.
The key to a defensively strong 4-2-3-1 is that at least one of the wingers drops back with regularity so that it defends in a shape similar to a 4-3-3. Last year, Dallas was notoriously bad at this, however, this year they have turned over a new leaf.

Dallas’ combined defensive usage from its wingers (the percent of team defensive actions they account for) is about 10%, up from last year. It’s not a stellar work rate, but it’s enough to help out their fullback to a point where they can more easily positionally link with the center midfielders, creating a tell tale map signature of a solid defensive line of four.
Now that we’ve seen what good shot limiting defenses look like, let’s look at the four worst shot limiting teams: RSL, NYCFC, Seattle and DC, in descending order.
Real Salt Lake
The entire tactical concept of this paper is that backlines need cover in the form of a strong line in front of them. Kyle Beckerman is one of the best defensive midfielders in the league, but one man does not a line make. This has been RSL’s problem for awhile, and is also one that is inherent to a diamond's shape.
RSL may not be running the diamond anymore, but they are still playing with diamond personnel. Javier Morales is a central midfielder that does not do much defending. By playing two strikers in front of him while simultaneously stressing both full backs getting forward, you’re essentially left with a mess of a line as Beckerman has to cover the entire field with the help of one of his shuttlers, which is the same six man defensive folly we discussed in regard to poorly executed 4-2-3-1’s

On the surface, RSL’s map looks fine, until you notice there is a drop-off between central actions around 30 up until the central actions around 10, which happen to be in the middle of the box. While their centerbacks certainly could be doing a better job, RSL doesn’t have enough cover in front of them as a lot of those actions in the central 20 areas come from the centerbacks themselves stepping forward.
It’s not a major deficit, but it has lead to them giving up about a shot more per game than the league average, and for a team that’s running a -2.59 shot deficit per game (shots for minus shots against), a single shot per game gets amplified in the results.
New York City FC
Even before the arrival of the old legs of Frank Lampard and Andrea Pirlo, NYCFC has been downright terrible when it comes to limiting shots and their defensive heat map tells the tale why.

Despite playing on the narrowest field known to man, NYCFC has found a way to give up tons of space for teams to exploit centrally as they enter the final third.
NYCFC does not have a strong middle pairing, and balls are simply not being confronted in central areas as opponents enter the final third. While it remains to be seen what Lampard’s defensive work rate is going to look like, Pirlo has so far proven to be this leagues greatest jogger since Cuauhtemoc Blanco, which will only compound the problem.
Perhaps NYCFC can find a way to work it out with Mix Diskerud and Tommy McNamara dropping deeper with more regularity to help out the Pirlo/ Andrew Jacobson tandem, although I would swap out Jacobson for Ned Grabavoy in the interest of follicle continuity.
Seattle Sounders
Seattle may give up the second most shots per game in the league, but they tend not to give up a lot of quality shots, which is why they are only 8th in the league in xGA. This was Seattle’s system last year as well, and they won the Supporter's Shield behind it.

Seattle is a team that sets their lines deep in favor of cramming the box and limiting shot quality. This allows them to get more offensive players higher up the field. In 2014, these players not only created more shots than their opponent, but shots of better quality as well.
But the problem with this kind of system is that it is balanced around the offense doing its thing. The second the offense stumbles and they start running a shot deficit, the system is a liability. This is what is happening to Seattle right now, and swapping out Brad Evans (who had been performing well) for Roman Torres isn’t really going to change that dynamic.
A better adjustment for Seattle during this period where their offense is struggling as players return to health, would be to simply have the center midfielders confront the ball higher up the field.
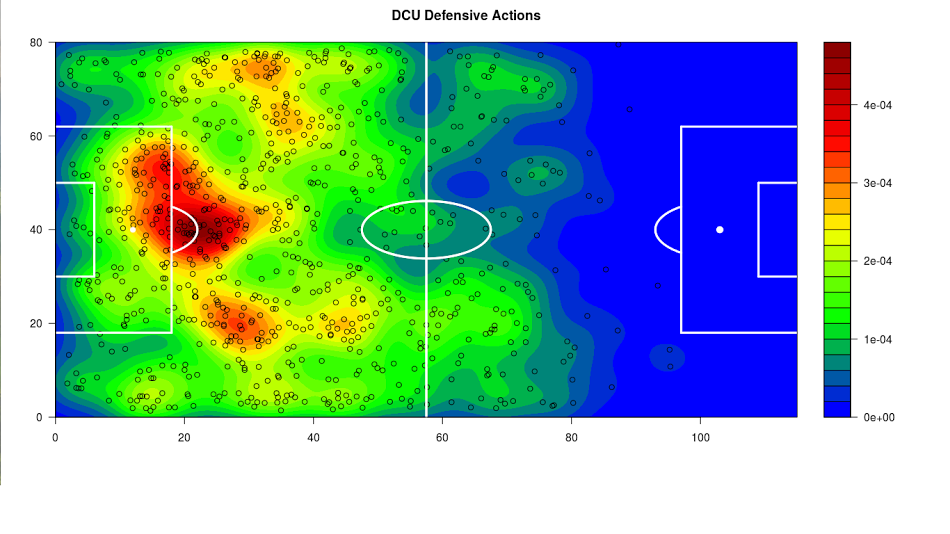
DC United
DC United has one of the strangest defenses around, and, for whatever reason, it seems to work for them.
This heat map looks like an elephant sitting on a duck.
DC is extremely compact and tends to allow opponents to have the ball on the wings. They also don’t confront the ball very high up at all, with the only action zone of any note being directly in front of the box.
Like Seattle, DC gives up a lot of shots. Unlike Seattle, DC doesn't manage to keep their expected goals against down by limiting shot quality. The model is just not good at reading how DC defends, and they have the third highest expected goals against average in the league.
The expected goals model does not take defender positioning into account and this is where DC is able to break it. DC United abandons the wings in order to limit shot windows. They do not challenge for the ball very often, preferring opponents be disposed by way of Bill Hamid, who may just be the best keeper in the league.
It’s a novel way for a team with shallow pockets to compete in a league that is being increasingly dominated by designated players, and it’s probably time people stopped writing it off as luck and start studying it more closely.
Conclusions
With the help of these defensive maps, we can see the link between defensive shape, limiting final third possession, and thus the number of shots allowed seems to be quite strong. Interestingly, the two worst shot limiting teams this year are actually good defenses. This is because shot limiting is not the only way to keep goals against down. It’s simply the only way our model can accurately measure.