

Forget Everything You Think You Know About Goal Kicks
/By Jared Young (@jaredeyoung)
The ball is placed on painted grass and a tall bright goalkeeper strides backward toward the goal. Now lunging forward the leg swings like a pendulum through the ball sending it bravely toward the sky. The onlookers lift their gaze as the ball reaches the peak of its flight. Two gladiators lock limbs below, jostling for position. They leap together in an effort to possess the falling ball. There is a deflection and the gladiators separate. They rejoin the play.
Long kicks by goalkeepers are a staple in soccer matches and they are a beautiful sight to behold, but that doesn't mean they are a good idea. By the end of this article I hope to convince you of that fact, even if the data isn't entirely perfect.
It’s long bothered me that goalkeepers always launch the ball into what seemed to be at best a coin flip proposition. A team has the ball (the most valuable thing on the field) and then they decide to just sling it up in the air to chance. Why does that make sense? The conventional wisdom is that 1) it’s better to get the ball as far up the field as possible and 2) even if the first attempt doesn't work the next possession will still be closer to the goal. These two elements of said conventional wisdom turn out to be true, but it’s the coin flip that becomes the glaring issue.
Let’s examine point one. The chart to the right is a result of examining every possession in the 2016 MLS season as measured by having at least one pass or shot attempted. The number represents the percent of time a goal was scored on a possession that started in that part of the field. The field is broken into 50 zones that are created by breaking the field into five equal sections vertically and ten equal sections horizontally.
The probability of scoring on any possession this season was 1.2% and clearly the probability of scoring increases as the team gets possession closer to the goal. Focusing on the horizontal impact here is a chart that also includes the distribution of possessions that started in each tenth of the field.
"p Goal" (measured by the percentages on the left that go up to 7%) is the odds a goal will come from a possession based on which 1/10th of the field the possession started in. "p Start of Possession" (the percentages on the right side that go up to 25%) is the probability that a possession will start in that 10th of the field.
The distribution of starting points is what I’ll refer to as a “normal state.” As we attempt to explore decisions like goalkeeper long balls there will come a point where the impact of that decision, potentially over the course of a handful of possessions, will disappear. When the distribution of possessions reverts to the normal state it can be assumed that the impact of a prior decision is no longer a factor in the game.
With point one easily confirmed the attention can turn to number two. To do so the dataset needs to be refined. For this analysis I’ve chosen just the possessions that start with a pass by the goalkeeper in the first horizontal zone and the middle vertical zone. This is the area highlighted in green to the right.
I selected this zone because it is a proxy for goal kicks but the dataset I’m using does not specify if the kick was in the run of play or was a goal kick. Normally goalkeepers who begin a possession from this spot are taking a free kick but there are other circumstances to be sure and the pressure on the goalkeeper in those run of play situations might dictate a longer ball strategy.

Next I segmented the resulting pass from the goal into two areas of the field. They are highlighted.
Zone one are goalie passes that land past the midfield line. Zone two represents goalie passes that stay within 40% of the vertical portion of the field. Certainly smaller areas might end up being more meaningful, but if my hunch is correct there should be an observable difference in outcomes between these large areas. There were over 3,200 kicks from the green zone to zone one by a goalkeeper to begin a possession in MLS last season. There were over 1,600 kicks from the green zone to zone two. Goalies completed just 33.5% of the zone one passes. That pass is actually significantly worse than a coin flip probably because the offense is typically outnumbered in that zone. Goalies complete over 95% of passes within zone two.
If the goalie happens to complete a pass into zone one then the offense scores on that possession 1.4% of the time, which is an above average rate. Conversely, if the defense gets possession, which it will 66.5% of the time, they have just a 0.9% chance of scoring. Confidence intervals around these numbers are about plus or minus 0.04%.
If you multiply the scoring odds by the probability of getting possession, the numbers come out in favor of the opponent 0.6% to 0.5%. Perhaps not a big deal. But remember the offense was hoping to create value on that second and potentially third possession as well. Here’s a chart showing that the second possession for the offense is indeed further up the field than the "normal state" (where the average possession starts), but just barely.
Normal State: percentage of all possessions that start in that 1/10th of the field.
GK team 1st Poss 2nd Pass >50: percentage of possessions that start in that 10th of the field which began with GK passes that traveled over half-field.
GK team 2nd Poss >50: the percentage of 2nd possessions that start in that 10th of the field which began with GK passes that traveled over half-field. In other words, the GK took a goal kick that went past half-field, his team lost the ball, then recovered it. This is the odds his team took possession again in each 10th of the field. Makes perfect sense, right?
Here is where things get a little crazy. Yes, the offense gets the second possession in a better than average state but they actually score far less than average. The probability of scoring a goal is just 0.7%. However the second possession by the defending team is strong at 1.5%. Do we need to look at a third possession? Looking at the opponent’s positions of gaining possession it appears the third possession is indeed back to normal.
Despite the average position the opponent actually has a 1.6% chance of scoring on that third possession while the original goal kick team gets back to the average of 1.2%.
To summarize, when the goalie begins a possession with a pass beyond the midfield line, his team has 1.2% chance of scoring on the next two possessions and the opponent has a 2.1% chance.
Time for the same analysis for the zone two passes. The first possession of the offensive team results in a goal 0.9% of the time. This is understandable given the team is beginning their possession further away from goal. Once the defense gets their first possession they have an average chance of scoring at 1.2%.
But again it’s the second possession where things get interesting. The offensive team scores 1.4% of the time and the opposition’s second possession results in a goal just 1.0% of the time. The results have flipped compared to the longer pass. Including the probability of completing the first pass then, a shorter pass from the goalkeeper results in a goal 2.3% of the time over the next two possessions and the opposition scores 2.2% of the time.
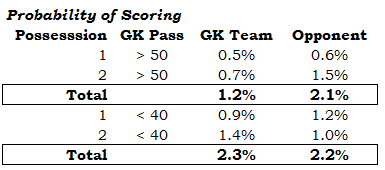
Sometimes shorter is better.
My hypothesis for why this shift occurs is due to the positioning of the opponent. The long pass allows the defense to get set deeper and shifts the possession odds in their favor. Meanwhile a shorter pass draws the defense forward and over the course of the two possessions increases the team’s chance of scoring. But let’s not forget nearly tripling the chances of keeping the first possession. To the right is a cheat sheet for the analysis.
If an average team decided to only have the goalie make passes into zone two and these results held, the team would improve their goal differential by 1.6 goals per season, which is significant when you consider it’s a minor adjustment. Further optimization could be developed as teams could analyze their win rate of zone one passes and perhaps also looks at the quality of their passing from the back line. At the very least teams should assess their strengths as a long ball versus passing team and adjust the goal kick strategy accordingly. Long goal kicks may be beautiful but they don’t appear to be a good idea.