Montreal and Philadelphia Swap Young Strikers

Okay, I'm sure by now that, given you follow our site, you've also probably been made aware of the fact that the Philadelphia Union (an underrated team in my opinion) traded their young 20-year old striker Jack McInerney to the Montreal Impact for their young 22-year old striker Andrew Wenger. The trade has a very Matt Garza for Delmon Young feel to it, leaving me with an odd taste in my mouth. Are the Montreal Impact selling low on Andrew Wenger? It's, at the very least, presumable that they know something that we don't about him and his nature. The question becomes, then, is that assessment accurate? Obviously the idea of a poacher is one that is met with a bit of contention,  in the sense of how do you measure being in the "right place at the right time" for an individual? However assessing the 86 shots taken by 'JackMac' from the 2013 season, we can know that no fewer than 57 of them came from inside the 18 yard box, courtesy of digging around on the MLS Chalkboards. It's obvious that he's a player that can get the ball in advantageous locations. Already on the season he's put together 12 shots and 11 of them have come inside the 18-yard box with 6 coming directly in front of goal. He's been appropriately tagged on twitter as a "fox in the box"---hold the sexual innuendos---and I think the term poacher probably comes naturally with that association. Unfortunately, that term may harbor and imply the idea that he's more lucky than good. I'm not sure I entirely buy that approach.


JmC-AWen

Meanwhile with everyone's attention directly focused on McInerney--audaciously stamped as 'The American Chicharito'--having already being called in the USMNT Camp for training during the Gold Cup, people are forgetting about Wenger and his potential that once made him a #1 overall MLS draft pick. Back in 2012, Wenger was painted as a potent and rising talent in MLS, named to MLSSoccer.com's 24 under 24 roster, coming in 7th overall. Just one year later McInerney jumped onto the list himself, rocketing to 4th overall, while Wenger was left off. The perpetual "what have you done for me lately?" seemed to come out in these rankings.

Wenger--despite all his talent--has run into a slew of various injury-related setbacks the last two seasons; it's so much failing to perform. The talent is still there, and I fully expect John Hackworth to tinker in an effort to get as much out of him as possible. The easy narrative here might just be the returning home to "revitalize his career" or something like that. Instead I think Philadelphia possibly got an undervalued piece in this move.

Looking at the last two years and a total of 31 shots Wenger has taken, 24 of those came from inside the 18-yard box, a higher percentage than that of JacMac. With that you can see above with xGpSH (expected goals per shot) that Wenger's average shot has been more likely to become a goal than that of his counterpart. Now, understand that this all comes with the requisite small sample sizes admission. Wenger has played less than half the amount of time as McInerney and has less than half the amount of shots. However, estimations based upon their current performances with creating shots has them near the same level as that of Eddie Johnson, Will Bruin and Chris Rolfe in years past.

Creating shots isn't everything. Creating shots in important positions is something. As we attempt to analyze the value of certain events on the pitch and how certain players are responsible for those events, we'll see some things and maybe understand how to assess performances. It's easy to overact to certain things that come with doing this type of analysis--- Such as McInerney, Wenger, Bruin and Rolfe all averaging about 4.0 shots created per game individually. That seems rather important, but there is additional data that is missing. How much was each shot that they created worth? What other attributes do they bring to the match? This is just an simple break down between two players and comparing how they've impacted their respective clubs.

Personally, looking at all of this data, I'm of the mindset that Montreal got the better player. However, it's extremely close and that isn't taking into account the rosters in which they are joining or how they might be utilized on the pitch with their new teams (4-3-3 concerns vs. 4-4-2 placement). I would say at this time the difference between the two is that one is younger and has more experience. That might be a bit simplistic approach but honestly both create shots the same way in the same space. McInerney does so at a higher rate but Wenger has made up for taking less shots with taking advantage of his more experienced partner, Marco Di Vaio, and feeding him opportunities.

This may be one of the more interesting trades in recent memory. I'm fascinated to watch what happens next and how each of these two players develop. Their career arcs will go a long way in providing the narrative for this trade and I'm not so certain that this is as one-sided as some people might think. Referencing baseball again, the Tampa Bay (then, Devil) Rays were largely regarded as having "sold low" on Delmon Young. We can now see, looking over the past decade,  that he never managed to put together all those tools that we once believed he had. The lesson being: don't be too quick to judge Philadelphia. This isn't necessarily going to be something as easily evaluated by just a single season, and time will reveal the significance of this day.

Predictive strength of Expected Goals 2.0

By Matthias Kullowatz (@MattyAnselmo)

It is my opinion that a statistic capable of predicting itself---and perhaps more importantly predicting future success---is a superior statistic to one that only correlates to "simultaneous success." For example, a team's actual goal differential correlates strongly to its current position in the table, but does not predict the team's future goal differential or future points earned nearly as well. I created the expected goals metrics to be predictive at the team level, so without further ado, let's see how the 2.0 version did in 2013.

Mid-season Split

In predicting future goals scored and allowed, the baseline is to use past goals scored and allowed. In this case, expected goals beats actual goals in its predictive ability by quite a bit.*

Predictor Response R2 P.value
xGD (by gamestate) GD (last 17) 0.805 0.000
xGD(first 17) GD (last 17) 0.800 0.000
xGA (first 17) GA (last 17) 0.604 0.000
GD (first 17) GD (last 17) 0.487 0.000
xGF (first 17) GF (last 17) 0.409 0.004
GA (first 17) GA (last 17) 0.239 0.024
GF (first 17) GF (last 17) 0.155 0.099

Whether you're interested in offense, defense, or differential, Expected Goals 2.0 outperformed actual goals in its ability to predict the future (the future in terms of goal scoring, that is). That 0.800 R-squared figure for xGD 2.0 even beats xGD 1.0, calculated at 0.624 by one Steve Fenn. One interesting note is that by segregating expected goals into even gamestates and non-even gamestates, very little predictive ability was gained (R-squared = 0.805).

Early-season Split

Most  of those statistics above showed some predictive ability in 17 games, but what about in fewer games? How early do these goal scoring statistics become stable predictors of future goal scoring? I reduced the games played for my predictor variables down to four games---the point of season we are currently at for most teams---and here are those results.

Predictor Response R2 P.value
xGD (by gamestate) GD (last 30) 0.247 0.104**
xGA (first 4) GA (last 30) 0.236 0.033
xGD(first 4) GD (last 30) 0.227 0.028
xGF (first 4) GF (last 30) 0.140 0.093
GF (first 4) GF (last 30) 0.022 0.538
GD (first 4) GD (last 30) 0.015 0.616
GA (first 4) GA (last 30) 0.003 0.835

Some information early on is just noise, but we see statistically significant correlations from expected goals on defense (xGA) and in differential (xGD) after only four games! Again, we don't see much improvement, if any at all, in separating out xGD for even and non-even gamestates. If we were to look at points in the tables as a response variable, or perhaps include information on minutes spent in each gamestate, we might see something different there, but that's for another week!

Check out the updated 2014 Expected Goals 2.0 tables, which now just might be meaningful in predicting team success for the rest of the season.

*A "home-games-played" variable was used as a control variable to account for those teams who's early schedule are weighted toward one extreme. R-squared values and p-values were derived from a sequential sum of squares, thus reducing the effects of home games played on the p-value. 

**Though the R-squared value was higher, splitting up xGD into even and non-even game states seemed to muddle the p-values. The regression was unsure as to where to apportion credit for the explanation, essentially. 

Introducing Expected Goals 2.0 and its Byproducts

Many of the features listed below from our shot-by-shot data for 2013 and 2014 can be found above by hovering over the "Expected Goals 2.0" link. Last month, I wrote an article explaining our method for calculating Expected Goals 1.0, based only on the six shot locations. Now, we have updated our methods with the cool, new, sleek Expected Goals 2.0.

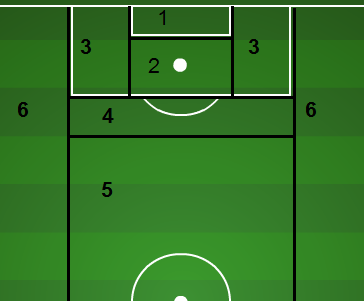
Recall that in calculating expected goals, the point is to use shot data to effectively suggest how many goals a team or player "should have scored." This gives us an idea of how typical teams and players finish, given certain types of opportunities, and then allows us to predict how they might do in the future. Using shot locations, if teams are getting a lot of shots from, say, zone 2 (the area around the penalty spot), then they should be scoring a lot of goals.

Expected Goals 2.0 for Teams

Now, in the 2.0 version, it's not only about shot location. It's also about whether or not shots are being taken with the head or the foot, and whether or not they come from corner kicks. Data from the 2013 season suggest that not only are header and corner kick shot totals predictive of themselves (stable metrics), but they also lead to lower finishing rates. Thus, teams that fare exceptionally well or poorly in these categories will now see changes in their Expected Goals metrics.

Example: In 2013, Portland took a low percentage of its total shots as headers (15.4%), as well as a low percentage of its total shots from corner kicks (12.3%). Conversely, it allowed higher percentages of those types of shots to its opponents (19.2% and 15.0%, respectively). Presumably, the Timbers' style of play encourages this behavior, and this is why the 2.0 version of Expected Goal Differential (xGD) liked the Timbers more so than the 1.0 version

We also calculate Expected Goals 2.0 contextually--specifically during times periods of an even score (even gamestate)--for your loin-tickling pleasure.

Expected Goals 2.0 for Players

Another addition from the new data we have is that we can assess players' finishing ability while controlling for the various types of shots. Players' goal totals can be compared to their Expected Goals totals in an attempt to quantify their finishing ability. Finishing is still a controversial topic, but it's this type of data that will help us to separate out good and bad finishers, if those distinctions even exist. Even if finishing is not a repeatable skill, players with consistently high Expected Goals totals may be seen as players that get themselves into dangerous positions on the pitch--perhaps a skill in its own right.

The other primary player influencing any shot is the main guy trying to stop it, the goalkeeper. This data will someday soon be used to assess goalkeepers' saving abilities, based on the types of shot taken (location, run of play, body part), how well the shot was placed in the goal mouth, and whether the keeper gave up a dangerous rebound. Thus for keepers we will have goals allowed versus expected goals allowed.

Win Expectancy

Win Expectancy is something that exists for both Major League Baseball and the National Football League, and we are now introducing it here for Major League Soccer. When the away team takes the lead in the first 15 minutes, what does that mean for their chances of winning? These are the questions that can be answered by looking at past games in which a similar scenario unfolded. We will keep Win Expectancy charts updated based on 2013 and 2014 data.

MLS Week 3: Expected Goals and Attacking Passes

In the coming days, Matthias will be releasing our Expected Goals 2.0 statistics for 2014. You can find the 2013 version already uploaded here. I would imagine that basically everything I've been tweeting out from our @AnalysisEvolved twitter handle about expected goals up to this point will be certainly less cool, but he informs me it won't be entirely obsolete. He'll explain when he presents it, but the concept behind the new metrics are familiar, and there is a reason why I use xGF to describe how teams performed in their attempt to win a game. It's important to understand that there is a difference between actual results and expected goals, as one yields the game points and the other indicates possible future performances. However, this post isn't about expected goal differential anyway--it's about expected goals for. Offense. This obviously omits what the team did defensively (and that's why xGD is so ideal in quantifying a team performance), but I'm not all about the team right now. These posts are about clubs' ability to create goals through the quality of their shots. It's a different method of measurement than that of PWP, and really it's a measuring something completely different.

Take for instance the game which featured Columbus beating Philadelphia on a couple of goals from Bernardo Anor, who aside from those goals turned in a great game overall and was named Chris Gluck's attacking player of the week. That said, know that the goals that Anor scored are not goals that can be consistently counted upon in the future. That's not to diminish the quality or the fact that they happened. It took talent to make both happen. They're events---a wide open header off a corner and a screamer from over 25 yards out---that I wouldn't expect him to replicate week in and week out.

Obviously Columbus got some shots and in good locations which they capitalized on, but looking at the xGF metric tells us that while they scored two goals and won the match, the average shot taker would have produced just a little more than one expected goal. Their opponents took a cumulative eleven shots inside the 18 yard box, which we consider to be a dangerous location. Those shots, plus the six from long range, add up to nearly two goals worth of xGF. What this can tell us is two pretty basic things 1) Columbus scored a lucky goal somewhere (maybe the 25 yard screamer?) and then 2) They allowed a lot of shots in inopportune locations and were probably lucky to come out with the full 3 points.

Again, if you are a Columbus Crew fan and you think I'm criticizing your team's play, I'm not doing that. I'm merely looking at how many shots they produced versus how many goals they scored and telling you what would probably happen the majority of the time with those specific rates.


 Team shot1 shot2 shot3 shot4 shot5 shot6 Shot-total xGF
Chicago 1 3 3 3 3 0 13 1.283
Chivas 0 3 2 2 3 0 10 0.848
Colorado 1 4 4 2 1 1 13 1.467
Columbus 0 5 1 2 1 0 9 1.085
DC 0 0 1 1 4 0 6 0.216
FC Dallas 0 6 2 0 1 1 10 1.368
LAG 0 0 4 2 3 0 9 0.459
Montreal 2 4 5 8 7 0 26 2.27
New England 1 2 1 8 5 0 17 1.275
New York 2 4 2 0 2 0 10 1.518
Philadelphia 2 5 6 2 4 0 19 2.131
Portland 0 0 2 2 2 1 7 0.329
RSL 0 4 3 0 3 0 10 0.99
San Jose 0 2 0 0 3 0 5 0.423
Seattle 1 4 0 2 2 0 9 1.171
Sporting 2 6 2 2 3 2 17 2.071
Toronto 0 6 4 2 2 0 14 1.498
Vancouver 0 1 1 3 3 0 8 0.476
 Team shot1 shot2 shot3 shot4 shot5 shot6 Shot-total xGF

Now we've talked about this before, and one thing that xGF, or xGD for that matter, doesn't take into account is Game States---when the shot was taken and what the score was. This is something that we want to adjust for in future versions, as that sort of thing has a huge impact on the team strategy and the value of each shot taken and allowed. Looking around at other instances of games like that of Columbus, Seattle scored an early goal in their match against Montreal, and as mentioned, it changed their tactics. Yet despite that, and the fact that the Sounders only had 52 total touches in the attacking third, they were still able to average a shot per every 5.8 touches in the attacking third over the course of the match.

It could imply a few different things. Such as it tells me that Seattle took advantage of their opportunities in taking shots and even with allowing of so many shots they turned those into opportunities for themselves. They probably weren't as over matched it might seem just because the advantage that Montreal had in shots (26) and final third touches (114). Going back to Columbus, it seems Philadelphia was similar to Montreal in the fact that both clubs had a good amount of touches, but it seems like the real difference in the matches is that Seattle responded with a good ratio of touches to shots (5.77), and Columbus did not (9.33).

These numbers don't contradict PWP. Columbus did a lot of things right, looked extremely good, and dare I say they make me look rather brilliant for picking them at the start of the season as a possible playoff contender. That said their shot numbers are underwhelming and if they want to score more goals they are going to need to grow a set and take some shots.

 Team att passes C att passes I att passes Total Shot perAT Att% KP
Chicago 26 17 43 3.308 60.47% 7
Chivas 32 29 61 6.100 52.46% 2
Colorado 58 27 85 6.538 68.24% 7
Columbus 53 31 84 9.333 63.10% 5
DC 61 45 106 17.667 57.55% 3
FC Dallas 34 26 60 6.000 56.67% 2
LAG 43 23 66 7.333 65.15% 6
Montreal 63 51 114 4.385 55.26% 11
New England 41 29 70 4.118 58.57% 7
New York 57 41 98 9.800 58.16% 6
Philadelphia 56 29 85 4.474 65.88% 10
Portland 10 9 19 2.714 52.63% 3
RSL 54 32 86 8.600 62.79% 3
San Jose 37 20 57 11.400 64.91% 3
Seattle 33 19 52 5.778 63.46% 5
Sporting 47 29 76 4.471 61.84% 7
Toronto 30 24 54 3.857 55.56% 6
Vancouver 21 20 41 5.125 51.22% 2
 Team att passes C att passes I att passes Total ShotpT Att% KP

There is a lot more to comment on than just Columbus/Philadelphia and Montreal/Seattle (Hi Portland and your 19 touches in the final third!). But these are the games that stood out to me as being analytically awkward when it comes to the numbers that we produce with xGF, and I thought they were good examples of how we're trying to better quantify the the game. It's not that we do it perfect---and the metric is far from perfect---instead it's about trying to get better and move forward with this type of analysis, opposed to just using some dried up cliché to describe a defense, like "that defense is made of warriors with steel plated testicles" or some other garbage.

This is NUUUUUuuuuummmmmbbbbbbeeerrrs. Numbers!

MLS Week 2: Expected Goals and Attacking Passes

Truth be told, last week was kind of a failure on my behalf. I trusted the data and information that was supplied by Golazo, and I'm not sure it really worked out as intended. A few mistakes have been pointed out to me, and while in general that could have been avoided by double checking the MLS chalkboard, I'm not sure that I really wanted to double check their work. This week I went straight to the Chalkboard for the data and then verified the total amount based off MLS soccer numbers. The result of the total numbers this week were a bit surprising.

Team shot1 shot2 shot3 shot4 shot5 shot6 Total xGF
San Jose 0 15 1 8 2 1 27 3.231
Colorado 1 8 4 3 1 1 18 2.228
Portland 2 5 6 3 4 1 21 2.219
New York 1 7 1 0 2 0 11 1.667
Sporting KC 1 4 4 4 3 2 18 1.654
Philadelphia 2 2 4 3 2 0 13 1.465
Chicago 2 2 2 4 2 2 14 1.446
Chivas 2 1 2 6 4 0 15 1.351
Seattle 1 4 1 0 6 1 13 1.263
Houston 1 2 4 3 4 0 14 1.2
Montreal 1 2 2 3 8 0 16 1.15
RSL 0 3 3 2 4 0 12 0.942
Toronto 0 2 2 1 3 1 9 0.653
New England 1 1 1 1 1 0 5 0.635
Vancouver 0 2 1 1 3 1 8 0.582
FC Dallas 0 2 1 2 2 0 7 0.577
Total               22.26

*Expected Goals 1.0 used for this table.

It's weird the last couple of games (talking the CCL match against Toluca midweek); San Jose has done an incredible job at generating shots against talented opposition. First, against a very talented Deportivo Toluca that currently sits second in the Clausura 2014 table, the Quakes managed to put together 20 shots. Liga MX isn't what they once were to MLS, but this is a very efficient showing. With that they barely squeaked by with a draw. This weekend was a much different story as they put the pedal to the floor and crashed through Real Salt Lake to draw a game they really had no business even being in to that point.

Portland is another team that stood out, but for less good things than bad. As Chris already alluded to this morning (he stole my thunder!), they've had an incredible amount of shots that have been blocked even before they get to the keeper. They're obviously getting into advantageous locations and taking shots, but their opponents are getting out in front and deterring those attempts. Which, if you were going to deploy a method for the stopping the Timbers' offense, that would seem to be it. Stay in front of them and prevent as many shots from occurring as possible. Portland has shown itself to be a terribly direct team.

Team    xGF     Goals  
San Jose 3 3
Colorado 2 1
Portland 2 1
New York 2 1
Sporting KC 2 1
Philadelphia 1 1
Chicago 1 1
Chivas 1 1
Seattle 1 1
Houston 1 1
Montreal 1 0
RSL 1 3
Toronto 1 2
New England 1 0
Vancouver 1 1
FC Dallas 1 1
Total 22 19

As you saw last week, our metric predicted under the total amount of goals scored and this week we were actually over. Again this speaks to the strength of long-term averages, and you're frequency going to be bouncing around the total amount. But the important thing is that we're close, and that we understand where we came up short and where we went over. New England, Vancouver and FC Dallas are all clubs that were lucky to even make the "50%" cut off because they just barely projected for a goal. But that was because we round up to the nearest whole number.

New England was surprisingly the highest of the three clubs. I say surprising because they tallied the least amount of shots. Despite that they managed a couple of better shot locations.

    Team   Comp. Passes   Inc. Passes   Total     Pass%     KeyP
Philadelphia 76 35 111 68.47% 5
New England 44 22 66 66.67% 1
New York 53 38 91 58.24% 6
Colorado 26 20 46 56.52% 5
Seattle 59 54 113 52.21% 6
Toronto 15 19 34 51.72% 2
Sporting KC 38 29 67 56.72% 5
Dallas FC 26 11 37 70.27% 4
Houston 40 26 66 60.61% 8
Montreal 49 25 74 66.22% 8
San Jose 54 36 90 60.00% 10
RSL 50 15 65 76.92% 3
Portland 46 41 87 52.87% 5
Chicago 31 30 61 50.82% 7
Chivas 48 33 81 59.26% 8
Vancouver 31 22 53 58.49% 2

Lastly we have attacking third passing data. As you see, there were only two clubs over the "100" mark this week. Seattle and Philly both collected a large percentage of the total possession, which as we have talked about previously isn't necessarily what's important. It's about WHERE you possess the ball. Well, for Philadelphia it worked out well as they pretty much dominated New England. Pushing the ball into the attacking third, the Zolos limited the total touches of New England in dangerous locations and created plenty of opportunities for themselves.

However, Seattle is a different story. As shown in PWP, they dominated a lot of the raw numbers and even managed to finally produce a goal despite shot frustrations. But Toronto preyed on the counter attack and mental mistakes by Marco Pappa. They didn't need many chances, but in the future we'll have to see if they can continue to finish as efficiently as they did on Saturday. They sported the least amount of attacking touches in all of MLS with only 34 and while that obviously doesn't correlate 100% to goals scored, the more opportunities you have the more likely you're going to find the back of the net.

A Week One Break Down Of Shot Locations, Final Third Passes and xGF

HEY EVERYONE, WE HAD A WEEK OF SOCCER! YAY! Taking a quick look at this ghetto chart that I made, we see a little break down of the shot locations as well as some of the final third possessions. I'm still searching for the best way to display this data, but there are some interesting things here. For instance, I feel a lot less silly about starting Robbie Keane on my fantasy team after a quick look at the Galaxy's xGF, as he really should have scored at least one goal from the run of play--oh and then there is the whole business of missing the penalty kick. Besides that, we can also see that New York Red Bulls were forced into long range shots and couldn't dangerously penetrate the 18-yard box despite being one of three clubs with more than 100 touches inside the attacking third.

Team Att1 xG1 Att2 xG2 Att3 xG3 Att4 xG4 Att5 xG5 Att6 xG6 xGF Passes Completed  Total Passes AP%
Sounders 0 0 0 0 2 0.142 7 0.371 0 0 0 0 0.513 57 102 0.559
Sporting 0 0 2 0.354 3 0.213 3 0.159 1 0.023 0 0 0.749 45 86 0.523
Chivas 0 0 4 0.708 2 0.142 4 0.212 0 0 0 0 1.062 88 137 0.642
Fire 0 0 0 0 1 0.071 4 0.212 0 0 0 0 0.283 58 85 0.682
Galaxy 0 0 8 1.416 4 0.284 13 0.689 0 0 0 0 2.389 116 147 0.789
RSL 0 0 4 0.708 1 0.071 3 0.159 0 0 0 0 0.938 75 104 0.721
Timbers 0 0 6 1.062 1 0.071 5 0.265 0 0 1 0.035 1.433 106 154 0.688
Union 0 0 2 0.354 2 0.142 4 0.212 0 0 0 0 0.708 68 105 0.648
Dynamo 0 0 10 1.77 2 0.142 6 0.318 0 0 0 0 2.23 70 105 0.667
Revolution 0 0 5 0.885 3 0.213 6 0.318 1 0.023 1 0.035 1.474 60 103 0.583
FC Dallas 0 0 3 0.531 4 0.284 4 0.212 0 0 0 0 1.027 81 115 0.704
Impact 0 0 7 1.239 1 0.071 6 0.318 0 0 0 0 1.628 60 107 0.561
Whitecaps 0 0 5 0.885 3 0.213 6 0.318 0 0 0 0 1.416 86 125 0.688
NYRB 0 0 1 0.177 1 0.071 5 0.265 0 0 0 0 0.513 100 139 0.719
DC United 0 0 6 1.062 0 0 3 0.159 1 0.023 0 0 1.244 80 119 0.672
Crew 0 0 4 0.708 0 0 4 0.212 1 0.023 0 0 0.943 74 104 0.712
Total 0 0 67 11.859 30 2.13 83 4.399 4 0.092 2 0.07 18.55 1224 1837 0.666

Scoring ZonesZones 1-6 have been broken down by Matthias previously, and correspond to the map displayed on the right. xGF is simply expected goals for, and AP% is simply attacking passing percentage.

Looking at the xGF, shot location would predict approximately 18-19 goals being scored when in reality there were 26 total goals put through the back of the net. The shot locations were compiled using mlssoccer.com's Golazo and I'm not sure that the locations were entirely accurate. I plan on doing a bit of a look into how the break down works in regards to Goalzo versus the Chalkboard, and I really think that the use of the chalkboard will yield better prediction numbers, but that's purely a suspicion of mine.

Overall it'll be interesting to monitor this break down, and with that, maybe next time I'll do an xGD where teams could project how many "points" that they should have based on whether or not they should have won, drawn or lost a match. Taking that a step further it'll be interesting to see if the first 17 games has any insight to the next 17 games of the season. Here we go!