A Week One Break Down Of Shot Locations, Final Third Passes and xGF

HEY EVERYONE, WE HAD A WEEK OF SOCCER! YAY! Taking a quick look at this ghetto chart that I made, we see a little break down of the shot locations as well as some of the final third possessions. I'm still searching for the best way to display this data, but there are some interesting things here. For instance, I feel a lot less silly about starting Robbie Keane on my fantasy team after a quick look at the Galaxy's xGF, as he really should have scored at least one goal from the run of play--oh and then there is the whole business of missing the penalty kick. Besides that, we can also see that New York Red Bulls were forced into long range shots and couldn't dangerously penetrate the 18-yard box despite being one of three clubs with more than 100 touches inside the attacking third.

Team Att1 xG1 Att2 xG2 Att3 xG3 Att4 xG4 Att5 xG5 Att6 xG6 xGF Passes Completed  Total Passes AP%
Sounders 0 0 0 0 2 0.142 7 0.371 0 0 0 0 0.513 57 102 0.559
Sporting 0 0 2 0.354 3 0.213 3 0.159 1 0.023 0 0 0.749 45 86 0.523
Chivas 0 0 4 0.708 2 0.142 4 0.212 0 0 0 0 1.062 88 137 0.642
Fire 0 0 0 0 1 0.071 4 0.212 0 0 0 0 0.283 58 85 0.682
Galaxy 0 0 8 1.416 4 0.284 13 0.689 0 0 0 0 2.389 116 147 0.789
RSL 0 0 4 0.708 1 0.071 3 0.159 0 0 0 0 0.938 75 104 0.721
Timbers 0 0 6 1.062 1 0.071 5 0.265 0 0 1 0.035 1.433 106 154 0.688
Union 0 0 2 0.354 2 0.142 4 0.212 0 0 0 0 0.708 68 105 0.648
Dynamo 0 0 10 1.77 2 0.142 6 0.318 0 0 0 0 2.23 70 105 0.667
Revolution 0 0 5 0.885 3 0.213 6 0.318 1 0.023 1 0.035 1.474 60 103 0.583
FC Dallas 0 0 3 0.531 4 0.284 4 0.212 0 0 0 0 1.027 81 115 0.704
Impact 0 0 7 1.239 1 0.071 6 0.318 0 0 0 0 1.628 60 107 0.561
Whitecaps 0 0 5 0.885 3 0.213 6 0.318 0 0 0 0 1.416 86 125 0.688
NYRB 0 0 1 0.177 1 0.071 5 0.265 0 0 0 0 0.513 100 139 0.719
DC United 0 0 6 1.062 0 0 3 0.159 1 0.023 0 0 1.244 80 119 0.672
Crew 0 0 4 0.708 0 0 4 0.212 1 0.023 0 0 0.943 74 104 0.712
Total 0 0 67 11.859 30 2.13 83 4.399 4 0.092 2 0.07 18.55 1224 1837 0.666

Scoring Zones
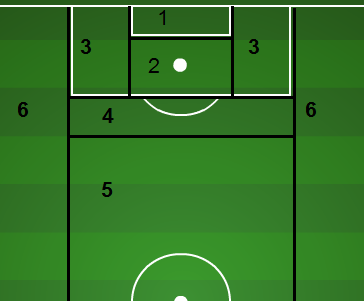
Zones 1-6 have been broken down by Matthias previously, and correspond to the map displayed on the right. xGF is simply expected goals for, and AP% is simply attacking passing percentage.

Looking at the xGF, shot location would predict approximately 18-19 goals being scored when in reality there were 26 total goals put through the back of the net. The shot locations were compiled using mlssoccer.com's Golazo and I'm not sure that the locations were entirely accurate. I plan on doing a bit of a look into how the break down works in regards to Goalzo versus the Chalkboard, and I really think that the use of the chalkboard will yield better prediction numbers, but that's purely a suspicion of mine.

Overall it'll be interesting to monitor this break down, and with that, maybe next time I'll do an xGD where teams could project how many "points" that they should have based on whether or not they should have won, drawn or lost a match. Taking that a step further it'll be interesting to see if the first 17 games has any insight to the next 17 games of the season. Here we go!

Possession Confusion

Consider every conversation ever had about soccer tactics. I would bet 99.9% of them touched on one specific subject: possession. Whether it’s the men’s league team you play for, or the club team you cheer for, isn’t more possession always a good thing? I can’t answer that question confidently, but I will explore it. The first obstacle to analyzing and discussing possession in MLS is the data itself. We get our data from Opta, and this is what Opta defines as possession:

During the game, the passes for each team are totaled up, and then each team's total is divided by the game total to produce a percentage figure which shows the percentage of the game that each team has accrued in possession of the ball.

“Possession” in Opta’s data is thus a measure of the proportion of completed passes in a match for each team, not a proportion of time. A lot of short, quick passes will accrue possession for a team that may only have the ball for a matter of seconds. This isn’t necessarily bad or good. It is what it is, and we’ll work with it.

Not all passes are created equally---or better put, not all teams' passes average out to be equally effective---but for a moment let’s suppose that they are. It’s hard to gather data on the value of each pass, and hard to then weight teams’ passes accordingly. So let’s just stick with the assumption that all teams' passes are equally effective. Perhaps someday we can sit around drinking beer and punching holes in that assumption. Today is not that day.

Under that assumption of equal passes, a team that completes a higher proportion of passes than its opponent will likely have strung together effective buildup more often than its opponent. Having created more effective build up, that team will likely have earned more scoring opportunities than its opponent. Having earned more scoring opportunities than its opponent, that team will be more likely to score goals and nab points. So this sort of possession should really imply sunshine and rainbows for the participating team. Seems like fair logic to me, but of course, I’m the one writing.

Looking at the tables—tables that were created with Opta’s version of possession, remember—we don’t see a strong correlation between possession and results. Four of the top five teams (by points per match) have 50% possession or less, but overall there is still a weakly positive correlation. We start to get significant results when we assess the correlations between teams’ possession and Attempt Ratios (0.60*), and again with Shots on Goal Ratios (0.55*). Those positive correlations imply that more possession coincides with more scoring chances. Of course, there is not nececelery a causal link.

Let’s take a look at this from another perspective. If we look at the relationships game-by-game—rather than team-by-team—the correlation between possession and scoring chances is still positive. The team that possesses the ball for a majority of passes (Opta’s definition) during any given match also tends to earn more scoring attempts than its opponent.

So far I’ve bored you with support for conventional wisdom: possession coincides with more scoring opportunities, and thus probably with better results.

But then I control for a few variables and shit goes haywire.

When I control for each individual team and whether or not they were playing at home, the relationship between possession and results is decidedly negative. In fact, a team that possesses the ball an additional 10% in any given match is expected to lose half of a goal on average, equivalent to about half of a point. For example’s sake, consider the Seattle Flounders Sounders. Over Seattle’s top four matches in terms of possession, it has earned just one point. However, during Seattle’s bottom four matches in terms of possession, it has earned eight points. Seattle is an extreme case, but a good example of what my model is picking up. Most teams individually seem to do worse when their possession is higher.

So more possession seems to correlate with more shots, and more shots seems to correlate with more goals, but for some reason more possession does not share a significant relationship with more goals. There is some missing information screwing with me, and I don’t have a definitive explanation for this strange paradox, but I will share a theory.

Each team has a style. Whether or not that style works is probably mostly a product of how well the players fit in, and how good those players are in the first place. Perhaps, in general, a style that focuses more on stringing short passes together tends to produce more shots than a high-risk/high-reward style, but this type of possession is not a necessary condition for success. Once each team develops its style, a certain amount of possession is required to optimize that style. For Montreal, it may be 49% possession, and for Portland, it might be 57%. This would explain the mild positive correlations between possession and shots across teams.

But why is it that, across games, more possession seems to correspond to less goals and worse results?

In a given game, if a team generates more possession—more passing by Opta’s definition—then perhaps that is indicative more of the opponent’s defense than of the desire of the team in question to possess. In other words, an excellent defense may not necessarily kill possession, but rather, push possession to less dangerous parts of the pitch. In this way, more possession is simply indicative of a frustrated team, not a team in control doing what it wants to do.

Without being able to conclude this thought exercise satisfyingly, I will propose a few things. First, that by charting each shot’s point of origin, we can begin to assess the quality of a team’s shots. And second, that possession data should be gathered from the distinct areas on the pitch. Possession in the attacking third is likely more valuable than possession in the defensive third. Some combination of these two measurements could very well help to explain the paradox we’re seeing with passing possession and team success.

*A perfect positive correlation would be 1.0.

A Post about Possession Stats

First of all, I had intended to have this up this past weekend and not on Thursday, my apologies. Secondly, I hope you all went out and looked at the stat table that Matty put together. Some great accumulation of data and in a nice little format. Great information and some stuff that isn't readily available anywhere else. Consume this, stat heads.

This past weekend during our recording session we talked about possession. This has been discussed time, and time again by people much smarter than myself. I won't waste a lot of my own words except to kind of bring things together.

Get more (much more) after the jump

Graham MacAree, wrote a brilliant piece about Opta stats and how they specifically calculate possession as a whole. To save you a bit of time, the summation of the finding is that Opta, at the time, calculates possession as pass volume. Meaning if you take the entire amount of pass attempts over the 90' minutes and divide that against each of the sides pass attempts you would get the reported amount of "possession".

Richard Farely does a great summation on why that's bad.

What does this mean? Let’s take a totally fake scenario. Barcelona plays three quick passes before trying a through ball that rolls to Petr Cech. It all takes four seconds, while Petr Cech keeps the ball at his feet for eight seconds before picking it up, holding it for five seconds, then putting it out for a throw in, which takes eight more seconds to put back into play.

Despite Barcelona having possession for only four of those 25 fake seconds, they’d have 80 percent of Opta’s possession (three good passes plus one bad, while Chelsea had only Cech’s unsuccessful pass). A logical expectation of a zero-sum possession figure would have that as either 16 percent or (if you credit the time out of play as Barça’s, since they’d have the ensuing throw) 48 percent Barcelona’s. Or, if you do a three-stage model (that’s sometimes reported in Serie A matches), you’d have 16 percent Barcelona, 52 percent Chelsea, and 32 percent limbo/irrelevant.

Now I say "at the time" because I attempted to do that tonight and my math was a bit off. So it's possible they also incorporate another statistic or something a long those lines. It's highly unlikely that they have gone towards a game clock as they still report in percentages.

Now it's fair to argue that the possession stat is meaningless, as Rui Xu (follow him on twitter, seriously, do it now) of Sporting Kansas City Performance and Statistical Analytics department thinks the following:

In general, I think they’re useless because they don’t contain any context. There is little-to-no correlation with points (if anything, there’s a slightly negative correlation in the MLS), and it doesn’t really tell you anything on a performance analysis level. Once you start adding context is when you’ll be able to draw some narratives. What is the possession percentage of the road team after they go up 1-0?  What was it before?  What is the possession percent of the home team when up 2-0 after the 80th minute?  You still have to be very, very cautious though.  - Numerology: How valuable is possession anyway?

But, it's countered very well by the Revolutions Timothy Crawford.

It’s hard to say exactly what possession necessarily does at this point. Barcelona out-possesses everyone, but they certainly dropped some points and big matches. There have been studies that have shown teams that win often lose the possession battle, but as my statistics classes taught me, correlation does not necessarily imply causation. No one is saying the way to win more matches is to never have the ball. It’s trying to find what part of possession is important, and then applying that to tactics.

Look, there is a mass amount of information that has basically flooded our ability to start analyzing the American version of "the beautiful game," and guess what, we're going to turn it into 1's and 0's because we're all a bunch of Yankee bastards.  But as we do that there are going to be plenty of things that we don't know. I'm not sold that Possession is useless, but I can't think of exactly what is needed to make it "good" or what "good" it could produce at distant point in the future.

Matthias at a certain point on our podcast mentioned specific time spent in attack or in the opposing third, versus the ball residing in your own defensive third.These things of course matter as they will eventually create opportunities for you or your opponent. That leads into the thought that not every chance on goal is documented by a shot. There are plenty of these that stopped just short by defenders or goal keepers making last ditch efforts.

That being said if you sit inside and lob in crosses hoping to get lucky, Charles Reep style, against a team such as San Jose or Los Angeles that is remarkably well versed in protecting such an attack, what does it really matter how much time you had in the attack. You wasted it.

That being said, Zonal Marking has done some correlative work between the relation of shots and possessions.

As you might expect, there’s a fairly obvious correlation – the more possession you have, the more shots on goal you’re likely to attempt, which is hardly a revelation.

The graph is interesting, however, for two reasons. First, because there are clear differences between the five separate leagues. Second, because there’s a handful of sides that don’t fit the pattern, and a lot of variation amongst the sides who see a lot possession.

The sides who are significantly ‘higher’ on the graph compared to the line of best fit are particularly efficient with possession – they have more shots than you’d expect for the amount of the ball they enjoy. Those who are significantly ‘lower’ are less efficient – they see a lot of the ball but record relatively few shots on goal.

Of course, being more or less efficient is not necessarily ‘better’ – because the sole purpose of possession is not to score a goal. Possession can be used as a defensive tactic to play out time when a side is ahead, and can be used to tire the opposition, before attacking more directly later on. The intention here is not to ‘rank’ sides, but to show their different styles.

I think the biggest thing is how he ended those paragraphs "but to show their different styles". I think the biggest thing that possession shows me, at least for the time being, is what type of team you are. Are you comfortable with the ball or without it? Do you run up-and-down the pitch all day, winning and then losing possession; pressing for that additional chance at goal?

Maybe current possession stats can't tell us all of that information. But looking at break downs and heat maps of possession and the pitch, where players possessed the ball the most, can supply and relate to us an (albeit short) narrative. And ultimately it's all about context and applying it to the data that we use. Understanding why we chose the data we did and then being able to articulate it back to others, who can point out deficiencies as well as some of it's strengths.

I'll include one additional link here on the back end of this thought. The site Soccer By Numbers by one Chris Anderson, producer of the book "The Numbers Game", hosted a post last year by Andrew Brocker. It doesn't really have anything different than what you've likely seen other places, however, I feel compelled to include it.

Brocker creates a neat little chart that displays the relational values between successful passing and maintaining possession of the ball between national clubs during the 2012 Euros. There are some interesting thoughts that go along with it and a tidy summary. I encourage you all to take a look.

Again, this isn't about coming to a conclusion, it's about continuing the talk and the attempt to raise the level of knowledge and understanding on a specific topic. I don't have hardly any of this figured out and I'm sure that there are much smarter people out there that could contribute much more. Should you be them or find their material, make sure you point us in that direction.

ASA Podcast: Episode III

Hello, there, you fine traveler. If you are of a west coast bias, you'll love today's show. First I have to say I'm really saddened by the fact that neither myself nor Matty worked in a "Third" joke with as much as we like to talk about cutting the field into thirds, and with this being our third podcast. *sigh* it didn't happen, maybe we'll save the jokes for Episode XXXIII. Anyway... we have the following for you.

We chronicle the life and times of your's truly, me, Harrison Crow, and little background as to why I created the site.

We talk a bit about possession stats: why they're important, why they are not, and how they are sometimes misleading. I referenced a blog post from Opta during this conversation. Please take a look, as it has a lot of really good information. I'm trying to come up with a bunch of material for a post later on today. I hope you all check it out.

We do mention Montreal and their Italian-influenced defense/counter-attack system and how it's helped them to a second-place start in the Eastern Conference.

Next, we chronicle the poor start for the Sounders, and perhaps why they have produced no goals despite an excellent possession percentage. We also mention Sporting Kansas City and the LA Galaxy, as well as the Portland Timbers and their dominance in possession.

We use the segue of the Portland Timbers to talk a little bit about Will Johnson. He's an underrated pick-up who has scored some amazing goals, and his ability to troll Alan Gordon is exceptional. Yep, he's gone for 3 games. Gordon, not Johnson...

And for those of you who didn't catch his brilliant goal at home, which effectively gave the Timbers 3 points, check it out below:

[youtube https://www.youtube.com/watch?v=aHMV-zPqccc]

Lastly we talked about our Game of the Week, the matchup between Sporting Kansas City and the Los Angeles Galaxy. While separated by 7 points in the table--with two games in hand for LA--Tempo Free Soccer's rankings has them 1 and 2 overall in MLS. We make our picks for who we like, why, and a few little facts to back it up.

We hope you enjoy the podcast!

[audio http://americansocceranalysis.files.wordpress.com/2013/04/american-soccer-analysis-podcast-3.mp3]