ASA Podcast: XXXVII The One Where We Talk ExpG

Don't get too excited about the title. We really don't go into this nearly as much as we probably should have. We draw a lot of our thoughts from the 11tegen11 article that sets the table nicely for the discussion, and we just kind of build around that. The audio for the first portion is a little maddening. We had a few problems, but everything was cleared up after about the first 20 minutes, so don't be deterred from finishing this one. There are some good points made by Drew and me, if I may say so, which make it well worth a listen.

[audio http://americansocceranalysis.files.wordpress.com/2014/02/asa-podcast-xxxvii-the-one-where-we-talk-expg.mp3]

ASA Podcast XXXVI: The Ghost of the Opta Pro Forum

A couple weeks ago the Opta Pro Forum took place and this week we take a look at some of the different studies that came as a result and some key thoughts that we pulled out of them. Covering such a wide range of topics we invited site friend Chris Gluck to talk with us about some of these various subjects. It was a lot of fun and I think we covered some interesting topics. During the podcast we also mention the movement of Hendry Thomas, who goes from Colorado to Dallas and the current status of Matias Laba with Toronto FC and his impending move away from the club. Enjoy!

[audio http://americansocceranalysis.files.wordpress.com/2014/02/asa-podcast-xxxvi-the-ghost-of-opta-pro-forum.mp3]

ASA Podcast XXXV: The Return of The Cast

We're back with the podcast!We return to review the snooze-fest that was the US Mens game last weekend. Stepping our big toe into a bit of the pre-season waters and turn the talk to some of the major moves around MLS and some of the clubs we've seen improve the most over the last few months. Lastly we give you a bit of insight to what's going on with the site and perhaps something to watch for in the coming months. Enjoy!

[audio http://americansocceranalysis.files.wordpress.com/2014/02/asa-podcast-xxxv.mp3]

Calculating Expected Goal Differential 1.0

The basic premise of expected goal differential is to assess how dangerous a team's shots are, and how dangerous its opponent's shots are. A team that gets a lot of dangerous shots inside the box, but doesn't give up such shots on defense, is likely to be doing something tactically or skillfully, and is likely to be able to reproduce those results.

The challenge to creating expected goal differential (xGD), then, is to obtain data that measures the difficulty of each shot all season long. Our xGD 1.0 utilized six zones on the field to parse out the dangerous shots from those less so. Soon, we will create xGD 2.0 in which shots are not only sorted by location, but also by body part (head vs. foot) and by run of play (typical vs. free kick or penalty). Obviously kicked shots are more dangerous than headed shots, and penalty kicks are more dangerous than other shots from zone two, the location just behind the six-yard box.

So now, for the calculations.

Across the entire league, for all 8,291 shots taken in 2013, we calculate the proportion of shots from each zone that were finished (scored):

Location Goals Shots Finish%
One 129 415 31.1%
Two 451 2547 17.7%
Three 100 1401 7.1%
Four 85 1596 5.3%
Five 51 2190 2.3%
Six 5 142 3.5%

We see that shots from zones one and two are the most dangerous, while shots from farther out or from wider angles are less dangerous. To calculate a team's offensive "dangerousness," we count the number of shots each team attempted from each zone, and then multiply each total by the league's finishing rate. As an example, here we have Sporting Kansas City's offensive totals:

Locations Goals Attempts Finish% ExpGoals
One 5 18 31.1% 5.6
Two 29 160 17.7% 28.3
Three 5 78 7.1% 5.6
Four 3 97 5.3% 5.2
Five 2 120 2.3% 2.8
Six 1 17 3.5% 0.6
Total 45 490 9.2% 48.1

Offensively, if SKC had finished at the league average rate from each respective zone, then it would have scored about 48 goals. Now let's focus on SKC's defensive shot totals:

Locations Goals Attempts Finish% ExpGoals
One 4 13 31.1% 4.0
Two 17 95 17.7% 16.8
Three 4 54 7.1% 3.9
Four 4 56 5.3% 3.0
Five 1 84 2.3% 2.0
Six 0 4 3.5% 0.1
Total 30 306 9.8% 29.8

Defensively, had SKC allowed the league average finishing rate from each zone, it would have allowed about 30 goals (incidentally, that's exactly what it did allow, ignoring own goals).

Subtracting expected goals against from expected goals for, we get a team's expected goal differential. Expected goal differential works so well as a predictor because teams are more capable of repeating their ability to get good (or bad) shots for themselves, and allow good (or bad) shots to their opponents. An extreme game in which a team finishes a high percentage of shots won't sway that team's xGD, nor that of its opponents, making xGD a better indicator of "true talent" at the team level.

As for xGD 2.0, coming soon to a laptop near you, the main difference is that there will be additional shot types to consider. Instead of just six zones, now there will be six zones broken down by headed and kicked shots (12 total zones) in addition to free kick---and possibly even penalty kick---opportunities (adding, at most, four more shot types). As with xGD 1.0, a team's attempts for each type of shot will be multiplied by the league's average finishing rates, and then those totals will be summed to find expected goals for and expected goals against.

Crowdsourcing the Western and Eastern Conferences

This past off-season we've put a lot of time into the project of obtaining shot data from the 2013 season. We've mentioned this before, and I'm sure you keep coming back waiting and expecting it to be here. We hope to release that soon. We are closing in on completing the data set, and once done, the data will be used to create goalkeeping ratings, game states analysis, and many other things that I haven't yet really mentioned. We (read: Matthias) are all extremely anxious to get started. But while we are winding down that project and getting ready for the regular season of MLS---and don't forget NASL---we have a pre-season exercise that we would like to conduct this month. This will be a brief and simple survey that tells us how you think each respective conference will finish after the regular season. This endeavor almost certainly won't lead to a perfect prediction of the final standings, but hey, maybe it will be close?

Take the survey here: https://www.surveymonkey.com/s/6KS3CL6

The intended use is to give a short snapshot of how we all view teams at this stage of the season. Recent outcomes seem to distort perceived notions and ideas that we originally had about something to the point that we're not sure what we thought prior to the occurrence of that specific event. It would seem our doubt is closely followed and probably facilitated by people claiming that it "wasn't a surprise that Montreal jumped out to an early lead in the East" or that "you shouldn't have been shocked to see D.C. United in the cellar." After something occurs, it's easy to feel like things were once forgone conclusions, even if beforehand it would have been hard to rationalize a one-dollar bet on that outcome.

Most of the time it's just an arrogant (and probably ignorant, too) pundit that would choose to speak for the entirety of those that enjoy and follow U.S.-based soccer. But, let me ask you, would you have guessed that the Timbers were going to be the #1 team in the West last year? A team that, despite it's dedicated following, looked miserable just one season ago. Who would have guessed that LA was nearly a wild card team? Think about the fact that Landon Donovan, who rightfully had been restored to the US Mens National Team roster, was in his best form in years and the Galaxy barely missed the single elimination match to get into the playoffs.

Here is a more current example:

There is no doubt in my mind that Philadelphia Union supporters, the Sons of Ben and Co., believe that they will be a top-3 club in the East. Yet, judging from the incredibly small sample size of the survey I've sent out, most don't believe they're a playoffs team at this point, and some even believe they are the worst team in the East. I admit that these votes were cast before the announcement of key additions Maurice Edu and Vincent Nogueira, both of whom are primed to make sizable contributions to their new club. But that underlines that fact that maybe we missed something. Maybe there are things that with overlooked in this fast and furious off-season. This is your opportunity to influence things and make your voice heard.

With most major European transfer windows closing this past weekend, the waters of MLS will settle and the rosters will start to set. It doesn't eliminate the possibility of an impact talent still signing with the league; there are interesting players in leagues that still have windows open.

Regardless, we are starting to gain an idea of the starting line-ups that in turn help us reference the order in which we could see clubs finish, and this gives us our best chance at making an intelligent and informed decision.

The link to the survey is below and will be available from now until the 21st of February. We have a very optimistic level of participation that we'd like to see which means that we're going to need some help to meet those obscured and honestly, pretty randomly chosen goals. This is the part where we selfishly push this on you as "the only way we can do this." It's an old---and maybe a bit contrived---tactic, sure. But the truth is that while we could be satisfied with the anywhere between 100 and as many as 250 unique and steadfast visitors that we have to this site, we won't be. We need more help.

I'll assume you have friends or people that would pass-off as such---Google calls them "acquaintances." I'd also suspect that you have a new-fangled social media option which you prefer. All I would simply ask is that you take this survey and then share it with others. Whether you love your Twitter like a new-born baby, or shun it as you should Eddie Johnson, tweet this baby out.  The more voices that we hear, the better the picture becomes, and the less probable it is that some idiot just comes and nukes your favorite team just because he's a supporter from an opposing club.

Take the survey: https://www.surveymonkey.com/s/6KS3CL6

*Please bare in mind you only get one vote. Just one. Use it wisely.

Vegas Posts Odds on MLS Cup 2014

I'm not usually interested in sports betting. I think most would find that surprising because we run an analytics site, and most analytics fit jointly, at least in Europe, with gambling. I avoid gambling for numerous reasons, but in general because I like the money I have and would hate to lose it.  However, there is a bit of value in looking at the betting lines and understanding which teams are favorites and why. It can give us a bit of early insight into who people consider "the best" teams. In case you missed it, Las Vegas odd makers metaphorically walked to the front of the class room and posted the first pre-season grades, identifying who they believe to the best teams in MLS. Basically they painted big red targets on the back of the LA Galaxy and Sporting Kansas City going forward.

Here is a little snap shot of the complete lines, courtesy of Steve Davis and NBCSports.

Here are few things that pop out at me just looking at this list.

First, the LA Galaxy are a club that we liked a lot going into the MLS Cup. We ranked them second in terms of the probability of winning the Supporters Shield and then third in the likelihood of winning the end of season tournament. Being cast aside by Real Salt Lake in the first round was not unimaginable, and yet it kind of took us all back for a moment. It's not surprising to me that they probably hoist the imaginary pre-season trophy at this point.

Second, Portland and Seattle are neck and neck in odds. If you thought the rivalry between these two I-5 teams culminated with the playoff match, you have another thing coming. This season is going to be rife with parity, and the difference between the 1st seed and the 5th could be substantially less than what it's been in a number of years. This is only going to throw more wood on the fire for clubs like Seattle and Portland, creating an even more tension filled stadium. Oh, hey Vancouver, you're there also... your just not "there" yet.

Third, Toronto goes from being on the worst teams in the league to big signings and having the 8th best odds to come home with silverware at the end of the season. The tides look on the brink of turning in the Queen City and could yield a very fun summer for the Reds. Some thing well deserved for their fans with the incredible support shown through some disappointing years, and really since their arrival to MLS in 2008.

Lastly, who could blame you if really you wanted to throw five dollars down on DC United. Eddie Johnson/Fabian Espindola, a rebuilt back line, and young potential US internationals in Perry Kitchen and Bill Hamid. 50-1 odds? Heck, I may just throw 20 dollars on them and become a season long United fan.

More rambling thoughts on formations

A big thanks to Dave Clark (or to whomever he got them from) of Sounder[at]Heart, from whom I'm about to rip the following quotes. Today during an pre-season opening presser with the media, Seattle Sounders head coach Sigi Schmid addressed questions concerning his roster construction and the possibilities of what type of formations the team could deploy this season. This is a pressing matter among most Sounders supporters who are attempting to peer inside the tactics of this unusual off-season of maneuvers for the club.

"We have an idea, as in terms of what we want to do. We want to play two upfront. We think we're better with two upfront and Dempsey, I think, is more effective when he has two guys in front of him... It's like I always say, people get too hung up in 'Is it a diamond midfield? Is it a 4-4-2? Is it a 4-2-3-1?' It's all about how players play on different parts of the field. Players like to play in certain areas of the field and they like to drift to certain areas. We just need to construct a system, if you want to call it that, and place guys on the field where they can compliment each other and be able to take advantage of where they like to play and what they do well."

Again, I love this because I think it truly reflects the current incarnation of soccer. Players are smarter now and more endowed with Soccer IQ than what they were years ago. Finding players that function best in certain areas of the field where your team needs it most should be the goal of any front office.

I always loved this quote from Dominic Kinnear, who told Matthew Doyle, the MLS Soccer Armchair Analyst, “You either have the ball or you don’t, I’m not a big fan of talking formations." There is just so much awesomeness there in the sense that Dom takes a complicated intrinsic function of the coach, and instead of further vague direction, he simplifies it.

Again, I've said it before that formations and placement matter. There was a reason that Seattle struggled last year when they used Adam Moffat in an awkward and unfamiliar location as they attempted to implement a diamond formation in an effort accentuate the talents of newly acquired Clint Dempsey. This ended up a bad decision for quite a few different reasons, outside of the fact that Adam Moffat just wasn't very good in his appearances at that position.

Another problem with the Sounders last season was their problem with certain players drifting across various places on the pitch, where I don't think the coaching staff had planned for them to be. This caused problems early in the season despite the level of talent at their disposal. A specific example would be Mario Martinez and his tendency to wander. This might not have been factored or accounted for as they deployed him to wide positions. Maybe they had expectations of him residing as a true winger in the vein of Mauro Rosales. I'm not sure this is specifically an issue so much as, if it's taken into account, you just get players to drift into the open spaces that are created with that movement.

You can call this a free flowing system or a variety of many other things. I suppose it doesn't really matter all that much. The important take away is that you have a method in place to score goals and prevent them from being scored against you. Whether you choose to exercise a formation to best do that or not, we're all judged by results. It'll be interesting to see how the Dynamo and Sounders continue to develop over the 2014 season.

Possession with Purpose: an introduction and some explanations

Please welcome to our little team of analysists and helpers Chris Gluck, whose PWP is going to be added to the metrics table this year---a solid instrument in telling us how teams have performed in turning possession into goals. Currently it's one of the best open-source metrics out there to tell us such things. I hope you'll enjoy his contributions as much I will - Harrison First things first --- my thanks to Harrison Crow and Matthias Kullowatz for the opportunity to post my Possession with Purpose Introduction on American Soccer Analysis.

If you’ve been following me this past year through Columbian Newspaper--out of southern Washington--you’ll know that I’ve been researching statistics in Major League Soccer. My intent has been to develop a simplified (Strategic) set of team performance indicators that may help others better understand soccer and how the outcome of a game may be better understood based on the primary inputs to the game.

Data for my research comes from documenting and analyzing all 646 MLS Regular Season games in 2013; the source data originates with OPTA and is displayed on the MLS Chalkboard and the MLS Statistics Sheet found through www.mlssoccer.com.

With that here’s my introduction on Possession with Purpose…

To first understand the context, I offer that this is one of the End States of my effort: create a simplified approach and documented method for measuring team performance where the output is an Index that (while excluding points) comes close to matching results in the MLS League Table.

Beginning with that End State in mind here is the End State product:

pic1

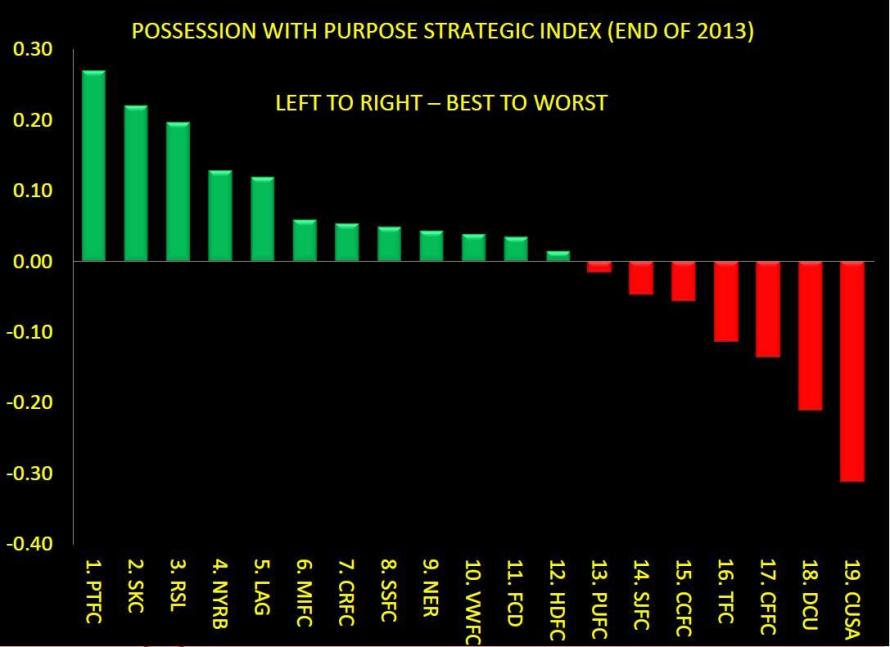
Observations from the Diagram…

Note that 9 of the top 10 teams in this Index made the MLS Playoffs last year with the Houston Dynamo finishing 12th in the Index.

For comparison, in benchmarking whoscored.com their Index only had 8 of their top 10 teams make the Playoffs, while www.squawka .com matched my 90% success rating, but the team they missed in the top 10 (New England) finished 16th in their Index.

From a strategic standpoint, the End State objective has been met; create a simplified approach and documented method for measuring team performance where the output is an Index that (while excluding points) comes close to matching results in the MLS League Table.

Defining the PWP Attacking and Defending Processes…

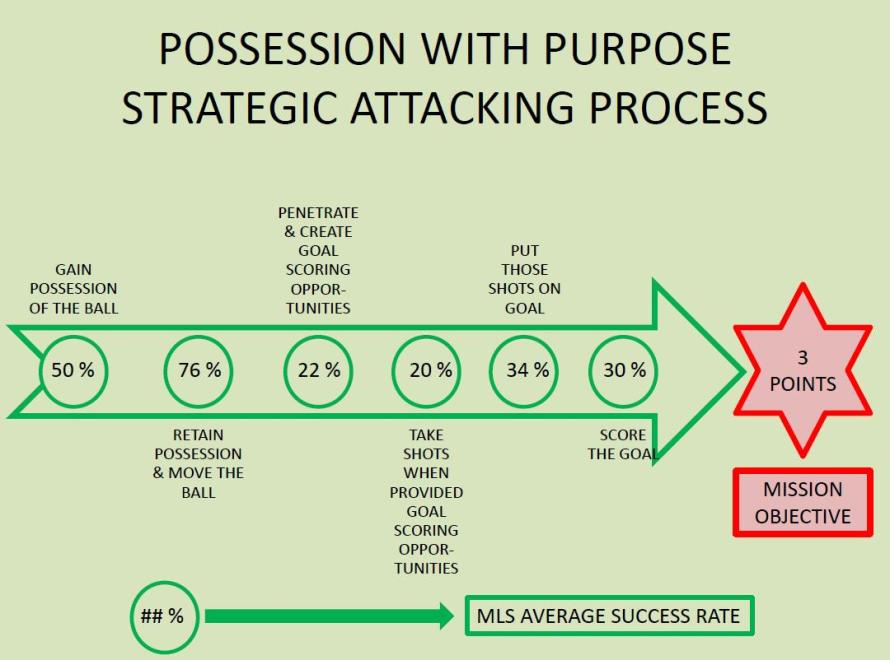
Here are the six steps in the PWP Strategic Attacking Process:

  1. Gain possession of the ball,
  2. Retain possession and move the ball,
  3. Penetrate & create goal scoring opportunities,
  4. Take shots when provided goal scoring opportunities,
  5. Put those shots taken on goal,
  6. Score the goal.

Here are the six steps in the PWP Strategic Defending Process:

  1. Minimize opponent gaining possession of the ball,
  2. Minimize opponent retaining possession and moving the ball,
  3. Minimize opponent penetrating and creating goal scoring opportunities,
  4. Minimize opponent taking shots when provided goal scoring opportunities,
  5. Minimize opponent putting those shots on goal,
  6. Minimize opponent scoring the goal.

Every step is this process has an average success rate (percentage) based upon data gathered from all 646 MLS Regular Season games.

Understanding the context of these steps versus other conditions and activities that influence the outcome of a game…

In case you missed it I call these Processes and the Indices “Strategic” to separate their value/meaning relative to other things that can influence the outcome of a game.

For me I have two other ways to classify information that can influence the outcomes in those steps. I have Operational conditions and Tactical metrics; provided below are some examples of each:

  • Operational conditions: Scheme of maneuver a team uses in setting up their system, such as flat-back four, flat-back three, double-pivot midfield, single-pivot midfield, bunkering with counterattacking, pressing high, direct attacking, possession-oriented attacking, weather conditions, location of the game (home/away), conference foe, non-conference foe, etc…
  • Tactical metrics: Locations of shots taken, shots on goal, and goals scored; penalty kicks, free kicks, crosses, headers won/lost, tackles won/lost, interceptions, clearances, blocked crosses, blocked shots, etc.

The diagram below shows the PWP Strategic Attacking Process with the average percentage of success rate in MLS for 2013. A more detailed explanation of each step is provided below the diagram.

pic2

Step 1: Gain possession of the ball: The intent behind this basic step should be clear; you can’t win the game if you don’t possess the ball to some extent. A second consideration about this step is that the more you possess the ball the less your opponent possesses the ball.

  • From a defensive standpoint there are any number of ways a team can work to gain possession of the ball; they include, but are not limited to, tackling, intercepting, clearing the ball, winning fifty-fifty duels on the ground or in the air, or simply gathering a loose ball based upon a deflection or bad pass.
  • For this Process the measurement of success is the percentage of possession a team has in a given game; note that in Soccer, the primary method for measuring possession is to add up the number of passes made in a game and divide into that the amount of passes one team makes (create a ratio percentage of possession); the opposing team has the difference between 100% and the percentage of possession that the other team has.
  • It’s not perfect but it provides a simplified ratio to compare one team versus another…

Step 2: Retain possession and move the ball: It shouldn’t be a secret to many that in most cases the team possessing the ball will need to move the ball in order to penetrate the opponents Defending Third and score a goal.

  • This is not to say a team has a minimum number of passes they need to complete to score a goal; for teams winning possession deep in the opponents Defending Third there may be times where the only thing needed is a quick shot on goal.
  • By and large, however, most teams – when they gain possession of the ball – do so in their own Defending Third and then move the ball (eventually forward) in a position where a teammate can create a goal scoring opportunity for another team member to take a shot.
  • For this process, the measurement of success is the team's passing accuracy percentage across the entire pitch; passes completed divided into passes attempted.
  • It’s not perfect, but it provides a simplified ratio to compare one team versus another; statistically speaking there are weaknesses in how this percentage is measured by the big data folks.
    • Throw-ins, for example, move the ball across the pitch from one player to another yet they are not officially counted as passes.
    • Successful crosses are also not counted as a successful pass even though the ball moves successfully from one player to another.
    • Oddly enough, when evaluating the data provided on the MLS chalkboard, an Unsuccessful cross is included as a Pass attempted (?!)
    • For the purposes of this analysis I had to count all successful crosses as successful passes; therefore my final pass completions totals will be slightly higher than what Opta provides. It is what it is…
  • I should also point out here that there are occasions when a team wins possession of the ball and takes a shot where no pass was completed. Like I said, this measurement method is not perfect but it is ‘equal’ in ignoring that exception for all teams.
  • Therefore the measurement itself has value in tracking the majority (bell curve) of activities that normally occur in a game of soccer. And as a reminder, these are Strategic steps in PWP; by definition a Strategic step will not measure to a level of granularity; that is where Tactical metrics come into play based upon an Operational condition where the team is applying pressure higher up the pitch.

Step 3: Penetrate and create goal scoring opportunities: Most know that a pitch is divided into three parts; the Defending Third, Middle Third, and Attacking Third. For the purposes of this effort, Penetration is associated with entering the opponent’s Defending Third with the intent to score.

  • For this Process, penetration is measured by dividing the volume of passes a team completes within the opponent’s Defending Third into the volume of passes a team completes across the entire pitch.
  • It’s not perfect but it creates a ratio that treats all teams fairly, and given the overall accuracy of the End State Index (90%), it’s a reasonable way to measure this step.
  • In order to measure this step I first had to manually filter, for all 646 games, every pass attempted and completed using the MLS Chalkboard; my thanks to MLS and OPTA for providing us ‘stats’ guys the opportunity to do that. With Golazo stats now available, that task will be easier next year. As a stats guy, it would have been inappropriate to switch measurement methods ¾’s of the way through the year.

Step 4: Take shots when provided goal scoring opportunities: This is, by far, the hardest indicator to measure, given how current data sites really lack granularity in how they identify/define ‘created goal scoring opportunities.'

  • I define a ‘created goal scoring opportunity’ as any pass, successful or not, that may have ended with another teammate taking a shot. That’s hard to quantify, but an example, if you will:
    • A fullback overlapping down the right side puts in a wicked cross that gets cleared at the last minute by a center-back, with his head. With OPTA and other data companies that wicked cross, though unsuccessful, is not quantified as a goal scoring opportunity created; it’s merely tracked as a clearance and an unsuccessful pass.
    • I disagree; the fullback did their job in putting in that wicked cross – what really happened is the defender also did their job in clearing it – therefore a “potential” for the attacking team to complete a created goal scoring opportuinty and take a shot was denied.
    • Both the attacking team and defending team should be statistically credited for doing what they are expected to do. Others may disagree…
    • But as a Head Coach, I would put to memory that the fullback did what was supposed to happen; create the chance – therefore in my books that player created a goal scoring opportunity.
  • For this Process, the step is measured by counting the number of Shots Taken compared to the number of completed passes in the opponent’s Defending Third.
  • It’s not perfect, but it’s measured in an unbiased manner for every team, and there will be instances where a shot can be taken without a completed pass or originate from a defensive error.
  • In going back to the example, as a Head Coach I would call that effort a “failed assist.” I think there is value in knowing the number of “failed assists” as much as there is in knowing “assists.”
  • By tracking “failed assists” it provides a pure, statistical way, to track individual player performance (tactical metric) that can influence team performance.
  • Bottom line on this one, as contentious as it may be for some, recall the End State of this Final Index… create a simplified approach and documented method for measuring team performance where the output is an Index that (while excluding points) comes close to matching results in the MLS League Table.
  • Given the accuracy rating of 90% in matching the top 10 Playoff teams this year I feel and think the approach to measure this indicator works.
  • If OPTA, or another data compilation agency starts to track “failed assists”, could an Index like this reach 100% accuracy?

Step 5: Put those Shots Taken on Goal: For the most part this is an individual statistic that is added up to create a team performance indicator.

  • For this process, the step is measured by dividing the number of Shots on Goal by the number of Shots Taken.
  • It’s one of the easier indicators to measure, and if you watch any level of soccer, it's pretty self explanatory – if the Shot can come anywhere within the dimensions of the Goal, it is considered a Shot on Goal. One of two things happens; it goes in or it doesn’t.

Step 6: Score the Goal: One critical objective of the game.

  • I say ‘one’ because indications, I see, lead me to offer that this game is not all about scoring goals.
  • In my research it appears to me that teams who defend better seem to take more points in games than teams that don’t defend very well.
  • A recent example in my End of Season analysis of Vancouver: in Western Conference competition, they scored 35 goals and gave up 35 goals; all told they took just 26 of 72 possible points – clearly, in this example, scoring goals did not result in wins…
  • Prozone, a noted professional sporting analysis company, offers the following in the article: “Using data from the last ten seasons of the Premier League, Anderson and Sally compared the value of a goal scored and the value of a goal conceded. They found that scoring a goal, on average, is worth slightly more than one point, whereas not conceding produces, on average, 2.5 points per match. Goals that don’t happen are more valuable than goals that do happen.”

In closing…

  • It’s not perfect, but it provides reasonable information in a reasonable format that has reasonable value when comparing the End State output to how the MLS League Table finished.
  • For those interested the PWP Strategic Attacking Index and Defending Index are provided below:

pic3

PWP STRATEGIC DEFENDING INDEX END OF 2013

  • In looking at these two Indices, note the number on the left; the difference between the Index number in the Attacking Index and the Defending Index is the number that appears to the left in the Final Strategic Index at the beginning of this article.
  • That may help explain why some teams finished above zero, as opposed to below zero in the Final Index.
  • Teams finishing above zero had team attacking percentages that exceeded their team defending percentages; in other words they were better in their attack against the opponents than the opponent’s were in attacking them.
  • Team success rates in these six steps will be used next year to begin to analyze how well the team is performing as the new season starts compared to performance the previous year.

Follow Chris on twitter at https://twitter.com/ChrisGluckPTFC, and keep up with his PWP metric all season! 

Should we judge the Eastern and Western Conferences As Independent Leagues within MLS?

So, I kind of alluded to this on Podcast XXXIV last week, but I wanted to start a conversation this week in regards to the very question that's been ringing in my ears. With the alignment changes in regards to the CONCACAF Champions League bids, it puts a new emphasis on winning your conference in 2014 rather than the Supporters Shield---which in times past has conflicted MLS between being conference-based system or as being a single-table entity. Now, with all these changes occurring, is there a reason to look at these two entities within Major League Soccer as being the same? It's obvious that there was a split or a line drawn between three different echelons (good, meh and poor) within the Eastern Conference where in the West it was much tighter and distinct between who was good and who was... well, bad.

When we enter 2014 and start looking at predictions, obviously you have to look at the picture as a whole and take into consideration and account for the inclusion of as many possible influences and pieces that could affect an outcome. That said, is it fair to compare the New York Red Bulls to the LA Galaxy anymore, or even compare Toronto FC to Chivas USA? These teams will have fewer and fewer overlapping influences, meaning that their results and outcomes are more conference-centric, right?

It's an interesting thought.

ASA Podcast XXXIV: The one where we talk 2013 Defenses: Eastern Conference

Okay, so today we start our review of 2013 and look back at Eastern Conference defenses. We call Chicago, DC and Toronto terrible; I name New England the best defensive team---alongside Sporting Kansas City---and then add Columbus Crew as a dark horse for potential lowest goal against tally in 2014. We were privileged to have with us Bill Vegas, aka @letskillrobots,on the podcast tonight so please go out and give him a follow and check out his work over at 'Everybody Soccer'. We sadly didn't get to talk about his children's soccer book review, Five Iron Frenzy, their amazing trumpet player Leanor Ortega aka Jeff the Girl, or Andrew Schaub...maybe we need a not American Soccer Analysis podcast where we talk about the other things outside the soccer pitch that connect us as fans. If so, I'm pretty sure he'd be one of the best guests for me to talk to.

Anyway, there were some moments in which Drew and I both messed up during today's podcast, and here follow the obligatory corrections.

A) I said that this is podcast 33... that's wrong. 33 was last year, this is Season 2, Episode 1 or 34... I'm not sure which I'm going to call it yet. Taking notes and general opinions.

B) Drew stated that Chad Marshall was traded for Steve Clark. That's not true, but it was all really close together, and considering that Seattle really got nothing for Clarke---kind of like Columbus gave nothing up for Marshall---it kind of is the same thing.

C) I said it was Ted Knuterson that ran StatBombs. It is Ted Knutson. I'm a goober.

D) I made 14 other mistakes... if you can find them all and list each one in the comments, you can have a $1 gift card to Amazon.com. REALLY!

[audio http://americansocceranalysis.files.wordpress.com/2014/01/asa-podcast-xxxiiii-the-one-where-we-talk-2013-eastern-conference-defense.mp3]