US Autopsy - World Cup 2014

By Matt Hartley (@Libero_Or_Death)

Well the transfer rumors coming off the back of the United States’ World Cup are ending in a depressingly familiar half-exciting, half-exasperating muddle. A steady flow of rumors about foreign suitors for Matt Besler ended with the revelation that he could choose between the damned (Fulham) and barely spared (Sunderland). Little wonder that being a one-club legend in Kansas City was more appealing.

We can still salivate over where DeAndre Yedlin might end up, and while that is a totally valid use of your day, he will be more of a project for clubs like Roma or Lyon than an immediate contender for playing time. Just because the US went further than England doesn’t make Yedlin better than Glen Johnson, does it? Anyways, a few interesting statistical tidbits:

Goalkeeper

Howard - sure, he made a record-setting 16 saves against Belgium, but his best was the recovery to save from Eder after he misjudged Nani’s shot. That kept the score at 1-0, allowing the US to take advantage of their best 90 minutes of soccer and get the result that would see the US out of the group.

The most incongruous stat for Howard was his distribution distance of 30 meters. This was the second shortest among teams that made it out of the group stages, but was that part of the US game plan? While Jozy Altidore’s absence affected the ability to play long, if Klinsmann had instructed his players to build from the back, it didn’t quite come off, as the United States was 8th out of the 16 second round teams in passes completed per game. Things broke down too quickly when the US had the ball, leading to a rather high amount of chances for the opposition.

Center Backs

Thankfully, the US centerbacks were pretty adept at protecting the castle. In examining how the centerbacks did, CBI (Clearances+Blocks+Interceptions) nicely conveys how busy our defenders were, and we’ll look at that stat in its per90 form.

Besler - I wrote a World Cup preview piece for Paste in which I posited that due to having the most secure spot on the backline, Besler would have to be the rock for the US. He finished with a very respectable 13.83 CBIp90, good for fourth in the tournament. In fact, finishing ahead of him was…

Omar Gonzalez, emerging from what seemed to be a long-term demotion to rack up a  15.07 CBIp90 rating, coming from an outstanding 12.14 clearances per 90. The US was certainly relying on Omar to dominate as they conceded the flanks and allowed crosses to rain in.

The third primary center back for the US, Geoff Cameron, was 11th overall for CBIp90 with 12.60. Spending time in midfield as well, Cameron is well on his way to using that versatility to become the American Phil Neville.

Main thing to touch on:

Looking at the top 20 defenders by the CBI metric, there aren’t a lot of big names there. Medel has a good background, Vlaar at Villa, Cameron at Stoke, Nigeria’s Omueruo is on the books at Chelsea, and a couple of guys in Ligue 1. Hell, there are four current MLSers in the top 20 CBIper90 rankings. If the US really wants players to move to “big” clubs, then the national team will need to start producing more performances that aren’t backs-to-the-wall, man-the-pumps nonsense. Matt Besler had a really damn solid World Cup, and his options were the 14-20 slots from the Premier League. It’s certainly a chicken and egg situation, but it makes you hope that Juventus will come in for Erik Palmer Brown so that we can see some US players grow into regular slots at teams that seriously compete for the Champions League.

Fullbacks

This can be the hardest position to judge in the game, I think. You’ve got to be all things to all people at fullback, and that can make the position difficult to analyze. For the US there seemed to be a fairly clear hierarchy going into the tournament:

    1. Fabian Johnson, the best player for all 10 outfield positions

    2. DaMarcus Beasley, well, we like him better than Chandler

    3. Timothy Chandler, the source for a million overstated concerns about   German-Americans’ Americaness

    4. DeAndre Yedlin, there for the experience.

Of course, Beasley played solid two-way ball, Johnson was a useful offensive tool while on the field, and Yedlin became one of the breakout players of the tourney. Since the United States played a very narrow midfield for large swaths of the tournament, offensive contributions from the fullbacks were always going to be vital to our success. Looking at key passes, Fabian Johnson ended up with a .90 KPp90, which was 36th among defenders, placing him behind such noted playmakers at Vincent Kompany, and oh holy crap, DeAndre Yedlin.

That’s right, our little roadrunner, with his limited minutes, contributed a very nice 2.27 KPp90, good for fourth among Squawka’s defenders, and that’s right, one place ahead of Glen Johnson. Sign him up, Brendan!

Midfield

This was the part of the field where the United States’ struggles seemed rather stark. The US ended up with 326.5 completed passes per game, which put them smack in the middle of the 32 team field, and above Brazil, Costa Rica, and Colombia. But looking at things a little more closely, the United States played in its own half 34% of the time, more than any other country, and 22% in the opposition’s half, fourth worst in the entire tournament.

Looking at individuals, Michael Bradley came in for a lot of criticism, but despite playing mostly in a new role further up the field, he managed to complete more passes per 90 (47.77) than Luka Modric (46.00), Sami Khedira (45.36), and Steven Gerrard (44.09). Sadly, this involvement didn’t translate into chance creation, as Bradley finished with 0.67 KPp90, somewhere in the 139-160 range overall. Sure, there’s where Ronaldo finished, but so did Gary Cahill.

Jermaine Jones did everything, winning 65% of his aerial duels, 54% of his take ons, and running a very competitive race for the USMNT’s “Holy crap, I can’t believe that went in” award.  Alejandro Bedoya and Brad Davis weren’t statistically significant, while Kyle Beckerman finished 14th among midfielders in the CBIp90 metric. Graham Zusi provided two assists, but otherwise seemed very forgettable. There just wasn’t a lot to hang our hat on offensively.

In Closing

The United States failed to make the transition to a more progressive style of play this World Cup, but the US did show that they can defend fairly well. Klinsmann’s challenge will be to integrate more players comfortable with keeping and moving the ball through midfield to ally with a decent defense and a serviceable striker corps. There’s a lot of potential in the pool to meld into a strong corps for Russia 2018. I’d expect Fabian Johnson to become a full-time midfielder in the future, and see extended run-outs given to players like Julian Green, Joe Gyau, and Will Trapp. Future columns will look at the players who are making a strong case for the national team, starting with September’s friendly in Prague against the Czech Republic

New England's roller coaster ride

By Matthias Kullowatz (@MattyAnselmo)

This site purports to be one that covers all of American soccer--the United States part of America anyway--but outside of my obsession with Sporting Kansas City, Harrison's love for Federico Higuain, and Drew's commitment to DC United, we don't cover the Eastern Conference as much. So let's talk about New England.

Currently, our playoff projections have the Revs at 60-percent chances of making the MLS playoffs, and our Expected Goals data shows they are just about league average. Considering New England sits in fourth place in the East, and the teams chasing it for playoff spots are the Columbus Crew and the recently humiliated Chicago Fire, 60 percent makes a lot of sense. The New England Revolution is probably a playoff team despite its recent skid.

As fans, it's hard not to get caught up in streaks. After all, streaks affect our team's chances of making the playoffs, and our criticism tends to follow those streaks of the losing variety. Typically, unless a major injury or other personnel change occurs, the team is not getting any better or worse relative to the rest of the league. Shit just happens. New England has lost seven consecutive games. But before that, it completed a seven-game undefeated run, tying just one of those. Which team is New England? The data tells an interesting story.

Period Final 3rd Pass% Final 3rd Ratio GD xGD xGDzero
Hot Streak 0.610 1.14 1.86 0.11 0.26
Cold Streak 0.680 1.56 -2.00 -0.05 -1.53
Season 0.630 1.28 -0.37 -0.02 -0.14

New England has gotten hammered in even gamestates over the past seven games. Even gamestates are perhaps the fastest-stabilizing of the Expected Goals statistics, so though this is a small sample, it still suggests that the Revs are not simply getting unlucky. Luck is likely a factor, but not the only factor. And I think the only reason the overall xGD wasn't so different (0.11 versus -0.05) is that New England played so often from behind that its opponents were willing to give up more shots for longer periods of time. 

While New England actually completed a higher percentage of passes in the final third during its cold streak, and spent more time than its opponents in the attacking third, that could probably also be explained by opposing teams being ahead and willing to allow shots and possession.

New England didn't play nearly as well as it looked during its hot streak, and it probably didn't actually play as bad as it looked during its cold streak. But the recent cold streak still shows scary and somewhat-sustainable signs that the Revs aren't as good as our 60-percent playoff chances say they are.

Portland Timbers: Comeback Kids?

I watched the Timbers go down 2 - 0 in the first half Wednesday night against FC Dallas before leaving disgusted for my indoor game. At halftime of my game, I noticed that Portland had come back to tie. Two common occurrences for the Timbers this year have been comebacks and ties, so perhaps it shouldn't have been that surprising. The Timbers have played nearly 400 minutes this season from behind--a quarter of their time spent on the field--which has given them plenty of time to win back the home crowd after early goals conceded. In all that time spent losing (nearly four game's worth) Portland has outscored its opponents 13-to-4. That's like four straight 3 - 1 wins. Even though most teams perform better when playing from behind, that still ranks Portland second in the league behind Vancouver (see chart below).

This begs the question, is Portland actually one of the best teams when facing a deficit, or might this be a product of some random variation? To the stats!

It turns out, Portland also does well by Expected Goals in losing gamestates. In fact, relative to the league, the Timbers are the best at generating quality and quantity of opportunities in these situations with an expected goal differential of +1.4. We know Expected Goals to be more stable, and thus it is probably a truer indication of what to expect in the future. Check out the chart below, scaled on a per 96-minute basis (basically, per game).

xGD When Losing

Team GF GA GD xGF xGA xGD GD Rank xGD Rank
POR 3.1 1.0 2.2 2.5 1.1 1.4 2 1
FCD 2.0 0.9 1.1 1.9 0.8 1.2 6 2
SEA 2.3 1.3 1.0 1.6 0.7 1.0 8 3
LA 1.8 0.0 1.8 1.8 0.9 1.0 3 4
NYRB 2.0 1.0 1.0 1.8 1.0 0.8 9 5
TOR 2.3 1.1 1.1 1.9 1.2 0.7 7 6
SJ 1.6 0.7 0.9 1.6 1.0 0.6 10 7
PHI 1.6 1.6 0.0 1.8 1.3 0.5 14 8
CHI 3.0 1.5 1.5 1.5 1.0 0.5 4 9
SKC 1.3 0.9 0.4 1.7 1.3 0.4 12 10
DCU 2.0 0.7 1.3 1.2 0.9 0.3 5 11
CLB 0.9 0.5 0.5 1.5 1.3 0.2 11 12
COL 2.7 2.3 0.4 1.6 1.5 0.1 13 13
MTL 0.8 1.8 -1.0 1.4 1.3 0.1 16 14
RSL 1.6 2.6 -1.0 1.6 1.5 0.0 17 15
NE 0.5 1.4 -0.9 1.4 1.3 0.0 15 16
CHV 0.6 2.9 -2.3 1.3 1.4 0.0 19 17
VAN 3.1 0.4 2.7 1.3 1.5 -0.1 1 18
HOU 0.8 2.5 -1.7 1.1 1.7 -0.6 18 19
Averages 1.8 1.3 0.5 1.6 1.2 0.4    

But wait! Hold the bus. There is one major confounding factor that we can control for here. Home field advantage. The Timbers have oddly found themselves frequently facing deficits at home, which means that a large portion of their time spent losing is spent in the friendly confines of Providence Park in downtown Portland. In fact, the Timbers lead the league in minutes spent losing at home--a weird stat, to be sure. Here's the same chart, but for teams losing at home.

xGD When Losing at Home

Team GF GA GD xGF xGA xGD GD Rank xGD Rank
SJ 3.3 0.8 2.5 3.5 0.5 3.0 5 1
NYRB 3.2 1.6 1.6 2.6 0.6 2.1 7 2
POR 3.6 1.0 2.6 3.0 1.0 2.1 4 3
FCD 2.8 0.0 2.8 2.1 0.4 1.7 3 4
COL 3.6 3.6 0.0 2.1 0.8 1.3 14 5
TOR 3.8 0.0 3.8 2.5 1.3 1.3 2 6
SEA 1.6 0.5 1.1 1.6 0.6 1.0 8 7
CHI 2.5 1.6 0.8 1.5 0.6 0.9 10 8
LA 0.9 0.0 0.9 1.8 1.0 0.8 9 9
NE 0.0 1.2 -1.2 1.4 0.6 0.7 16 10
CLB 0.8 0.4 0.4 1.7 1.0 0.7 13 11
PHI 2.4 1.7 0.7 1.9 1.3 0.6 11 12
VAN 5.1 0.0 5.1 1.5 0.9 0.6 1 13
MTL 0.7 1.5 -0.7 1.8 1.4 0.4 15 14
DCU 1.9 1.3 0.6 1.0 0.9 0.1 12 15
SKC 2.1 0.0 2.1 1.3 1.2 0.1 6 16
HOU 1.5 2.9 -1.5 1.7 1.6 0.1 17 17
RSL 0.0 1.8 -1.8 0.5 0.8 -0.3 18 18
CHV 0.0 3.8 -3.8 1.0 2.1 -1.0 19 19
Averages 2.1 1.3 0.8 1.8 1.0 0.8  

Even when I control for home field advantage, we still see the Timbers among the best teams at playing from behind, averaging 2.1 more goals than their opponents per 96 minutes. Is it the coaching? The players' mentalities? The raucous home turf on West Burnside? Luck? I don't know, but I know it's happening.


Sporting KC still has edge in the capital

If you come in from a certain angle, you can hype this evening's DC United-Sporting KC game as the Eastern Conference's clash of the week. The two teams enter this game tied for the second seed with two of the best goal differentials in the conference. With DCU playing at home, and Sporting missing half its team, the edge would appear to go to United. But not so fast. Despite being inseparable by points, DCU and Sporting are about as far apart as two teams can be by Expected Goal Differential. Sporting sits atop the league at +0.62 per game,* while DCU is ahead of only San Jose with -0.33. If we look to even gamestates---during only those times when the score was tied and the teams were playing 11-on-11---the chasm between them grows even wider. Sporting's advantage over DCU in Even xGD is more than 1.5 goals per game.*

To this point, as early as it is in the season, I have found that winners are best predicted by Even xGD, rather than overall goal differential. Though the sample size of shots is smaller for each team in these scenarios, the information is less clouded by the various tactics that are employed when one team goes ahead, or when one team loses a player.

Of course, Sporting will be missing the likes of Graham Zusi, Matt Besler, and Lawrence Olum, as they have for the past three games. The loss of those key players has mostly coincided with their current four-game winless stretch, and it would be tempting to argue that they are not in form. However, over those last three games, Sporting overall xGD is +0.27 per game,* and its Even xGD is +0.68.*

Making predictions in sports is generally just setting oneself up for failure---especially in a sport where there are three outcomes---but I will say this. Sporting is likely better than the +180 betting line I'm seeing this morning.

*I use the phrase "per game" for simplicity, but xGD is actually calculated on a per-minute basis in our season charts. Per game implies per 96 minutes, which is the average length of an MLS game.

Player Acquisition: The Tweeners

There is a thing that constantly steals my interest when it comes Major League Soccer. It's how teams choose to scout and evaluate talent that is already in the league. One thing that has been made quite clear with the financial constraints is that it is difficult to hold on to those players that hover around the $200,000 salary threshold, and yet aren't stars or obviously consistent difference makers. Player makers such as Chris Rolfe, Mauro Rosales and Bobby Convey have found new homes in MLS, either in the few months leading up to this season or since the first kick. The names themselves aren't specific references of importance, but rather examples of what happens in the off-season concerning players in the aforementioned pay range that are just casualties of cap situations in today's era.

These players we understand to a degree. They are interesting talents with a fair amount of room for critiquing, whether that be due to personality, problems with injuries or just inconsistent displays of performance from week to week. There are always one or two or even three (in this case) of these players that are available come the off-season.

Two of the three players went to clubs with the ability to take chances.

Chivas USA was obviously getting a steal in adding Rosales. Super Mauro, since being added to the roster, has accrued 17 key passes and 3 assists while producing 12 shots on his own. He leads the club in Total Shots Created.

DC United needed anything to help save their season and jump start their offense. The arrival of Rolfe in return for a bit of allocation money was seemingly a worthwhile risk--and his influence on Ben Olsen's chances of keeping the head coaching job can probably be debated to some extent. Prior to the trade, Olsen and DC United had only produced 1 point through 3 matches. Since the addition of Rolfe, they're now rolling at nearly 2 points per match.

Now, I'm not saying that Rolfe is truly responsible for the turn around. That idea would represent lazy analysis. In fact, DC United generated 34 shot attempts to its opponents' 36 in the first three games, and 108 to 112 since, so it's not like Rolfe's presence has indicated a stable improvement yet. Frankly, since MLS week 4, it's been the Fabian Espindola show at RFK, and that is a completely different discussion.

On to Convey, who didn't go to a team that had to take on a lot of risk. Instead he went to the defending Supporters' Shield-winning New York Red Bulls. He has been somewhat of middling attacking influence in his time on the pitch for the Bulls, adding 9 key passes and 2 shots in just under 700 minutes over his initial tenure this season.

WhoScored isn't exactly impressed. They have graded his performance so far by issuing him a 6.39 rating which is well below their league average rating for a player---which sits near 6.7. Squawka ranks him 16th on the  roster depth chart which mostly follows up that thinking being that WhoScored placed him 15th overall.

These three players represent teams that have taken advantage of a system available to them in an effort to improve their club. What is intriguing to me at this juncture isn't necessarily the impact they've made upon their current club but how their current clubs targeted them as being upgrades and financially worth their investments.

I'm sure that MLS teams have personnel that help front office types make decisions and help discern player talent and ability that make them right for the acquisition. I am familiar enough with certain clubs to be aware of the individuals that are involved in that process, and much of it seems archaic and awkward in method.

Mauro Rosales may have been less of a risk when it comes to Chivas. In fact it was kind of "duh" type moment that perfectly fell in their lap. The other side of the coin is that Rolfe and Convey were both risks, and heavy ones at that considering their price tags (before New York lapped Convey up, that is).

I would certainly concede that all are substantial talents within the US first division. But how they fit the rosters to which they were added to is a bit interesting.

Some could point to Convey's addition to New York as an attempt to add competition to the left side and some wide play making, Convey has instead shifted to the back line in the form of a full back. Which begs the question, was that the idea before he was added?

I, as well as many, had thought Luis Silva would be taking over the role of central play maker in Washington after the departure of Dwayne De Rosario. After the stumbles by Silva early on, I thought that Rolfe would take over that role, but instead he looks to be pushed out wide with Nick DeLeon, being featured more frequently in the central attacking role. Was this a decision made before acquiring him, and did the club think he could fill that role any better than some of the more natural wide midfielders who have moved clubs since?

Results-based analysis is often unhelpful, and in these cases, don't truly tell the story we're seeking in how MLS teams are valuing these types of players. I'm curious if there are any specific statistical values that teams could point to as to why they made this move--and please, I hope it's more than the assists or goals totals, or the fact that they're "winners." For all the talk about transparency in details for the league, it would be nice to see some of the true thought processes involved in analyzing these talents beyond tired cliches. Especially considering that all these clubs they have access to far better gauges and methods than what most of us have at our disposal.

Big Game in the Big Apple - my picks on who wins/loses in MLS for Week 12

Sorry, a bit late on this and not a lot of time to offer up detailed thoughts so here we go with my picks on who wins and loses this weekend keeping in mind I don't/won't pick draws...  my record without picking draws now hovers at 51%.  

New York at home to Portland - I've already offered up my thoughts on my home blog about this one.  If the Timbers don't make mental mistakes, don't get a red card, don't yield a Penalty Kick and don't score an own goal I think they win... Timbers take three.

Vancouver at home to Seattle - A big game in the great northwest with Cascadia Cup clash written all over it - Vancouver wins...

Columbus at home to Chicago - If the Crew don't win and Chicago does the early season dream start will have started to fade into a mid-season nightmare for Berhalter and his Crew; especially after being gifted three goals in Portland and still only coming away with a draw.  Columbus win...

New England hosts DC United - A huge test for Olsen and his crew coming off that disappointing draw to the worst team in MLS, Montreal.  Can the Revolution continue to win - since I can't pick draws I go with New England to win...

Colorado at home to Montreal - Really - is anyone willing to bet Montreal wins this game?  Colorado wins...

Real Salt Lake entertains FC Dallas - Perhaps a pivot point for FC Dallas as the mid-season approaches.  There might be room this week for Dallas to walk in and take 3 points - RSL are unbeaten this year and if all else fails I can see a draw with these two teams... but Plata should be a difference maker this game - along with the ever under-rated Grabavoy - RSL wins...

LA Galaxy at home to Philadelphia - Is this another one of those stunners for the Union?  Hard to say but with Donovan returning far to early, in my opinion, from the USMNT I see some fire in his eyes and the Union possibly getting crushed... LA wins...

San Jose entertains Houston - with Wondolowski missing, and rightly so... and Davis missing, and rightly so... this has all the makings of a draw but I think Houston wins with a better defense...

Best, Chris

You say you want a Revolution? Possession with Purpose From a Different Angle

A superb run with five wins and a draw in six games; by most standards that is a compelling argument for consistency.  I agree and their overall Composite Possession with Purpose Index rating continues to climb. They've (New England) climbed from 17th in PWP (week 5) to 7th after week 11; a superb shift of 10 full places in 6 weeks.

So in considering this giant push forward I'd like to take a different approach in how the data points from PWP can be viewed.  

This is new so please bear with me for a minute or two as I set the context.

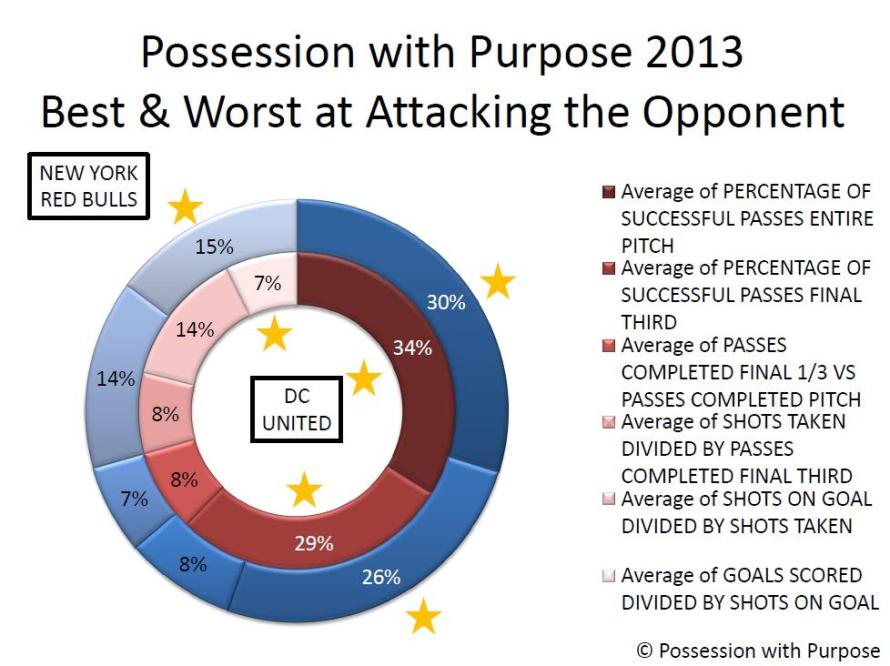
Below are a number of diagrams referencing my PWP indicators for a few teams; the diagram being used this time is the 'doughnut' diagram from Microsoft Powerpoint.

The interesting thing about this diagram is that it allows me to offer up a view on my PWP data points that isn't relative to the exponential relationship (a line). Instead, it allows me to picture the overall tenor of PWP data points in relationship to themselves as being a part of a 'whole'; with the 'whole' being PWP.

I feel confident I can take this approach since my Expected Wins 2 correlation for my data points is ~.97 (R2) --- as near to rock solid as you can get.

Other context points include:  

  • The teams used in this analysis are Seattle, New England, Montreal, Portland and last years' Supporters Shield winner (New York) plus last years bottom dweller (DC United)
  • Reminder in case my explanation was a bit wordy above - the percentages indicated in the doughnut are not the percentages of those activities relative to the game; they are the percentage of those activities relative to each other with 100% being all those activities added together.
  • Source - as usual the MLS Chalkboard and the MLS Statistics Sheets
  • Gold Stars on the diagrams are intended to show you where differences occur.
  • The team name on the outside of the doughnut is the outer ring of data and the team name on the inside of the doughnut is the inner ring of data.

To begin...

PWP Doughnut Diagram Week 11 NER v MIFC

The volume of Final Third passes successfully completed by New England (29%) is 3% points higher than Montreal (26%).  Note also that Montreal has a greater percentage of PWP outside the Final Third (30%) than New England (28%). Both of these indicate to me that New England is more focused on penetrating and creating than Montreal.

For the future I will check into these three areas when looking to see if a 'direct attacking approach' can be better differentiated from a 'ground-based' (short passing scheme) approach.

The actual volume of penetration is higher for New England as well (11%) versus (7%). And like my regular PWP analysis the data here also supports the fact that teams who are more patient in creating shots taken (6% for NER versus 11% for MIFC) end up with more goals scored.

I did ask Matthias Kullowatz about the specific shot data for New England and Montreal; ~60% of Montreal's shots on target have come outside the prime scoring zones 1 & 2 while ~68% of the Revolution shots on target have also come outside of zones 1 & 2.  So what's different?

I think it's down to time and space again; though it could be the Revolution have better strikers - but when you see the DC United doughnut diagram a bit later I think it's back to time and space; and with fewer shots taken and more patience in the final third that seems reasonable to me.

Now for a contrast that might be better at explaining individual mistakes and bad fortune more than a bad 'style/system'...

PWP Doughnut Diagram Week 11 SSFC v PTFC

Notice no 'gold stars'; why? Because there really isn't that much difference between how these two teams execute the six steps of PWP.

What separates these two teams in the league table are individual mental mistakes in defense - Portland sit on ten points while Seattle have 25. Through the course of this year the Timbers have dropped 7 points due to red cards and penalties - they did both against Columbus Saturday night!

In considering the 'sameness' of the data I expect as time passes an output similar to this could highlight 'individual mistakes' and perhaps 'good/bad luck' when it comes to rebounds and deflections - again recall Saturday night when Futty Danso deflected a shot and notched an 'own-goal'

All told things went pretty well for Columbus, a red card by their opponent, a foul in the penalty box by their opponent for a PK and a deflected own-goal by their opponent. If I were a Columbus fan I'd be pretty pissed they didn't win - bad luck for the Crew!

However viewed I'll revisit this diagram later when the Cascadia Cup battle heats up.

So here's the doughnut view of New York compared to DC United last year and then a bit further down how they look compared to each other this year.

PWP Doughnut Diagram NYRB v DCU 2013

First off - let's not forget Ben Olsen was not fired and perhaps this doughnut diagram can also help explain why given the overall poor performance in results last year for DC United.

Notice that the team does exceedingly well in comparison to New York with respect to Passing, penetration and creation; they actually exceed New York in the first two categories and only fall off when it comes to goals scored (7% for DC United versus 15% for New York).

So I'd offer that the system Ben Olsen ran last year worked - what he lacked was a pair of good strikers.  And if you recall the Montreal doughnut earlier the outputs from DC United do not mirror those of the Impact!

They added Espindola and Johnson and shored up their defense a bit; that also included adding Amos Magee to the staff.  Remember him as the Defensive Coordinator for Portland last year (I think - others can confirm or deny that I'm sure)

Bottom line here - the system didn't change and the Head Coach didn't change and I'd offer that was appropriate...  now for the same diagram this year:

PWP Doughnut Diagram Week 11 NYRB v DCU 2014

In closing:

Note the increase for DC United in the final category - goals scored versus shots on goal - pretty compelling information to reinforce that the system used last year is the same system used this year and the difference - major difference - is the addition of two quality strikers.

I'm just in the learning stages on how this new doughnut diagram will take shape - I'm pretty sure it will have at least one hole in it - I'm hopeful there aren't a lot more.

Some changes afoot with OPTA and MLS - I see OPTA incorporated the Final Third Passing Accuracy suggestion - just need to find out if crosses are included in that metric???

As for the new MLS Chalkboard - I'm not sure how that will work if the 'numbers' of activities are not available to count when it comes to defensive activities and 'touches' for players...

And yes, the old Chalkboard still appears to exist given a separate link within previous articles but it's unclear if this change will be a permanent change for next year - or even the World Cup for that matter...

As for This Week in PWP; if you saw my tweets yesterday you know the top Attacking and Defending PWP teams of the week; New England in attack and Toronto in Defense with the Reds taking the Composite PWP Index top spot for Week 11.  

Sporting KC, along with LA Galaxy remain atop the Composite PWP through Week 11 while the Revolution moved to 7th and Columbus dropped to 4th as Real Salt Lake are now in a comfortable position of 3rd best overall.

Finally, this view also gives you and idea of what percentage each team gleans from each of the PWP Six Steps data points in the calculation for the overall Index number.

Best, Chris

Playoffs are a real possibility for the Whitecaps

Vancouver finished outside the playoff picture last year in a conference that allows 55.6 percent of its members to advance into November. Despite passing the "eye test" with a lot of talent, and despite producing a positive goal differential, the Whitecaps did little to convince our more advanced soccer statistics that they were a good team. Vancouver fired off 12.9 shots per game, but allowed 15.1. Furthermore, when those shots are valued based on quality, Expected Goals suggests Vancouver was below average, posting a negative xGD. Supporters may have pointed to their excellent shot accuracy and finishing rates as signs of talent and reason for optimism, but those things don't stabilize quickly, and the man who was most responsible deserted them for Liga MX. To kick off the season, we provided previews of all 19 teams. Jacob covered Vancouver, and he justifiably wrote, "As the 2014 season gets set to begin, Vancouver is one of just a few teams in the league that don’t appear to be as good as last year." Losing internationals Kenny Miller, Y.P. Lee and Camilo would probably make any MLS team worse, and before the acquisition of Matias Laba, Steve Beitashour was probably the most notable addition. On average, you readers picked the Caps to finish 7th in the West, and 76 percent of you guessed that they would miss the playoffs. I'm quite confident that I picked them to finish in 8th place. Missing the playoffs may very well still happen, but that outcome doesn't seem to have a majority of the probability anymore.

I think it's fair to say that Vancouver's 2014 has been surprising for most everybody. After ten games, nearly one-third of a season, Vancouver finds itself in third place. More importantly, it has an above-average shot attempt ratio (1.1) and positive expected goal differentials both overall (+0.13 per game) and in even gamestates (+0.36 per game). In 2013, the first 10 games of the season proved to be reasonably predictive of points earned in the final 24, as shown below.

Predictor Correlation P-value
GD 0.43 0.091
AttRatio* 0.55 0.000
xGD 0.78 0.000
xGD (zero) 0.75 0.000

A team's actual goal differential during the first 10 games had the weakest correlation to its points earned in the last 24 games, as any reader of this blog would have expected. But look at the correlations between xGD in the first 10 games and points earned in the last 24 games. Only more seasons of data will tell us if the correlation is truly that strong, but it's definitely a good indication for Vancouver. The xGD model would expect them to earn another 37 points, totaling 53 points for the season---a figure that, in combination with our playoff chances, suggests the playoffs might be more likely than not likely for the Vancouver Whitecaps.

*The correlation for Attempt Ratio was calculated from all team seasons between 2011 and 2013, while the other correlations could only be calculated from 2013 with the available data.

Expected Wins #2 - After 184 MLS Events (92 Games)

Hopefully most of you read Part I of my series on Expected Wins in Major League Soccer. As a quick reminder the Expected Wins analysis is my internal data quality review on the seven data points I use to support my quantitative Possession with Purpose analysis; the stronger the correlation these data points have the more confidence I have in the overall Indices that are created to assess team performance.

For your benefit, in case you forgot, here are the seven data points I continue to analyze as we reach the 92 game point in MLS; which equals 184 events:

  1. Passes Attempted Entire Pitch
  2. Passes Completed Entire Pitch
  3. Passes Attempted Final Third
  4. Passes Completed Final Third
  5. Shots Taken
  6. Shots on Goal
  7. Goals Scored

All data points, at this time, have equal weight.

What is interesting is that over the week to week course of the season 40% (20/50) of the weekly top five teams, in Attacking PWP, have averaged less than 50% possession in their matches.  

For me that's pretty cool as it indicates this analysis is not really biased towards teams that use a shorter-passing scheme in attack.  Week 5, 3 of 5 teams were under 50% and the other two were both under 51% possession.

Some of those teams are possession based teams like DC United, Portland and Seattle but in that week the margin of possession did not have as much effect as the ability of those teams to finish quality chances - the top three teams that week all scored goals equal to their shots on goal.

The five teams that week who exceeded 80% in Passing Accuracy; usually a good indicator of ground based attacking all finished outside the top 5.


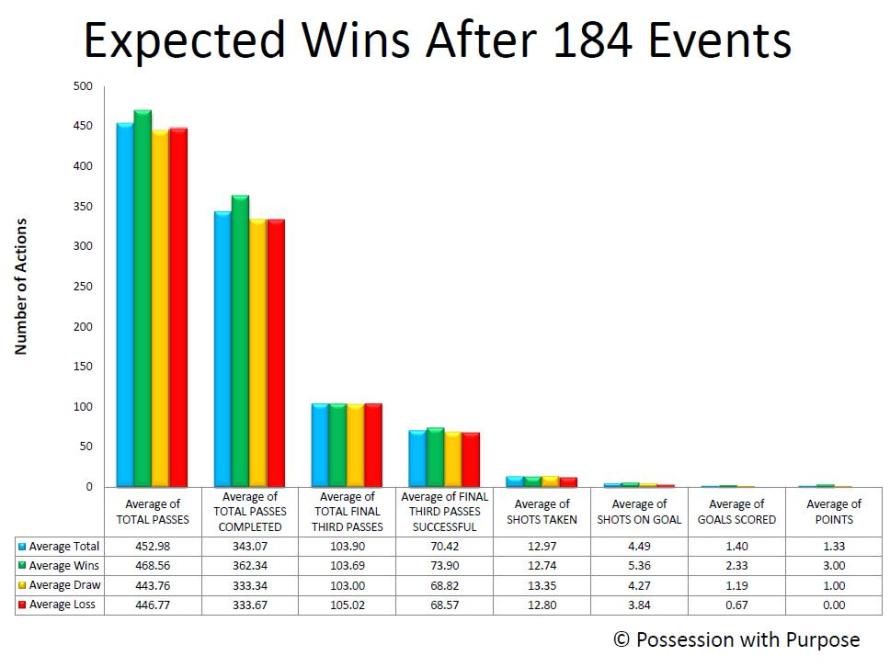
Moving on after that tidbit, here's the averages for overall (blue bar), teams that win (green bar), teams that draw (orange bar) and teams that lose (red bar).

Expected Wins 2 Averages

Facts as they exist today after 184 Events in 2014:

  • The overall tenor of the data points and their relationship really hasn't changed that much since XpW 1.
  • Teams that win average 51.11% Possession; losing teams average 48.89% Possession, (lower)
  • Teams that win average 76.39% in Passing Accuracy; losing teams average 74.10% (lower)
  • Teams that win average 20.48% Penetration in the Final Third based upon Total Passes completed; teams that lose average 20.32% (lower)
  • Teams that win average 18.64% Shots Taken per pass completed in the Final Third, losing teams average 19.22% (higher)
  • Teams that win average 42.67% Shots on Goal per Shot Taken; teams that lose 32.13% (lower) (by over 10%!)
  • Teams that win average 46.18 Goals Scored per Shot on Goal; losing teams 17.03% (lower) (by over 29%!)

Like after XpW 1 (102 Events - 51 games) losing teams shoot the ball more often, on average, but are less accurate when it comes to putting those shots on target and into the net.  Patience in creating quality continues to outweigh quantity...

Overall, the averages for Shots on Goal for winning teams has increased from XpW 1 (4.90) to XpW 2 (5.36); basically the better teams have gotten better and the losing teams have gotten worse (3.84 now) versus (4.10 in XpW 1).

I wonder how that trend will continue through the rest of this year?

Tthe 2% gap in Passing Accuracy between winning teams and losing teams has held from XpW 1 to XpW 2.

The gap in Shots on Goal has increased in losing teams to 10% as opposed to 9% (XpW 1).

The gap in Goals scored has remained near steady at roughly ~30%; though slightly smaller in XpW 2.

Losing teams still continue to take more Shots than winning teams; 12.74 (winning teams) to 12.80 (losing teams) but... that gap has dropped since XpW 1 - perhaps losing teams are looking to be more patient in their shot selection?

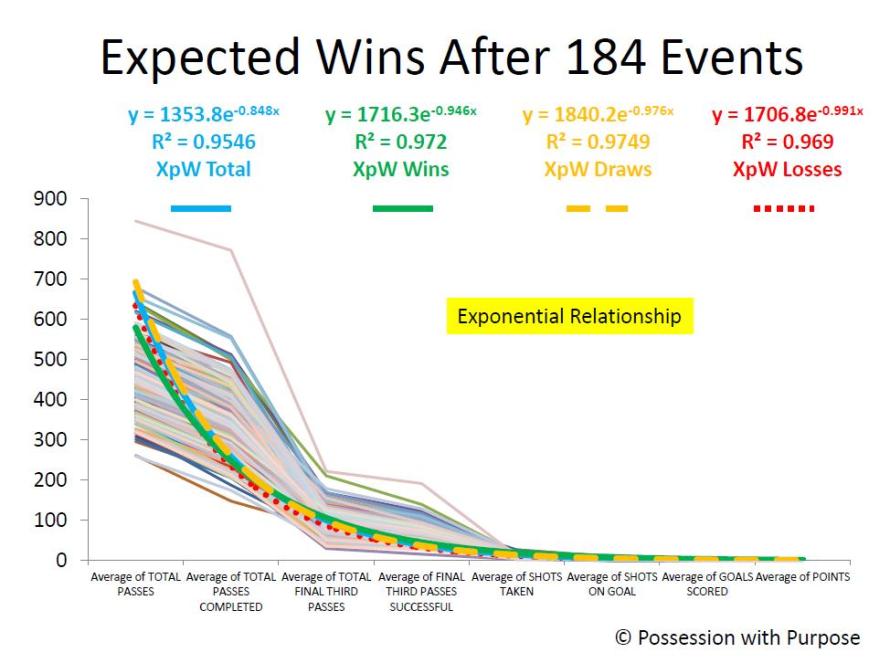
So how does the overall data relate in an Exponential Relationship?

Expected Wins 2 Trend-lines

Observations:

The light shaded lines are the lines of data as in XpW 1 - and the trend-line colors remain the same.

This time the R2 has dropped just a tad.98 to .95 - all things considered most would consider that correlation Rock Solid... I do - and the correlation of these data points, viewed as a whole, have a higher correlation together than Goal Differential (R2 = .88) to Points in the League Table.

Goal differential is usually a great indicator but it also remains a qualitative statistical indicator not a quantitative indicator.

Like last time there remains a difference in the R2 between winning teams, teams that draw, and losing teams; with draws now having greater correlation than wins.  Why?  I'm not sure - but as noted by the closeness of all the data points there still remains a fine line between winning, losing and drawing.

Last time I felt that helped explain the difference between mistakes or unlucky breaks - I continue to sense that is the main difference.  So might this be an indicator of luck - I don't know - what do you think?

I have seen discussions of late, on Telly, and in some articles written elsewhere, that focus more on 'space available' as opposed to just Shots Taken...  hopefully that trend continues!

I also remain hopeful that OPTA and other statistical web sites will offer up more critical events taking place in the Final Third...  One other article written since XpW 1 is my analysis (as promised in Xpw 1) on defensive indicators; here's a link to Hurried Passes and those details.

In closing:

I still don't have enough data, in my opinion, to offer additional thoughts on individual team performance relative to home and away games; that probably won't have statistical reliability until the midpoint of the season (game 323 - events # 646).

There are trends but I'll save that for another article, enough for now.

Best, Chris


MLS Head Coaches: Leveraging PWP Analysis on Performance

I promised this year, at various times, to offer some thoughts about how Possession with Purpose can be used to support analysis on how well Head Coaches might be performing compared to others. As a reminder from last year; five of the bottom six teams in my PWP Composite Index had coaching changes, Columbus, Chicago, San Jose, Toronto, Chivas USA, and then after an early exit from the Playoffs; Montreal.  Other teams making changes included Vancouver, Colorado and FC Dallas and the depature of Kreis for NYCFC. All told, a total of 10 teams made changes in Head Coaches for one reason or another.

Will this year have similar results, and if so, who?  I don't claim to prognosticate coaching changes and the firing of Head Coaches, but changes happen, and last year's information, relative to the bottom six teams in my Composite PWP Index, is pretty compelling at first glance.

So after reading an article offered up by Jason Davis at ESPNFC "Three MLS coaches on the hot seat," plus releasing my article earlier this week on Crosses offered in MLS, I figured the timing was pretty good for my first installment.

Here's some of my initial information for consideration on "system of attack":

  1. For home games Frank Klopas, Mark Watson and Frank Yallop-led teams are the top three in MLS that offer up more crosses per pass attempted in the final third.
  2. For away games Klopas, Watson, Yallop and Wilmer Cabrera-led teams are the top four teams in MLS that offer up more crosses per pass attempted in the final third.
  3. The relationship of taking points, at home, in the MLS is (-.70) for teams that cross the ball more frequently than others. In other words, the teams who cross the ball the most are more likely to lose points (at home) than teams that don't.
  4. The same relationship of taking points in away games holds as well (less at -.37). but still the same logic - the more crosses a team offers in away games the more likely they are to drop points.
  5. Bottom line is these four teams are less likely to win at home or on the road given their current system of attack in the Final Third.

In other words, these teams led by these head coaches use a system of attack that simply doesn't get positive results on a regular basis in MLS; or... these teams, led by these head coaches and general managers don't have the right players to execute that system of attack in MLS.

So how does Sporting KC do it? They are a team that offers up the 7th-most crosses at home and the 5th most crosses on the road, yet they are winning using that system of attack.

Why? I think it's because their GM and head coach, collectively, are getting the right players to play to that system of attack.

So how about overall Team Attacking and Defending performance  (Team Positions in my Composite PWP Index) after nine weeks in: (1) Possession, (2) Passing Accuracy, (3) Penetration into the Final Third, (4) Creating and Taking Shots, (5) Putting Shots on Goal, and (6) Scoring Goals?

After Week nine, four of the five worst performing teams in MLS, in these categories are:

  • Chivas USA (19th out of 19),
  • Montreal Impact (18th out of 19),
  • Chicago Fire (17th out of 19), and
  • San Jose Earthquakes (15th out of 19).

In case you missed it in an earlier article on Expected Wins - the correlation of those data points as a whole is .99 (R-squared); the closer to "1" the better and stronger the relationship.

In other words that means that the relationship of those data points is pretty much rock solid, and that it's a worthy indicator (outside of points in the league table) for objectively evaluating team (attacking and defending) performance.

So while Jason Davis indicates John Hackworth and Caleb Porter as being potential candidates for hot seat discussions, actual evidence available indicates those names don't belong there. Indeed, there are other teams performing, as a whole, much worse than Philadelphia or Portland.

Three teams performing worse at this time include Chivas USA, Houston and Toronto, while Vancouver is behind the power curve compared to Philadelphia and slightly ahead of Portland.  By the way, this is not to say John Hackworth might not belong in a list a bit later this year - but for now I think it is highly speculative to even put in print that he's a potential hot seat candidate.

And with respect to Caleb Porter - it does seem, at times, that writers outside of the Portland area speculate and use the Timbers large supporter base to artificially increase readership in some of their articles... just saying. As a writer covering the Timbers here in Portland, reading the idea that Caleb Porter is on some sort of hot seat is (softly voiced) bollocks. But that's just me...

In closing:

Given the evidence offered, does it seem reasonable that those four Head Coaches and their associated GM's are worthy of a "Hot Seat" distinction? I think so...

Winning styles come in all shapes and sizes - the critical piece is having the right players to support that effort, and the time to install the system. Klopas, Cabrera, Yallop and Watson all know more about football than I do.

And it's not my place, nor is it the place of any soccer writer (in my opinion) to pass judgment on whether or not someone should get fired or hired.

But... objective evidence indicates that those four teams, compared to others, lack an effective attacking system of play, lack strong overall team performance in attacking and defending while also lacking the most important measuring stick - points in the league table.

I'm sure this is not new, nor rocket science, to those head coaches, general managers, or owners... but... (perhaps?) it is helpful to others.

Best, Chris

You can find Chris on twitter @ChrisGluckPWP