The Four Biggest Tactical Trends in the NWSL

The Four Biggest Tactical Trends in the NWSL

Amidst all the chaos that the 2021 NWSL season brought (which we won’t get into in this space) there was some fantastic soccer played. While the goals per 90 were at their lowest in many years, that did not mean the matches were without intrigue: the manufactured parity that is commonplace within the American sports ecosystem has thankfully not led to teams essentially being copycats of one another. Still, like almost any league, there exists a clear and definitive “style” which conditions what we see week in and week out.

Read More

The Price is Right! How Jack Price fits the Rapids, and the Rapids fit Jack Price

The Price is Right! How Jack Price fits the Rapids, and the Rapids fit Jack Price

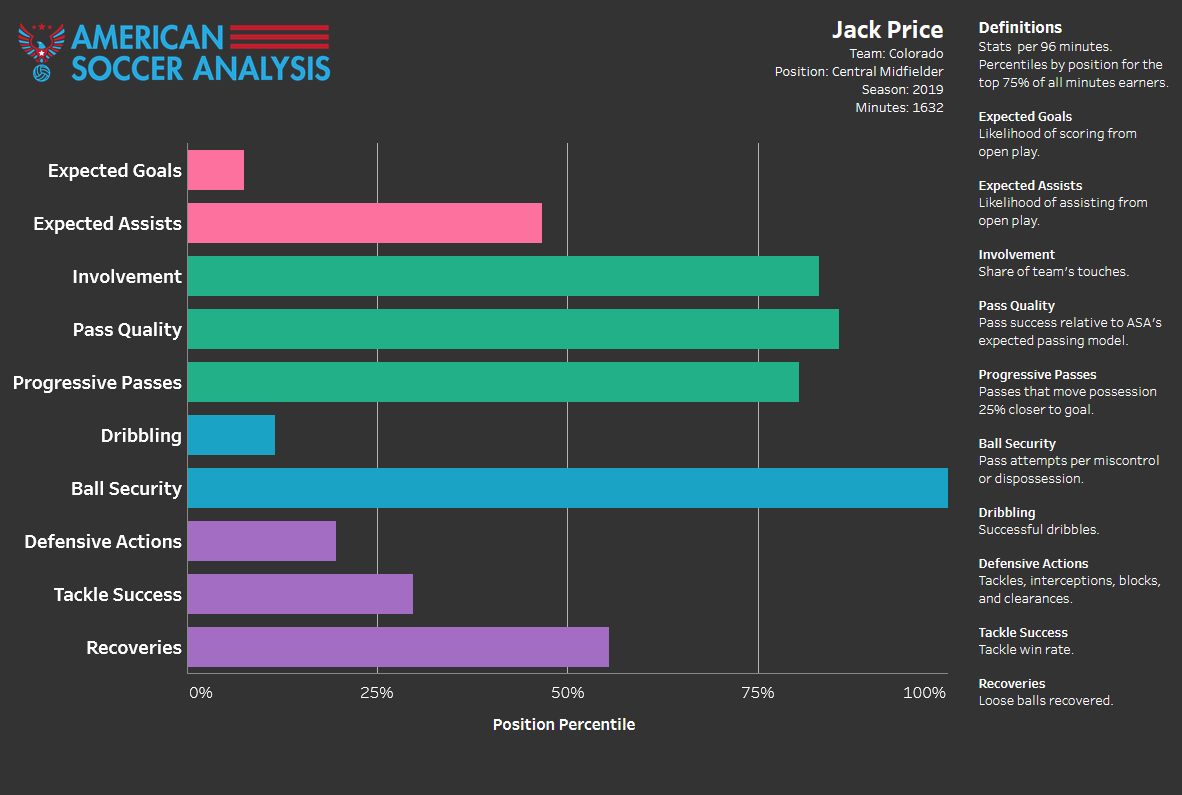
Amidst another difficult season for the Colorado Rapids, a few changes have provided hope for the club and its supporters. Sacking Anthony Hudson was long overdue after a season and a half of shaky leadership, poor results, and a feeling that the team was falling behind newer and better run MLS franchises. The change in manager, plus the addition of various proven MLS vets like Nicolas Mezquida, Clint Irwin, Sam Nicholson, and Keegan Rosenberry; undervalued young talents such as Lalas Abubakar and Jonathan Lewis; and the development of homegrown talents Cole Bassett, Sam Vines, and Sebastian Anderson has reinvigorated the squad and given fans hope for an improved season in 2020. However, this has left many of the players acquired under Hudson in limbo. Will they form a part of the Rapids core moving forward, or will they be victims of another Rocky Mountain rebuild? One player who has proven his value to the team—albeit in an unusual way—is also one of the least talked about around the league. That player is Jack Price.

*Hold for applause*

Read More

Lost in Transition

Lost in Transition

Chris Armas is fighting a losing battle; in 2018, Jesse Marsch’s Red Bulls were one of the best teams in MLS. Their expected goal differential (xGD) was the fourth best since 2016, only behind Toronto (2016), Atlanta United (2018), and Los Angeles FC (2019). They were so good that many are sure that had Marsch stayed, they would have won the MLS Cup last year. Anything less than that was seen as a failure, which made a peaceful transition to a new era almost impossible in the critics’ eyes.

Read More

This weekend's most watchable MLS games

This weekend's most watchable MLS games

If you haven’t read The Watchability ranking overview... please go do that now and then come back here and read this. Okay? Don’t worry, I’ll wait for you.

(taps foot)

(ugh-huh)

Okay you done? Don’t lie to me, did you read it? Okay, good.

Now, this might seem obvious but the scores of each team are combined and then divided by two, giving us the total game score. The higher the score the higher probability the match will be enjoyable to watch. Likewise the lower the score the high probability it’ll be... well, probably less fun to watch.

Read More

MLS Semifinals Tactical Preview

There are a multitude of tactical questions facing each remaining team in the MLS Cup Playoffs. Can New York's retooled wing-backs be relied on to defend capably? Can the Crew maintain a consistent attack with Federico Higuain's inconsistent performances? Can anything be done to stop Dallas' attack through Mauro Diaz and Fabian Castillo? And how will suspensions affect Portland's midfield? I'll examine each of these questions and provide a tactical preview of of the Conference Finals below.

Read More

When Should A Team Park the Bus?

"Tottenham might as well have put the team bus in front of their goal," said Jose Mourinho in 2004 following a draw between his Chelsea club and the Spurs. Although he would later say the phrase was one typically used in Portugal, Mourinho was credited with coining the phrase 'parking the bus,' which described a team that was sitting the whole team behind the ball in an effort to block the goal.  It's less frequent for team to play a full 90 minutes that way, but often teams with a lead will change tactics late in the game and park the bus in an effort to ensure victory. To do this they move their line of defensive pressure back toward the goal, committing more players to defense. The other team is allowed more possession of the ball but the bet is they'll have a lower chance of actually scoring the equalizer. 

Read More

MLS Head Coaches: Leveraging PWP Analysis on Performance

I promised this year, at various times, to offer some thoughts about how Possession with Purpose can be used to support analysis on how well Head Coaches might be performing compared to others. As a reminder from last year; five of the bottom six teams in my PWP Composite Index had coaching changes, Columbus, Chicago, San Jose, Toronto, Chivas USA, and then after an early exit from the Playoffs; Montreal.  Other teams making changes included Vancouver, Colorado and FC Dallas and the depature of Kreis for NYCFC. All told, a total of 10 teams made changes in Head Coaches for one reason or another.

Will this year have similar results, and if so, who?  I don't claim to prognosticate coaching changes and the firing of Head Coaches, but changes happen, and last year's information, relative to the bottom six teams in my Composite PWP Index, is pretty compelling at first glance.

So after reading an article offered up by Jason Davis at ESPNFC "Three MLS coaches on the hot seat," plus releasing my article earlier this week on Crosses offered in MLS, I figured the timing was pretty good for my first installment.

Here's some of my initial information for consideration on "system of attack":

  1. For home games Frank Klopas, Mark Watson and Frank Yallop-led teams are the top three in MLS that offer up more crosses per pass attempted in the final third.
  2. For away games Klopas, Watson, Yallop and Wilmer Cabrera-led teams are the top four teams in MLS that offer up more crosses per pass attempted in the final third.
  3. The relationship of taking points, at home, in the MLS is (-.70) for teams that cross the ball more frequently than others. In other words, the teams who cross the ball the most are more likely to lose points (at home) than teams that don't.
  4. The same relationship of taking points in away games holds as well (less at -.37). but still the same logic - the more crosses a team offers in away games the more likely they are to drop points.
  5. Bottom line is these four teams are less likely to win at home or on the road given their current system of attack in the Final Third.

In other words, these teams led by these head coaches use a system of attack that simply doesn't get positive results on a regular basis in MLS; or... these teams, led by these head coaches and general managers don't have the right players to execute that system of attack in MLS.

So how does Sporting KC do it? They are a team that offers up the 7th-most crosses at home and the 5th most crosses on the road, yet they are winning using that system of attack.

Why? I think it's because their GM and head coach, collectively, are getting the right players to play to that system of attack.

So how about overall Team Attacking and Defending performance  (Team Positions in my Composite PWP Index) after nine weeks in: (1) Possession, (2) Passing Accuracy, (3) Penetration into the Final Third, (4) Creating and Taking Shots, (5) Putting Shots on Goal, and (6) Scoring Goals?

After Week nine, four of the five worst performing teams in MLS, in these categories are:

  • Chivas USA (19th out of 19),
  • Montreal Impact (18th out of 19),
  • Chicago Fire (17th out of 19), and
  • San Jose Earthquakes (15th out of 19).

In case you missed it in an earlier article on Expected Wins - the correlation of those data points as a whole is .99 (R-squared); the closer to "1" the better and stronger the relationship.

In other words that means that the relationship of those data points is pretty much rock solid, and that it's a worthy indicator (outside of points in the league table) for objectively evaluating team (attacking and defending) performance.

So while Jason Davis indicates John Hackworth and Caleb Porter as being potential candidates for hot seat discussions, actual evidence available indicates those names don't belong there. Indeed, there are other teams performing, as a whole, much worse than Philadelphia or Portland.

Three teams performing worse at this time include Chivas USA, Houston and Toronto, while Vancouver is behind the power curve compared to Philadelphia and slightly ahead of Portland.  By the way, this is not to say John Hackworth might not belong in a list a bit later this year - but for now I think it is highly speculative to even put in print that he's a potential hot seat candidate.

And with respect to Caleb Porter - it does seem, at times, that writers outside of the Portland area speculate and use the Timbers large supporter base to artificially increase readership in some of their articles... just saying. As a writer covering the Timbers here in Portland, reading the idea that Caleb Porter is on some sort of hot seat is (softly voiced) bollocks. But that's just me...

In closing:

Given the evidence offered, does it seem reasonable that those four Head Coaches and their associated GM's are worthy of a "Hot Seat" distinction? I think so...

Winning styles come in all shapes and sizes - the critical piece is having the right players to support that effort, and the time to install the system. Klopas, Cabrera, Yallop and Watson all know more about football than I do.

And it's not my place, nor is it the place of any soccer writer (in my opinion) to pass judgment on whether or not someone should get fired or hired.

But... objective evidence indicates that those four teams, compared to others, lack an effective attacking system of play, lack strong overall team performance in attacking and defending while also lacking the most important measuring stick - points in the league table.

I'm sure this is not new, nor rocket science, to those head coaches, general managers, or owners... but... (perhaps?) it is helpful to others.

Best, Chris

You can find Chris on twitter @ChrisGluckPWP

In Defense of the San Jose Earthquakes and American Soccer

Note: This is part II of the post using a finishing rate model and the binomial distribution to analyze game outcomes. Here is part I. As if American soccer fans weren’t beaten down enough with the removal of 3 MLS clubs from the CONCACAF Champions League, Toluca coach Jose Cardozo questioned the growth of American soccer and criticized the strategy the San Jose Earthquake employed during Toluca’s penalty-kick win last Wednesday. Mark Watson’s team clearly packed it in defensively and looked to play “1,000 long balls” on the counterattack. It certainly doesn’t make for beautiful fluid soccer but was it a smart strategy? Are the Earthquakes really worthy of the criticism?

Perhaps it’s fitting that Toluca is almost 10,000 feet above sea level because at that level the strategy did look like a disaster. Toluca controlled the ball for 71.8% of the match and ripped off 36 shots to the Earthquakes' 10. It does appear that San Jose was indeed lucky to be sitting 1-1 at the end of match. The fact that Toluca only scored one lone goal in those 36 shots must have been either unlucky or great defense, right? Or could it possibly have been expected?

The prior post examined using the binomial distribution to predict goals scored, and again one of the takeaways was that the finishing rates and expected goals scored in a match decline as shots increase, as seen below. This is a function of "defensive density," I’ll call it, or basically how many players a team is committing to defense. When more players are committed to defending, the offense has the ball more and ultimately takes more shots. But due to the defensive intensity, the offense is less likely to score on each shot.

 source: AmericanSoccerAnalysis

Mapping that curve to an expected goals chart you can see that the Earthquakes expected goals are not that different from Toluca’s despite the extreme shot differential.

source data: AmericanSoccerAnalysis

Given this shot distribution, let’s apply the binomial distribution model to determine what the probability was of San Jose advancing to the semifinals of the Champions League. I’m going to use the actual shots and the expected finishing rate to model the outcomes. The actual shots taken can be controlled through Mark Watson’s strategy, but it's best to use expected finishing rates to simulate what outcomes the Earthquakes were striving for. Going into the match the Earthquake needed a 1-1 draw to force a shootout. Any better result would have seen them advancing and anything worse would have seen them eliminated.

Inputs:

Toluca Shots: 36

Toluca Expected Finishing Rate: 3.6%

San Jose Shots: 10

San Jose Expected Finishing Rate: 11.2%

Outcomes:

Toluca Win: 39.6%

Toluca 0-0 Draw: 8.3%

Toluca 1-1 Draw: 13.9% x 50% PK Toluca = 6.9%

Total Probability Toluca advances= 54.9%


San Jose Win: 32.3%

2-2 or higher Draw = 5.8%

San Jose 1-1 Draw: 13.9% x 50% PK San Jose = 6.9%

Total Probability San Jose Advances = 45.1%


The odds of San Jose advancing with that strategy are clearly not as bad as the 10,000-foot level might indicate. Counterattacking soccer certainly isn’t pretty, but it wouldn’t still exist if it weren’t considered a solid strategy.

It’s difficult, but we can also try to simulate what a “normal” possession-based strategy might have looked like in Toluca. In MLS the average possession for the home team this year is 52.5% netting 15.1 shots per game. In Liga MX play, Toluca is only averaging about 11.4 shots per game so they are not a prolific shooting team. They are finishing at an excellent 15.2%, which could be the reason San Jose attempted to pack it in defensively. The away team in MLS is averaging 10.4 shots per game. If we assume that a more possession oriented strategy would have resulted in a typical MLS game then we have the following expected goals outcomes.

source data: AmericanSoccerAnalysis

Notice the expected goal differential is actually worse for San Jose by .05 goals. Though it may not be statistically significant, at the very least we can say that San Jose's strategy was not ridiculous.

Re-running the expected outcomes with the above scenario reveals that San Jose advances 43.3% of the time. A 1.8% increase in the probability of advancing did not deserve any criticism, and definitely not such harsh criticism. It shows that the Earthquakes probably weren’t wrong in their approach to the match. And if we had factored in a higher finishing rate for Toluca, the probabilities would favor the counterattack strategy even more.

Even though the US struck out again in the CONCACAF Champions League, American's don't need to take abuse for their style of play. After all, soccer is about winning, and in the case of a tie, advancing. We shouldn't be ashamed or be criticized when we do whatever it takes to move on.


Predicting Goals Scored using the Binomial Distribution

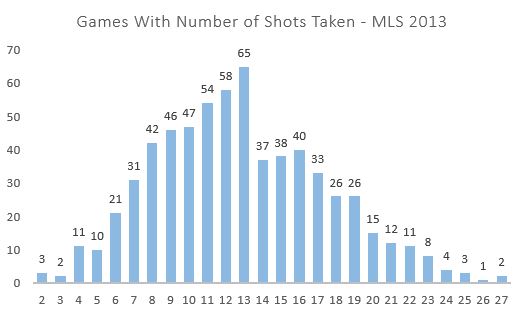
Much is made of the use of the Poisson distribution to predict game outcomes in soccer. Much less attention is paid to the use of the binomial distribution. The reason is a matter of convenience. To predict goals using a Poisson distribution, “all” that is needed is the expected goals scored (lambda). To use the binomial distribution, you would need to both know the number of shots taken (n) and the rate at which those shots are turned into goals (p). But if you have sufficient data, it may be a better way to analyze certain tactical decisions in a match. First, let’s examine if the binomial distribution is actually dependable as a model framework. Here is the chart that shows how frequently a certain number of shots were taken in a MLS match.

source data: AmericanSoccerAnalysis

The chart resembles a binomial distribution with right skew with the exception of the big bite taken out of the chart starting with 14 shots. How many shots are taken in a game is a function of many things, not the least of which are tactical decisions made by the club. For example it would be difficult to take 27 shots unless the opposing team were sitting back and defending and not looking to possess the ball. Deliberate counterattacking strategies may very well result in few shots taken but the strategy is supposed to provide chances in a more open field.

Out of curiosity let’s look at the average shot location by shots taken to see if there are any clues about the influence of tactics. To estimate this I looked expected goals by each shot total. This does not have any direct influence on the binomial analysis but could come in useful when we look for applications.

source: AmericanSoccerAnalysis

The average MLS finishing rate was just over 10 percent in 2013. You can see that, at more than 10 shots per game, the expected finishing rate stays constant right at that 10-percent rate. This indicates that above 10 shots, the location distribution of those shots is typical of MLS games. However, at fewer than 10 shots you can see that the expected goal scoring rate dips consistently below 10%. This indicates that teams that take fewer shots in a game also take those shots from worse locations on average.

The next element in the binomial distribution is the actual finishing rate by number of shots taken.

 source: AmericanSoccerAnalysis

Here it’s plain that the number of shots taken has a dramatic impact on the accuracy rate of each shot. This speaks to the tactics and pace of play involved in taking different shot amounts. A team able to squeeze off more than 20 shots is likely facing a packed box and a defense less interested in ball possession. What’s fascinating then is that teams that take few shots in a game have a significantly higher rate of success despite the fact that they are taking shots from farther out. This indicates that those teams are taking shots with significantly less pressure. This could indicate shots taken during a counterattack where the field of play is more wide open.

Combining the finishing accuracy model curve with number of shots we can project expected goals per game based on number of shots taken.

ExpGoalsbyShotsTaken

What’s interesting here is that the expected number of goals scored plateaus at about 18 shots and begins to decline after 23 shots. This, of course, must be a function of the intensity of the defense they are facing for those shots because we know their shot location is not significantly different. This model is the basis by which I will simulate tactical decisions throughout a game in Part II of this post.

Now we have the two key pieces to see if the binomial distribution is a good predictor of goals scored using total shots taken and finishing rate by number of shots taken. As a refresher, since most of us haven’t taken a stat class in a while, the probability mass function of the binomial distribution looks like the following:

source: wikipedia

Where:

n is the number of shots

p is the probability of success in each shot

k is the number of successful shots

Below I compare the actual distribution to the binomial distribution using 13 shots (since 13 is the mode number of shots from 2013’s data set), assuming a 10.05% finishing rate.

source data: AmericanSoccerAnalysis, Finishing Rate model

The binomial distribution under predicts scoring 2 goals and over predicts all other options. Overall the expected goals are close (1.369 actual to 1.362 binomial). The Poisson is similar to the binomial but the average error of the binomial is 12% better than the Poisson.

If we take the average of these distributions between 8 and 13 shots (where the sample size is greater than 40) the bumps smooth out.

source data: AmericanSoccerAnalysis, Finishing Rate model

The binomial distribution seems to do well to project the actual number of goals scored in a game, and the average binomial error is 23% lower than with the Poisson. When individually looking at shots taken 7 to 16 the binomial has 19% lower error if we just observe goal outcomes 0 and 1. But so what? Isn’t it near impossible to predict the number of shots a team will take in the game? It is. But there may be tactical decisions like counterattacking where we can look at shots taken and determine if the strategy was correct or not. And a model where the final stage of estimation is governed by the binomial distribution appears to be a compelling model for that analysis. In part II I will explore some possible applications of the model.

Jared Young writes for Brotherly Game, SB Nation's Philadelphia Union blog. This is his first post for American Soccer Analysis, and we're excited to have him!

Possession Confusion

Consider every conversation ever had about soccer tactics. I would bet 99.9% of them touched on one specific subject: possession. Whether it’s the men’s league team you play for, or the club team you cheer for, isn’t more possession always a good thing? I can’t answer that question confidently, but I will explore it. The first obstacle to analyzing and discussing possession in MLS is the data itself. We get our data from Opta, and this is what Opta defines as possession:

During the game, the passes for each team are totaled up, and then each team's total is divided by the game total to produce a percentage figure which shows the percentage of the game that each team has accrued in possession of the ball.

“Possession” in Opta’s data is thus a measure of the proportion of completed passes in a match for each team, not a proportion of time. A lot of short, quick passes will accrue possession for a team that may only have the ball for a matter of seconds. This isn’t necessarily bad or good. It is what it is, and we’ll work with it.

Not all passes are created equally---or better put, not all teams' passes average out to be equally effective---but for a moment let’s suppose that they are. It’s hard to gather data on the value of each pass, and hard to then weight teams’ passes accordingly. So let’s just stick with the assumption that all teams' passes are equally effective. Perhaps someday we can sit around drinking beer and punching holes in that assumption. Today is not that day.

Under that assumption of equal passes, a team that completes a higher proportion of passes than its opponent will likely have strung together effective buildup more often than its opponent. Having created more effective build up, that team will likely have earned more scoring opportunities than its opponent. Having earned more scoring opportunities than its opponent, that team will be more likely to score goals and nab points. So this sort of possession should really imply sunshine and rainbows for the participating team. Seems like fair logic to me, but of course, I’m the one writing.

Looking at the tables—tables that were created with Opta’s version of possession, remember—we don’t see a strong correlation between possession and results. Four of the top five teams (by points per match) have 50% possession or less, but overall there is still a weakly positive correlation. We start to get significant results when we assess the correlations between teams’ possession and Attempt Ratios (0.60*), and again with Shots on Goal Ratios (0.55*). Those positive correlations imply that more possession coincides with more scoring chances. Of course, there is not nececelery a causal link.

Let’s take a look at this from another perspective. If we look at the relationships game-by-game—rather than team-by-team—the correlation between possession and scoring chances is still positive. The team that possesses the ball for a majority of passes (Opta’s definition) during any given match also tends to earn more scoring attempts than its opponent.

So far I’ve bored you with support for conventional wisdom: possession coincides with more scoring opportunities, and thus probably with better results.

But then I control for a few variables and shit goes haywire.

When I control for each individual team and whether or not they were playing at home, the relationship between possession and results is decidedly negative. In fact, a team that possesses the ball an additional 10% in any given match is expected to lose half of a goal on average, equivalent to about half of a point. For example’s sake, consider the Seattle Flounders Sounders. Over Seattle’s top four matches in terms of possession, it has earned just one point. However, during Seattle’s bottom four matches in terms of possession, it has earned eight points. Seattle is an extreme case, but a good example of what my model is picking up. Most teams individually seem to do worse when their possession is higher.

So more possession seems to correlate with more shots, and more shots seems to correlate with more goals, but for some reason more possession does not share a significant relationship with more goals. There is some missing information screwing with me, and I don’t have a definitive explanation for this strange paradox, but I will share a theory.

Each team has a style. Whether or not that style works is probably mostly a product of how well the players fit in, and how good those players are in the first place. Perhaps, in general, a style that focuses more on stringing short passes together tends to produce more shots than a high-risk/high-reward style, but this type of possession is not a necessary condition for success. Once each team develops its style, a certain amount of possession is required to optimize that style. For Montreal, it may be 49% possession, and for Portland, it might be 57%. This would explain the mild positive correlations between possession and shots across teams.

But why is it that, across games, more possession seems to correspond to less goals and worse results?

In a given game, if a team generates more possession—more passing by Opta’s definition—then perhaps that is indicative more of the opponent’s defense than of the desire of the team in question to possess. In other words, an excellent defense may not necessarily kill possession, but rather, push possession to less dangerous parts of the pitch. In this way, more possession is simply indicative of a frustrated team, not a team in control doing what it wants to do.

Without being able to conclude this thought exercise satisfyingly, I will propose a few things. First, that by charting each shot’s point of origin, we can begin to assess the quality of a team’s shots. And second, that possession data should be gathered from the distinct areas on the pitch. Possession in the attacking third is likely more valuable than possession in the defensive third. Some combination of these two measurements could very well help to explain the paradox we’re seeing with passing possession and team success.

*A perfect positive correlation would be 1.0.