There's Something "a miss" in Wondo's Legacy

Christopher Wondolowski should be an American sports icon. He should be beloved and admired. If he is hated by anyone, it should be by MLS fans in the same way Indianapolis Colts fans “hate” Tom Brady. He is the underdog of underdogs – the working class man who beats the talented elite at their own game. At 36, he keeps breaking scoring records in MLS, including setting the all-time big one a few weeks ago with a four-goal match. He is on the precipice of being the first player to score 10+ goals in 10 straight MLS seasons. His time and opportunity with the US Men’s National Team should have been longer than it was – but for many fans, there would be no cry for Wondolowski’s return to the national team. No matter how many goals he scored or how often his league form was more impressive than the strikers getting the call, his national team legacy was cemented. Outside of a few San Jose Earthquakes fans and pundits, there are no calls for “Wondo” to be on the team by the American soccer public because of one infamous situation that occurred on July 1, 2014.

Read More

Finishing in MLS Part 2: Is Finishing Real? Heading Towards a Conclusion

The topic of “finishing” is always a fun one in the analytics world, and, last April, it’s one I studied using data going all the way back to the beginning of the league to see if I could find evidence for a statistically significant gradient of repeatable finishing skill in MLS. Click the link to read the piece in full, but the short of it was, while there were many instances where a forward outperformed their xG by a wide margin or converted an unusual number of their shots on goal, these seasons were rarely repeated within a player’s career as you would expect if such numbers were tied to a skill.

After such a long and arduous study, you can imagine my consternation any time I read a piece praising or criticizing a player’s finishing skill within the league. In fact, when Jordan Morris told the New York Times, “my finishing is still raw,” I nearly had an aneurysm. Doesn't anyone read long winded statistical articles anymore? (Answer: no) But read more after the jump.

Read More

Does Finishing Skill matter in MLS?

If you’ve ever played FIFA, you’ve probably noted the importance of a forward’s “finishing” rating to how often they finish their chances. That’s how it works in the video game, but is “finishing” a real life skill significant enough to make an impact in a forward’s goal scoring tally?

While I have yet to meet a data analyst who thinks that “finishing skill” is as relevant to goal scoring as most soccer fans tend to believe, there doesn’t seem to be a consensus in terms of whether “finishing” is a repeatable skill. In other words, can forwards depend on a superior ability to convert chances year to year?

With forwards like Gyasi Zardes (16 goals in 2014) and Cyle Larin (17 goals in 2015) bursting onto the scene by converting a high percentage of their chances on goal, the question within MLS is as important as ever. Are these players scoring so many goals because of some underlying finishing skill, or are their unusually finishing rates something closer to statistical noise?

Is finishing a skill of any importance within MLS?

One important tool we can use for answering such a question is to study discrepancies in expected goals (xG) data. Since the expected goals model is built around league averages of conversion, if finishing were a skill of any statistical note we would see a consistent out-performance of the model by certain shooters who are highly skilled finishers. But before we get into repeatability for individuals, I’d like to use goals minus expected goals (G-xG) data to look at the question in much broader strokes.

More after the jump.

Read More

USMNT IN Switzerland: Beyond the Score

By Jared Young (@jaredeyoung)

The USMNT took on Switzerland Tuesday, their 9th friendly since the World Cup, and in the process relinquished their 6th second half lead. The 1-1 draw wouldn't have been as much of a disappointment if the result didn't tell the same story about a team unable to hold a lead against top competition. The USMNT is now eleven goals against and just one goal scored in the second half of these friendlies. And that’s all I’m going to say about that. Here are three other stats to take away from the latest International weekend.

9: Is Klinsmann too conservative? Jurgen Klinsmann’s team didn't escape Europe with double digit shot attempts, as they finished with just nine. Is the team too conservative when it comes to shot selection? Three goals in nine attempts is an excellent conversion and there were a few shots that could have easily been converted, Michael Bradley’s sitter against Switzerland being the most notable. But are there too few shots taken? Consider that eight of the nine attempts were taken inside the box and even more crazy, inside the area of the spot. There was only one shot attempted from outside the 18-yard box, and that was Brek Shea’s laser goal off of a free kick. In other words, the team didn't attempt a shot outside the box in the run of play. Pause on that one for a moment.

This weekend the USMNT attempted 18.7 passes in the final third for every shot while their opponents attempted 10.8 passes in the final third per shot. Considering the US was playing a more direct style on offense that does imply they may be too picky once they get the ball in position. The results this weekend weren't terrible, especially offensively, but it does beg the question: does the US have the right shot selection balance offensively? More in part III of this post.

19.8: High energy, low team pressure. Colin Trainor has been publishing work on a metric that attempts to measure how much a team employs the high press. The metric takes opponent passes attempted in their defensive half plus about 20% of the offensive half of the field (so about 60% of the field that is the farthest away from their goal) and a team’s defensive actions in that same area. The lower the passes per defensive action, the more intense the high press. A measure of mid-single digits would indicate a consistent high pressure strategy. Here is the PPDA metric chart by team and area of the field.

You can see from the chart that Switzerland was much more aggressively defending up the pitch than the US. When the action was in the defensive end, both teams employed similar pressure. This resulted in the possession being strongly in favor of Switzerland at over 60%. The US did have high individual energy in their opponent’s offensive half but mainly that running around was just to disrupt the Switzerland offense as much as possible. The team as a whole was willing to wait to employ significant pressure. We didn't see a particularly aggressive US team this window and it makes you wonder if Klinsmann isn't perhaps going for results instead of pushing his team to be proactive like he was doing during the last World Cup cycle in these friendlies.

2: Blocked shots against UEFA teams. I now the late game defense is the big issue, but I’m not done harping on the shot selection. In this nine game stretch the USMNT has taken to the road against four European foes and have managed a 1-1-2 (W-D-L), but could easily have been 3-0-1. They did this attempting just 29 shots in the four games, an average of 7.3. The crazy stat is that only two of those shots were blocked, or just 6.9% of the total shots. A typical blocked shot percentage is roughly 25%. You can’t argue with the 17% finishing rate in those four games, but it does make you wonder the team is too picky on offense. 

Let’s do a little thought experiment to see if this trend is something that should change. Back to the latest window and games against Denmark and Switzerland. What if the US took shots as frequently as their opponents but also finished their shots at their opponents’ lower rate. The numbers would look like this:

The US would have only scored 2.6 goals had they been as selective as their opponents, and so while the sample sizes are clearly small, at least it looks from here that Klinsmann isn't too crazy.

Next up for the US is the rowdy rivalry with El Tri in what will hopefully be a Gold Cup Final preview (said by the guy living in Philly, home of the Gold Cup Final).

Predicting Goals Scored using the Binomial Distribution

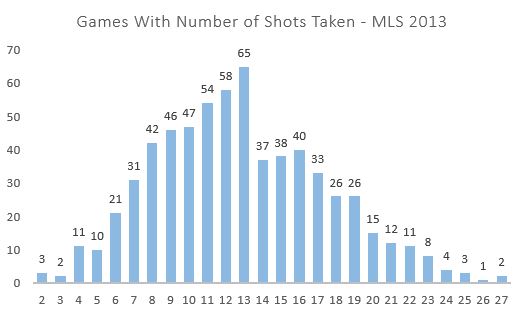
Much is made of the use of the Poisson distribution to predict game outcomes in soccer. Much less attention is paid to the use of the binomial distribution. The reason is a matter of convenience. To predict goals using a Poisson distribution, “all” that is needed is the expected goals scored (lambda). To use the binomial distribution, you would need to both know the number of shots taken (n) and the rate at which those shots are turned into goals (p). But if you have sufficient data, it may be a better way to analyze certain tactical decisions in a match. First, let’s examine if the binomial distribution is actually dependable as a model framework. Here is the chart that shows how frequently a certain number of shots were taken in a MLS match.
source data: AmericanSoccerAnalysis

The chart resembles a binomial distribution with right skew with the exception of the big bite taken out of the chart starting with 14 shots. How many shots are taken in a game is a function of many things, not the least of which are tactical decisions made by the club. For example it would be difficult to take 27 shots unless the opposing team were sitting back and defending and not looking to possess the ball. Deliberate counterattacking strategies may very well result in few shots taken but the strategy is supposed to provide chances in a more open field.

Out of curiosity let’s look at the average shot location by shots taken to see if there are any clues about the influence of tactics. To estimate this I looked expected goals by each shot total. This does not have any direct influence on the binomial analysis but could come in useful when we look for applications.

source: AmericanSoccerAnalysis

The average MLS finishing rate was just over 10 percent in 2013. You can see that, at more than 10 shots per game, the expected finishing rate stays constant right at that 10-percent rate. This indicates that above 10 shots, the location distribution of those shots is typical of MLS games. However, at fewer than 10 shots you can see that the expected goal scoring rate dips consistently below 10%. This indicates that teams that take fewer shots in a game also take those shots from worse locations on average.

The next element in the binomial distribution is the actual finishing rate by number of shots taken.

 source: AmericanSoccerAnalysis

Here it’s plain that the number of shots taken has a dramatic impact on the accuracy rate of each shot. This speaks to the tactics and pace of play involved in taking different shot amounts. A team able to squeeze off more than 20 shots is likely facing a packed box and a defense less interested in ball possession. What’s fascinating then is that teams that take few shots in a game have a significantly higher rate of success despite the fact that they are taking shots from farther out. This indicates that those teams are taking shots with significantly less pressure. This could indicate shots taken during a counterattack where the field of play is more wide open.

Combining the finishing accuracy model curve with number of shots we can project expected goals per game based on number of shots taken.

ExpGoalsbyShotsTaken

What’s interesting here is that the expected number of goals scored plateaus at about 18 shots and begins to decline after 23 shots. This, of course, must be a function of the intensity of the defense they are facing for those shots because we know their shot location is not significantly different. This model is the basis by which I will simulate tactical decisions throughout a game in Part II of this post.

Now we have the two key pieces to see if the binomial distribution is a good predictor of goals scored using total shots taken and finishing rate by number of shots taken. As a refresher, since most of us haven’t taken a stat class in a while, the probability mass function of the binomial distribution looks like the following:

source: wikipedia

Where:

n is the number of shots

p is the probability of success in each shot

k is the number of successful shots

Below I compare the actual distribution to the binomial distribution using 13 shots (since 13 is the mode number of shots from 2013’s data set), assuming a 10.05% finishing rate.

source data: AmericanSoccerAnalysis, Finishing Rate model

The binomial distribution under predicts scoring 2 goals and over predicts all other options. Overall the expected goals are close (1.369 actual to 1.362 binomial). The Poisson is similar to the binomial but the average error of the binomial is 12% better than the Poisson.

If we take the average of these distributions between 8 and 13 shots (where the sample size is greater than 40) the bumps smooth out.

source data: AmericanSoccerAnalysis, Finishing Rate model

The binomial distribution seems to do well to project the actual number of goals scored in a game, and the average binomial error is 23% lower than with the Poisson. When individually looking at shots taken 7 to 16 the binomial has 19% lower error if we just observe goal outcomes 0 and 1. But so what? Isn’t it near impossible to predict the number of shots a team will take in the game? It is. But there may be tactical decisions like counterattacking where we can look at shots taken and determine if the strategy was correct or not. And a model where the final stage of estimation is governed by the binomial distribution appears to be a compelling model for that analysis. In part II I will explore some possible applications of the model.

Jared Young writes for Brotherly Game, SB Nation's Philadelphia Union blog. This is his first post for American Soccer Analysis, and we're excited to have him!

Game Of The Week Review: Montreal Impact Visit Sporting Kansas City

I know I shouldn't be surprised by the Impact stealing a match on the road, especially considering Sporting's lack of strength at home as of their recent string of outcomes. Though, with all the statistical pointers, it's quiet uncanny that they came up with even a point, let alone all three. SKC-IMP

It's hard to look at the tackles, interceptions and clearances and not think that it's a by product of the Impact largely being on their heels for the majority of the match. That in large part is due to the style which the Montreal Impact implements. The team as a whole has functioned with 48% possession through 12 matches and even less possession (44%) in away games. It's not a bad thing, but it naturally produces more defensive events.

Much of our discussion during the podcasts has dealt with shots and their predictive nature. Montreal has been at the forefront of the discussion, with amazing results despite being outshot on both total attempts at goal (12 to 15 per game) and actual shots on target (4.9 to 5.2) Montreal Impact is currently now sporting 26 points with a goal differential of +7. Not to mention they are boasting the highest conversion rate in the league of 15.3%. Better than the next highest (FC Dallas, 13.9%) by nearly a whole point and a half.

Matthias, Drew and I have discussed whether or not Montreal can continue to maintain such a high finishing rate. It's a legitimate question considering the construct of the situation but, as pointed out by Ravi Ramineni in a discussion this morning on twitter, ‏the problem with making such assertions is that we're looking purely at the shot totals rather than looking at the qualitative state of the shot.

However, while it's interesting enough to question whether or not the Impact are going to stick around and continue to score goals at their current rate, I'm going to leave that for another day. It's even more interesting that Kansas City came up with twice the amount of attempts on goal and the only scored once. That one goal was on a foul that was made right on the line of the 18 yard box. Had the linesman not been on his game, that call could have easily been a free kick.

The question that I really have is more of why was Sporting unable to build upon their chances. Looking at the amount of clearances that the Impact had  I kind of wondered if the fact was that they just couldn't maintain the needed pressure upon Troy Perkins goal.

Kansas City Attempts Name Minutes
FIRST HALF
Miss Joseph Peterson 6'
Attempted blocked Paulo Nagamura 19'
Miss Claudio Bieler 25'
Miss Claudio Bieler 42'
Goal Claudio Bieler 49'
SECOND HALF
Miss Seth Sinovic 49'
Miss Claudio Bieler 56'
Miss Kei Kamara 60'
Attempted Save Benny Feilhaber 65'
Miss Aurélien Collin 69'
Attempted Save Paulo Nagamura 70'
Miss Paulo Nagamura 71'
Attempted blocked Claudio Bieler 76'
Miss C.J.Sapong 78'
Attempted Save Joseph Peterson 82'
Attempted Save Aurélien Collin 85'
Miss Joseph Peterson 90'
Attempted Save Claudio Bieler 92'
Miss Kei Kamara 94'

SKCTimeline

Looking at this you can see three real bunches. First at the 69th-71st minute, Again with the 76th and 78th minute and then in the final moments game a solid run of 90 to 94, ending with Kei Kamra's shot that just drifted wide.

Ultimately, I'm more inclined to believe that Sporting did just as much to not earn a result as the Impact did to really earn one. But while most people would be willing to chalk this game up to luck, I just think it's the largest example of what the Impact do well, and that's disrupting opposing teams while allowing the Impact to sit in their own defensive third. I'm still not inclined, as I'm sure Matty isn't either, to give the Impact the full rights of being a team that is "for real". But they certainly continue to prove their case week in and week out.