

September PScore Update: Are the Red Bulls the Arsenal of MLS?
/By Jared Young (@jaredeyoung)
This month’s Proactivity Score (PScore) post takes a giant leap toward reaching the initial promise of the metric, which is to describe numerically how a team plays tactically. The original vision was to look at teams across two dimensions – how high up the pitch do they press the opposing team and how direct or indirect are they with their passing. Indirect passing teams, for example, are primarily concerned with maintaining possession and use shorter passes and more backwards passes in order to do so. Direct teams are trying to get up the pitch as quickly as possible. The theory is that direct teams will play their defensive block lower while possession oriented teams like Barcelona or Arsenal will press higher up the pitch.
To the right is a chart that highlights how teams might choose to play.
All season long PScore has only been scoring the direct/indirect passing dimension, but in September, thanks to work by @MattyAnselmo and @KevinMinkus here at ASA, the PScore will now include the defensive dimension.
To determine a team’s offensive directness I looked for observations of extreme possession where the score of the game was within one goal, and built a regression using passing styles to predict each team’s level of possession. Essentially, how a team is passing the ball is indicative of how likely they are to have possession.
This month the PScore will include a very simple metric to describe how high a team presses, and that is passes allowed per defensive action attempted in a team’s attacking half. The defensive actions are simply attempted tackles and interceptions. Those statistics are the best at identifying defensive intent. Other statistics like clearances or blocks are reactionary in nature, so not included in the analysis. I looked at defensive pressure across the entire pitch and the attacking half has the most variability. Here is a chart of all the teams.

All teams employ roughly the same pressure in their defensive third. Note how the three most aggressive teams, the New York Red Bulls, Sporting Kansas City and Real Salt Lake are equally as intense in the next 6th of the field but the rest of the league catches up to their intensity. Sporting Kansas City is the most intense defensive team across the entire pitch, and perhaps not surprisingly they give up the fewest shots in the league.
With that, here is the latest table for PScore, which now has two dimensions.
| Team | Off Rank | Off Pscore | Def Rank | Def Pscore |
|---|---|---|---|---|
| RBNY | 3 | 6.2 | 1 | 12 |
| SKC | 19 | 4.3 | 2 | 12.8 |
| RSL | 16 | 4.7 | 3 | 13.4 |
| NYCFC | 7 | 5.8 | 4 | 15.4 |
| LA | 5 | 6.1 | 5 | 17.3 |
| DAL | 15 | 4.8 | 6 | 17.6 |
| HOU | 10 | 5.3 | 7 | 17.8 |
| NE | 9 | 5.4 | 8 | 18.5 |
| POR | 12 | 5.2 | 9 | 18.7 |
| Tor | 8 | 5.8 | 10 | 18.9 |
| VAN | 18 | 4.5 | 11 | 19.1 |
| COL | 20 | 4.2 | 12 | 19.5 |
| SJ | 17 | 4.5 | 13 | 19.7 |
| SEA | 4 | 6.1 | 14 | 22 |
| CHI | 14 | 4.9 | 15 | 22.4 |
| PHI | 11 | 5.3 | 16 | 22.8 |
| ORL | 1 | 6.7 | 17 | 23.1 |
| MON | 2 | 6.2 | 18 | 23.3 |
| CLB | 6 | 5.9 | 19 | 23.8 |
| DC | 13 | 5.1 | 20 | 24.2 |
D.C. United provide the lowest block, followed closely by Columbus and Montreal, who happen to pass the ball valuing possession. But now let’s plot the two scores against each other and see where teams land. The defensive axis has been reversed from the illustration above, now low pressure is at the top of the chart. The lines highlight the league averages.
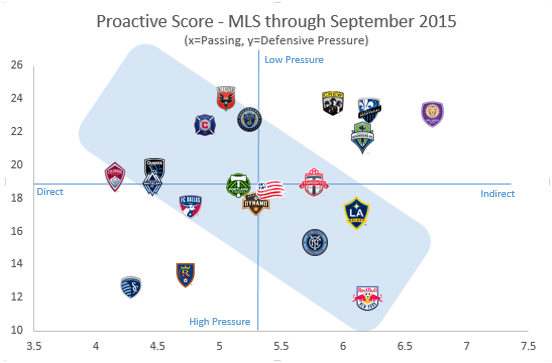
As you can see, MLS teams are all over this tactical map. Good teams can be found in every region, as can poor teams. Some teams do stand out though. Both Sporting Kansas City and Real Salt Lake employ high pressure but also use a direct style of passing. The worry there is the amount of energy that it takes to play that style. To work hard pressing up the field and then quickly strike offensively requires a high level of fitness. On the other side Columbus and Seattle are possession oriented with the ball but also sit their defenses back when they lose possession.
It appears as though the New York Red Bulls are the Arsenal of MLS, employing the highest pressure and also seeking to possess the ball as much as possible. No team really owns the reactive side of the equation. While D.C. United, Chicago and Philadelphia all sit deep, they do like an average amount of possession. This could be construed as wasteful however, and sure enough those three teams all struggled offensively this year, cumulatively scoring 8.6% less than the league average. Then there is that other reactive grouping of Colorado, FC Dallas, Vancouver and San Jose. That group has been a little more successful overall and they’ve done it with defense, collectively allowing 14.5% less goals than the league average.
I took the liberty of grouping some of the teams that have similar styles. You might have drawn them differently, but here is my chart.

I’ve added cumulative goal differential within each group as well. I’ll let you draw your own conclusions but there are good and bad teams in each grouping, which goes to tell you that no matter what style of soccer a team plays, whether they are reactive or proactive or something entirely different, that execution of the plan is critical.
There is much more to come as it relates to PScore(s) and what it can tell us about teams. These current spots on the chart just represent the average position for the whole season, but teams may have had interesting journey’s along the way. Perhaps we’ll find they were quite good using one combination of tactics and very poor at others. Next month we’ll look for gold in them thar tactical hills.