

Do Keepers in MLS Have a Weaker Side?
/By Alex Rathke (@alexrathke)
In Week Two of the 2016 MLS season, I watched the Houston Dynamo beat FC Dallas 5-0 at BBVA Compass Stadium. After the match I saw the Shot on Target (SoT) statistics and noticed Houston had taken three shots on goal towards the lower right-hand side against Dallas’s keeper Jesse Gonzalez. Was Gonzalez weaker on his left side? Since I was a young boy playing soccer, I've heard numerous coaches talk about a goalkeepers’ “weaker side”. Is there something the coaches know about goalkeeper weaknesses that we analysts don’t?
Goalkeeper research
There has been a fair share of work been done on evaluating goalkeepers to my knowledge. During the OptaPro Forum this past February, Sam Jackson essentially introduced a new metric for evaluating how goalkeepers handle crosses in the box. Elsewhere, in the Premier League, Paul Riley has done a lot of work examining which areas of the goal are scored in more often per goalkeepers. Before that, Colin Trainor wrote an excellent piece on close and far post shooting covering the Big 5 Leagues in Europe (EPL, Bundesliga, Serie A, La Liga, and Ligue 1).
Before we have a look at the methods and data, let’s discuss why it may be important to know if a keeper has a “weaker side” or not. If they do have a ‘weak side or even a weaker area’, he and his team may be at risk of getting exposed and that side of the goal getting consistently targeted and thus conceding a lot of goals.
In order to evaluate a keeper’s weaker side, my brain automatically thinks of a number of variables: Goal Mouth Area Conceding (GAC) probability, the speed of the shot taken, where it was taken, was it a header or a kicked shot (for clarity's sake, I'll use the term "footed" from now on) and the goalkeeper and defenders' positioning. There may be more, and this concept reminds me of the complications we face with Expected Goal (xG) models. In this post, I will focus on three areas:
- The number of SoT faced and goals conceded by each respective goalkeeper.
- Introduce a new ‘metric’ on calculating GAC probability
- What influence a footed vs a headed shots has on a keepers’ weak side.
Methods and Data
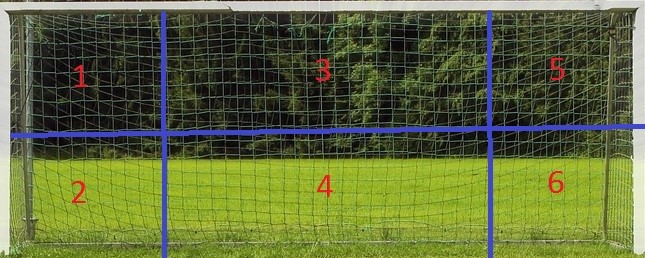
To see if MLS goalkeepers have weaker sides, I have used data from the 2011 season until and including Sporting Kansas City vs LA Galaxy game on May 2nd 2016. To have a big enough sample size to evaluate, the keepers in question had to have faced at least 350 SoT to be considered. This left 16 goalkeepers in the study of which 13 are contracted to MLS for this season. Therefore, this study will examine in more detail those 13 keepers’ data rather than all 16 (as 3 have either moved to a different league or have retired). Penalties were included in the data yet own goals and goals not scored with foot or headed shots were excluded due to unsuitability and a low sample size. Each SoT and goal scored was recorded to the area that it hit in the picture below.
Results
I have decided to break the results into four areas:
- Shots on Target faced by Goalkeeper per Area
- Goals Conceded by Goalkeepers per Area
- Goals Conceded from Footed Shots by Goalkeepers per Area
- Goals Conceded from Headers by Goalkeepers per Area
Probably like yourself, my first thought was to look at the colors and the corresponding area. The results from SoT Faced by each of the respective goalkeepers are interesting to look at, yet, in hindsight I do not think that they tell us much about the keeper, maybe nothing at all. I would argue that they tell us more about the team’s defense rather than the keeper’s “weaker side”.
Now for the good stuff. Total Goals Conceded by each keeper may give us an indication of a particular weaker side and may be even a certain weaker area. Whether the shot was a header or a kicked shot will be examined below in further detail.
My immediate areas for concern are the middle areas of the goal (Areas 3 & 4). There may be a positional problem if the keeper in-question concedes a high number of goals in these areas. For instance, Dan Kennedy, Tally Hall and Luis Robles have conceded the most goals from Area 4 (lower center) of the goal. Kennedy and Hall are in the top two of most conceded goals from this area while Robles has conceded quite a number in terms of his SoT numbers from this area. It may be of interest for teams (using video tools as such) to evaluate why this is happening to the keepers in question. It may simply be down to keeper and defensive positional errors or maybe the distance of the shots taken.
The corners of the goal (Areas 1, 2, 5 & 6) could also indicate slower reactions of the keeper attempting to make a save. A first look at the bar chart shows us what we presumably all know already; it is easier to score in the lower corners of the goals (Areas 2 & 6) than in the top corners of the goal (Areas 1 & 5). This could be down to the following:
- Some keepers find it hard to dive into the bottom corners of the goal (although they have been trained to do this).
- There’s a better chance that a shot will be converted when it is lower in the goal as to opposed to the higher parts of the goal (because of going over the crossbar).
At ratios of 15:7 for Stefan Frei, 12:7 for Joe Bendik and 16: 7 for David Ousted, these goalkeepers have conceded more goals in Area 1 than Area 5. Comparing Area 5 to Area 1 highlights keepers such as Nick Rimando, Bobby Shuttleworth & Josh Saunders with (13:8), (13:9) & (12:8).
Now that we have examined the amount of goals conceded per goalkeeper over the past five and a bit seasons, let’s break the goals down further into kicked and headed shots.
Warning: central issues! Kennedy, Hall, Robles, Bendik, Saunders & Clint Irwin have conceded most of their goals from footed shots in Area 4. In terms of the corner sections of the goal, let’s first look at the keepers’ left side (Area 5 & 6).
Area 5 is a quite low scoring area and the same can be said for its corresponding side (Area 1) in terms of overall goals conceded by the keepers. For the lower left side (Area 6) for example, Sean Johnson, Rimando, Shuttleworth, Bendik & Ousted have conceded more goals than on their lower right side (Area 2).
When we look at Area 2, Bill Hamid & Zac MacMath are the only two goalkeepers who have conceded more goals than their Area 5 section.
We already know from xG models that headers are not converted as often as footed shots. This is due to a number of factors such as distance and angle from goal. Ousted has conceded quite a number of headers in Area 2 given the amount of headers he’s conceded overall. Robles again conceded a high number of headers in Area 4, which is worrying. MacMath has conceded a high number of headers given his overall total conceded.
What does the data tell us about the keepers?
It has given us an insight into how good each of the respective goalkeepers are from protecting specific areas of their goal. However, this does not necessarily represent a true reflection of their weakness. The number in the charts above just show us the number of SoT and goals conceded by each goalkeeper in each section of the goal. What we are missing is the true value/how often in a certain area the goalkeeper conceded goals.
Let’s look at an example: Goalkeeper A & Goalkeeper B play the same number of games and concede the same number of goals (16) all with footed shots in Area 2. The difference between A & B is the SoT faced. A faced 50 and B faced 62 shots. Therefore:
Goal Area Conceded% (GAC) => Goal(s) (type) / SoT x 100 = %chance of scoring in that GAC.
Goalkeeper A = 16/50 x 100 = 32% chance of scoring in Area 2.
Goalkeeper B =16/62 x 100 = 26% chance of scoring in Area 2.
| Area 2 | Area 3 | Area 4 | Area 5 | Area 6 | Weaker Side | ||||||||||||||||||||||||||||||||||||||||||||||||||||||||||||||||||||||||||||||||||||||||||||||||||
|---|---|---|---|---|---|---|---|---|---|---|---|---|---|---|---|---|---|---|---|---|---|---|---|---|---|---|---|---|---|---|---|---|---|---|---|---|---|---|---|---|---|---|---|---|---|---|---|---|---|---|---|---|---|---|---|---|---|---|---|---|---|---|---|---|---|---|---|---|---|---|---|---|---|---|---|---|---|---|---|---|---|---|---|---|---|---|---|---|---|---|---|---|---|---|---|---|---|---|---|---|---|---|---|
| Left |
0.55 | 0.18 | Right |
0.16 | 0.15 | Right |
0.19 | 0.54 | Left |
0.15 | Left |
0.54 | 0.14 | Right |
Right |
0.13 | Right |
0.54 | 0.17 | 0.65 | Left |
0.13 | 0.19 | 0.65 | Left |
0.6 | 0.62 | 0.17 | 0.71 | 0.51 | Equal |
0.69 | 0.56 | 0.56 | Left |
0.72 | 0.17 | 0.16 | 0.56 | Left |
|
GAC calculations have shown us some interesting results. The red colored areas indicate a high conversion rate (bad for the keeper) while the green area is a low conversion rate (good for the keeper). I think it is safe to say that the middle area results (Areas 3 & 4) are not surprising, yet there are indications that some goalkeepers are not as strong in these central areas as others.
Earlier in this post, I tried to reason why shots in the lower corners of the goal (Areas 2 & 6) would be converted at a higher rate than in the higher corners (Areas 1 & 5). The results have shown the higher corners of the goal are not as well guarded areas as the lower corners. Some goalkeepers appear to have one “more predominately weaker side or area” than others, yet there as a couple of exceptions as you can see.
| Area 2 | Area 3 | Area 4 | Area 5 | Area 6 | Weaker Side | ||||||||||||||||||||||||||||||||||||||||||||||||||||||||||||||||||||||||||||||||||||||||||||||||||
|---|---|---|---|---|---|---|---|---|---|---|---|---|---|---|---|---|---|---|---|---|---|---|---|---|---|---|---|---|---|---|---|---|---|---|---|---|---|---|---|---|---|---|---|---|---|---|---|---|---|---|---|---|---|---|---|---|---|---|---|---|---|---|---|---|---|---|---|---|---|---|---|---|---|---|---|---|---|---|---|---|---|---|---|---|---|---|---|---|---|---|---|---|---|---|---|---|---|---|---|---|---|---|---|
| 0.86 | 0.57 | Right |
0.8 | 0.58 | Left |
0.67 | 0.15 | 0.18 | Right |
0.18 | 0.13 | 0.88 | Left |
0.53 | 0.04 | 0.16 | 0.6 | 0.57 | Left |
0.71 | 0.18 | 0.14 | 1 | Left |
0.13 | 1 | 0.13 | Left |
0.82 | 0.8 | 0.57 | Left |
1 | Left |
0.67 | 0.7 | 1 | 0.67 | Left |
0.16 | 0.07 | 1 | Left |
0.6 | 0 | 0.67 | 0.8 | Left |
0 | 0.77 | 0.15 | Right |
|
Using GAC% we have been able to identify a weaker side and possibly even a specific weaker section of the goal for each goalkeeper. However, before we say for certain that these figures are correct, I would still mention a note of caution as these numbers are based on pure conversion rate (per goalkeeper per area). Three “big” factors which have not been accounted for in this post which are 1. Distance of the shot from goal; 2. Angle of the shot & 3. Speed of the shot. I strongly feel that these three factors (even just the co-ordinates of the shot) would change the results significantly due to these factors.
In terms of the GAC% from headers, we have to remember that the sample size overall is sufficient but it’s the area specific numbers (SoT & Goals conceded) which are still quite small. This is due to firstly, the number of headers being taken per game and season and secondly, how many of these actually hit the target and are converted in each area.
What could be done next? Certainly a couple of things:
- Gathering more data and testing if in season results differ to end of season.
- Using the co-ordinates and testing how distance and angle matter in terms of area conversion rates.
- Does Shot Speed have an effect
Practical Applications
What can we take away from this post? I for one think that this post has been able to identify specific areas for goalkeeping improvement. For example, as identified at the start of the post, if goalkeepers did indeed have a “weaker side” or “weaker area” then this should be addressed as soon as possible using specific drills. Using more traditional tools such as video analysis could also be helpful in identifying these problem areas for both keepers and coaching staff.