

What Makes the Red Bulls' High Press Work?
/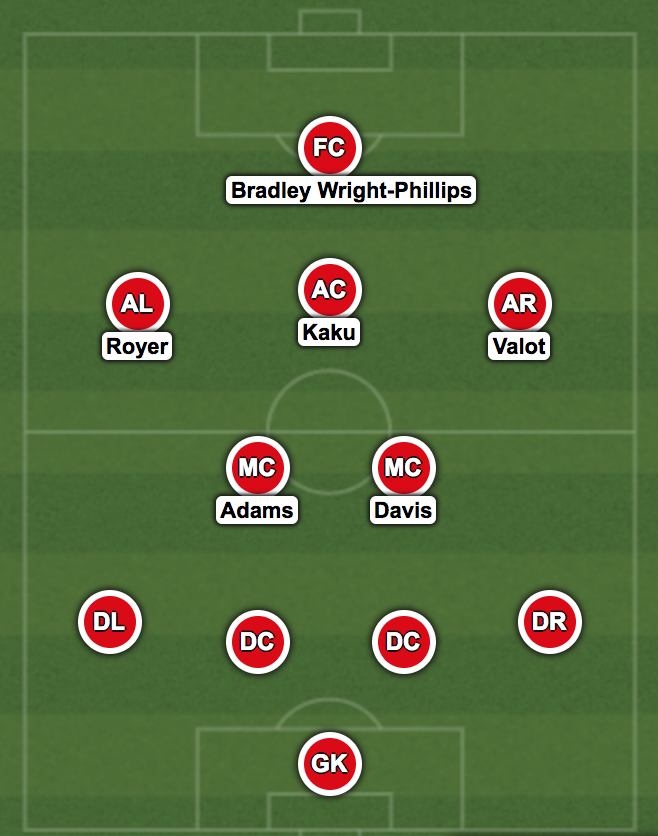
NYRB's typical formation
By Joseph Lowery (@joeincleats)
Jesse Marsch’s New York Red Bulls play a style unlike any other team in Major League Soccer. They employ a frenzied, but organized high press that is a staple of Red Bull teams all over the soccer world. RBNY usually set up in a somewhat fluid 4-2-3-1. Bradley Wright-Phillips leads the line, often occupying the space between opposing center backs and shrinking the field. Right behind BWP sits Argentinian playmaker Kaku. Flanking Kaku is usually a combination of Florian Valot, Daniel Royer, and Derrick Etienne Jr.; these wingers are tasked with pressuring the ball in wide areas and occasionally dropping to help the pair of deeper midfielders. Who are those deeper mids? USMNT starlet Tyler Adams and fellow American Sean Davis are instructed to patrol the entire center of the field, acting as a pair of disrupters, intercepting passes, marking opposing playmakers, and shutting down attacks.
This style of play is undoubtedly entertaining and has had some success so far this season. But in order to fully appreciate the great work that Marsch and his staff are doing, we are going to look at some statistics that better illustrate the effectiveness of this system.
PctA, xPctA:
The heart of the Red Bulls’ style of play involves flustering opposing players, closing down passing angles, and occupying key areas of space defensively. Judging by the pass competition percentage of their opponents this season, New York has been excellent in that area. RBNY have allowed the lowest PctA (pass completion percentage against) with just 69.2% and the second lowest xPctA (expected pass completion percentage against based on how and where the passes were attempted) with 74.2%.
Now, why is there a 5% discrepancy between these two figures? It is possible that the Red Bulls’ high pressure system is responsible for the variance against the model. No other team has as big a difference between their PctA and xPctA. At the same time, no other team in Major League Soccer plays a style quite like NY. It seems like a logical conclusion to say that the amount of physical and mental energy it takes to play against this team shows itself in the fluctuation against the xPass model.
PassA/g:
New York has the fifth fewest PassA/g (passes against per game) in all Major League Soccer, at 462.6. This can be partially attributed to the immediate and constant ball pressure that the Red Bulls apply. It is much harder to maintain possession when being constantly hounded by one, two or even three players. This is another important tenant of the system.
ScoreA/g:
An interesting way to roughly combine the last few stats is by looking at Score, a stat that measures passes completed over/under the expected number. The New York Red Bulls have the lowest Score against them per game in all of MLS, allowing 23.33 passes per game fewer than expected. How close is the next team in this category? NYCFC sit second with 11.10, less than half as many passes lower than their expected number when compared to the Red Bulls. In terms of limiting opposition passing, no team has been as effective as RBNY.
Here are the top five teams for ScoreA/g so far this season:
| Season | Games | PassF/g | PctF | xPctF | ScoreF/g | Per100F | VertF | PassA/g | PctA | xPctA | ScoreA/g | |
|---|---|---|---|---|---|---|---|---|---|---|---|---|
| 2018 | 9 | 461.6 | 68.8% | 72.2% | -15.74 | -3.41 | 6.02 | 462.6 | 69.2% | 74.2% | -23.33 | |
| 2018 | 11 | 600.1 | 80.5% | 80.5% | -0.25 | -0.04 | 2.5 | 398.4 | 70.8% | 73.6% | -11.1 | |
| 2018 | 11 | 579.1 | 83.3% | 81.1% | 12.57 | 2.17 | 2.82 | 411.7 | 75.4% | 77.2% | -7.35 | |
| 2018 | 12 | 569.4 | 82.1% | 81.% | 6.38 | 1.12 | 3.42 | 473.6 | 78.1% | 79.2% | -5.36 | |
| 2018 | 10 | 474 | 78.7% | 77.7% | 4.8 | 1.01 | 4.18 | 426.1 | 76.3% | 76.9% | -2.44 |
The benefits of Marsch’s system are not strictly limited to passing. We can see a relevant statistical impact of the high press in opposition shooting numbers as well.
ShtA/g, SoTA/g, xGA/g:
New York only allows 10.0 ShtA (shots against) per game. That number is good for second fewest in the league. With the “all-in” nature of the Red Bulls’ press, it would be fair to reason that even though they give up so few shots per game, a higher number of those shots would be dangerous and on target. After all, a team that extends itself so far into the last third of the field when defending is likely to suffer a larger number of breakaways resulting in clear cut chances.
Not so. RBNY are third in Major League Soccer in shots on target allowed per game (SoTA/g) with 3.8. The players are so well prepared to cover key areas of the field that New York does not suffer on the defensive end. In fact, their 1.13 expected goals allowed per game (xGA/g) is second in the league after Gregg Berhalter’s Columbus Crew.
The statistical impact of the Red Bulls’ playing style is clear from a defensive standpoint. Is there an offensive boost as well?
Because Marsch employs such an effective high energy, frenetic defensive scheme, his team’s attack patterns tend to mirror that same intense style. A major objective of the Red Bulls’ pressing system is to keep the ball in the opposing half of the field. Because of this, New York tends to attack very directly. Their center backs play long balls into BWP, their fullbacks look to play driven passes to the feet of the front four, and the midfield pivot drives play forward with balls down the channels or straight line dribbling. The outside forwards have freedom in the attack - they try to find and occupy space to promote forward movement. Kaku, a huge part of the system, sits right under Bradley Wright-Phillips and constantly unlocks opposing defenses with well weighted through balls.
VertF:
We see the Red Bulls’ direct style clearly when looking at the vertical passes (passes towards the opponents’ end line) played by Marsch’s squad. They have the highest average distance of completed vertical passes in MLS. In terms of vertical passing, three of the top ten MLS midfielders and forwards with at least 100 passes play for the Red Bulls. New York’s two starting center backs also rank in the top four in vertical distance among center backs with 200+ passes.
| Season | Team | Min | Pos | Passes | PassPct | xPassPct | Score | Per100 | Distance | Vertical | Touch% | |
|---|---|---|---|---|---|---|---|---|---|---|---|---|
| 2018 | POR | 482 | D | 203 | 81.3% | 71.4% | 20.1 | 9.9 | 24.9 | 12.5 | 8.6% | |
| 2018 | ORL | 757 | D | 274 | 75.2% | 74.% | 3.3 | 1.2 | 22.4 | 11.5 | 7.8% | |
| 2018 | NYRB | 718 | D | 336 | 70.2% | 68.6% | 5.5 | 1.6 | 21.5 | 9.8 | 9.1% | |
| 2018 | NYRB | 675 | D | 331 | 74.9% | 73.6% | 4.2 | 1.3 | 21.8 | 9.8 | 9.1% |
GF/g, xGF/g:
A direct style is all well and good, but does RBNY’s attacking system yield results in terms of goals? The Red Bulls have the highest number of goals scored per game (GF/g) with 2.56. That number is 0.34 goals per game higher than the Houston Dynamo, who sit second. RBNY’s offense also yields the second most xGF/g (expected goals for per game), 2.03, in the league.
We see even more impressive numbers when we look at player xG.
Striker Bradley Wright-Phillips, the focal point of New York’s attack, is in the top five for xG/96 and xG+xA/96 out of forwards with at least 400 minutes played in Major League Soccer. Deserving of a mention, Daniel Royer ranks third in xG/96 out of all attacking midfielders/wide attackers with 0.54.
Riding the high of a three-game win streak, including a recent 4-0 victory in the Hudson River Derby, it can be easy to heap praise onto Jesse Marsch. With that in mind, sifting through the data helps us see just how excellent a job Marsch is doing with his New York Red Bulls: at or near the top of a handful of defensive and attacking metrics, the Red Bulls have clearly managed to implement their unique high pressing scheme at an elite level. If these numbers can hold up over an entire season, RBNY have a chance to do some major damage in the playoffs.