

Setting the Table: Week 14
/By Eric Walcott (@ericwsoccer)
Welcome to Setting the Table. Each week we take some time to focus on the best chance creators in MLS from the last weekend. If you want to see the best chances that were wasted, check out Lowered Expectations. Here we focus on chances that ended with the ball in the back of the net.
If week 13 was the week of goals from fast transitions off turnovers, week 14 has brought us long possessions, surprising goalscorers, and the return of an old friend.
#5 Victor Vazquez to Tosaint Ricketts, TFC, 38th minute, 0.484 expected goals
Passes in sequence: 10

This goal is a microcosm of everything TFC is at their best. Already up a goal, the Reds patiently work the ball around until they find an opening, then they strike with lethal quickness, cutting through the Crew defense with ease. The attacking move really starts with Gregory van der Wiel spotting space and Giovinco. Perhaps even more important than the final ball he plays is the perfectly timed run Victor Vazquez makes to be in position for the assist. You can see in the replay that Vazquez spots Tosaint Ricketts’ run before receiving the ball from Giovinco, and that pass is the only thing on his mind when he does receive it.
Speaking of Ricketts, there are clearly a lot of things going wrong for TFC these days (and believe me when I say the temptation to turn this into another “will TFC make the playoffs?” column is great) but he's is not one of them. One might even argue that Toronto would be no better off with a healthy Jozy Altidore than they are currently. Ian did a great job breaking this down (and looking at TFC’s defensive issues) in Expected Narratives last week, but it’s worth pointing out again, if only to highlight how underrated Ricketts is throughout MLS.
To recap, Altidore, before getting hurt, was contributing 0.78 xG+xA (from the run of play) per 96 minutes in 2018, after putting up 0.54 xG+xA in 2017. Meanwhile Ricketts is contributing 0.77 xG+xA per 96 this season.
| All Passes | Attacking Third | ||||||||||
|---|---|---|---|---|---|---|---|---|---|---|---|
| Min | Touch % | Passes | % | Exp % | Diff | Passes | % | Exp % | Diff | ||
| 270 | 6.5% | 106 | 75.5% | 81.6% | -0.06 | 57 | 71.9% | 77.2% | -0.05 | ||
| 375 | 4.7% | 90 | 81.1% | 83.9% | -0.03 | 38 | 81.6% | 81.9% | 0.00 | ||
On top of that, Ricketts is actually a better passer than Altidore as well, according to our Expected Passing metrics. The differences aren’t huge, but it again points to Ricketts doing a more than adequate job filling in for Altidore.
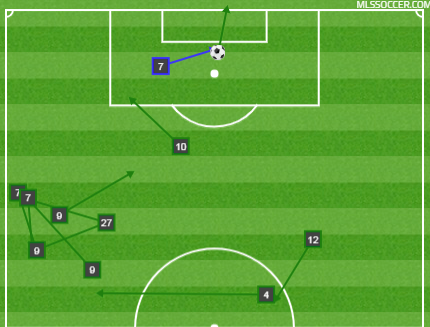
#4 Chris Wondolowski to Danny Hoesen, SJ Earthquakes, 74th minute, 0.532 expected goals
Passes in sequence: 3


You can watch the replay for a great example of a lethal counter-attack, something that manager Mikael Stahre would like to see more of from his Earthquakes team. I’d like to take this opportunity though to dive a bit deeper into the Chicago Fire defense.
In his fantastic piece earlier this week on defensive pressure, Jamon Moore shared this graphic about the goals and xG for each team defending in zone 14.
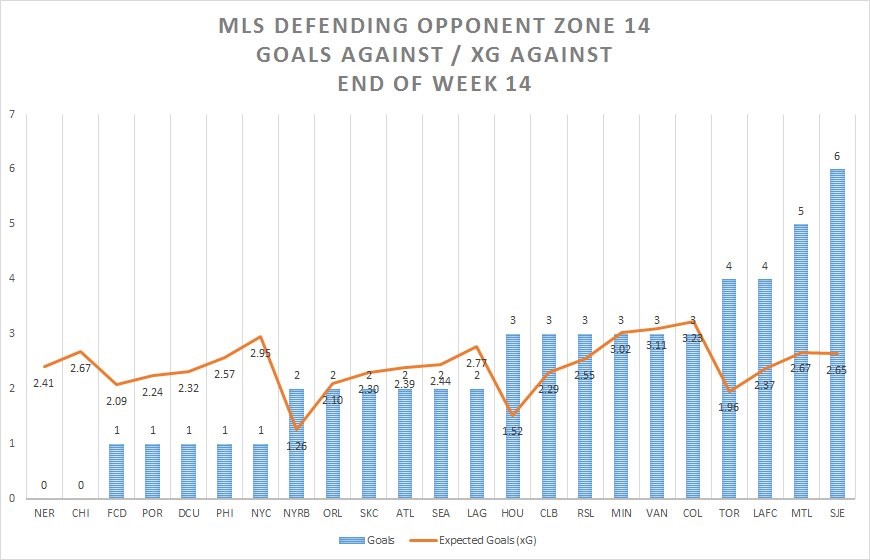
As you can see, Chicago are among the worst in MLS in xG allowed from zone 14, but have yet to concede from there. I got curious about that, guessing that a map of Chicago’s goals conceded from zone 17 might look pretty ugly. Spoiler alert, I was right. Jamon was kind enough to put that graphic together. Fire fans may want to avert their eyes.

The heatmap from the Fire vs Earthquakes game (Chicago on the left, SJ on the right) gives another visualization of the amount of activity that Chicago allows in such dangerous positions.

Chicago and San Jose heat maps. That big red blob in front of Chicago's goal is not ideal for them. Similarly, San Jose's green blob in front of Chicago's goal is also bad.
Chicago did manage to win the xG battle on the night 2.13-1.96 (and the actual game 2-1), but the amount of activity for San Jose in such dangerous areas suggests that might have had more to do with the ‘Quakes lack of ability to find the final ball, rather than anything the Fire was doing. That the Earthquakes generated enough touches to show up in that bubble inside the 18 on the heat map, and only generated 1.96 xG (0.5 of which came on the above chance) has to be discouraging.
#3 Brandt Bronico to Alan Gordon, Chicago Fire, 56th minute, 0.673 expected goals
Passes in sequence: 9


This chance takes us back to the Fire’s midweek game last week against the Philadelphia Union, a 3-1 loss for the Fire, but it also brings us back to an old friend in MLS who’s been able to maintain a surprisingly decent scoring rate. It’s been a few years since I thought of Alan Gordon as relevant to anything important in MLS, and indeed, he hasn’t exceeded 1000 minutes in a season since 2015.
| Team | Season | Min | Shots | Goals | xG | xG+xA | |
|---|---|---|---|---|---|---|---|
| LAG | 2015 | 1083 | 3.01 | 0.44 | 0.47 | 0.55 | |
| LAG | 2016 | 800 | 1.80 | 0.36 | 0.37 | 0.51 | |
| COL | 2017 | 923 | 2.50 | 0.31 | 0.49 | 0.59 | |
| CHI | 2018 | 539 | 2.67 | 0.71 | 0.53 | 0.55 |


