Passing Model Update
/By Matthias Kullowatz (@mattyanselmo)
We updated our xGoals model a few weeks ago, as well as our process for continuously updating it throughout the season. Naturally, we’ve done the same for the xPassing model, which estimates the probability of any given pass being completed based on a number of details about the pass. You can read more about the original model here, but here’s the summary of the new model:
Built with a different algorithm (gradient-boosted decision trees)
Uses the following pass details:
x,y field position
direction (angle) of pass
long ball indicator
through ball indicator
cross indicator
headed pass indicator
kick off indicator
free kick, throw in, and corner indicators
goal keeper indicator
home team indicator
player differential (due to red cards)
Does not include seasonal intercepts as we do for xGoals
Model details
This new xPassing model was built using xGBoost, a hot new version of boosted decision trees. Additionally, I include data from the 2018 season in the model fit. The new model fits the data better, and just as importantly, I can run the model with parallel computing, allowing me to update the model more regularly. I will be updating the model monthly in the 2019 season to make sure that changes between model fits are more continuous. For anyone curious, I tuned the model using a sequence of two tuning grids, scoring each fit with the log-loss metric using cross validation.
Those familiar with ensemble decision tree models like xGBoost know that the model is randomly different with every fit—at least, if you’re randomly sampling rows and/or columns for each tree, like we are. To test the magnitude of this random effect, I refit the model 10 times with 10 different random seeds. Across seasons, the standard deviation of estimated successful passes (xPass) ranged from 7 to 10 total completions. Considering there are more than 200,000 passes completed each season, I think it’s safe to say you won’t notice at the season level. At the player level, the typical standard deviation of pass score (completions – xPass) was 0.2 with a maximum of 0.6. League leaders hang out around +100, so these minor deviations due to randomness in the model aren’t going to screw up the rankings or anything.
Comparing new model to old
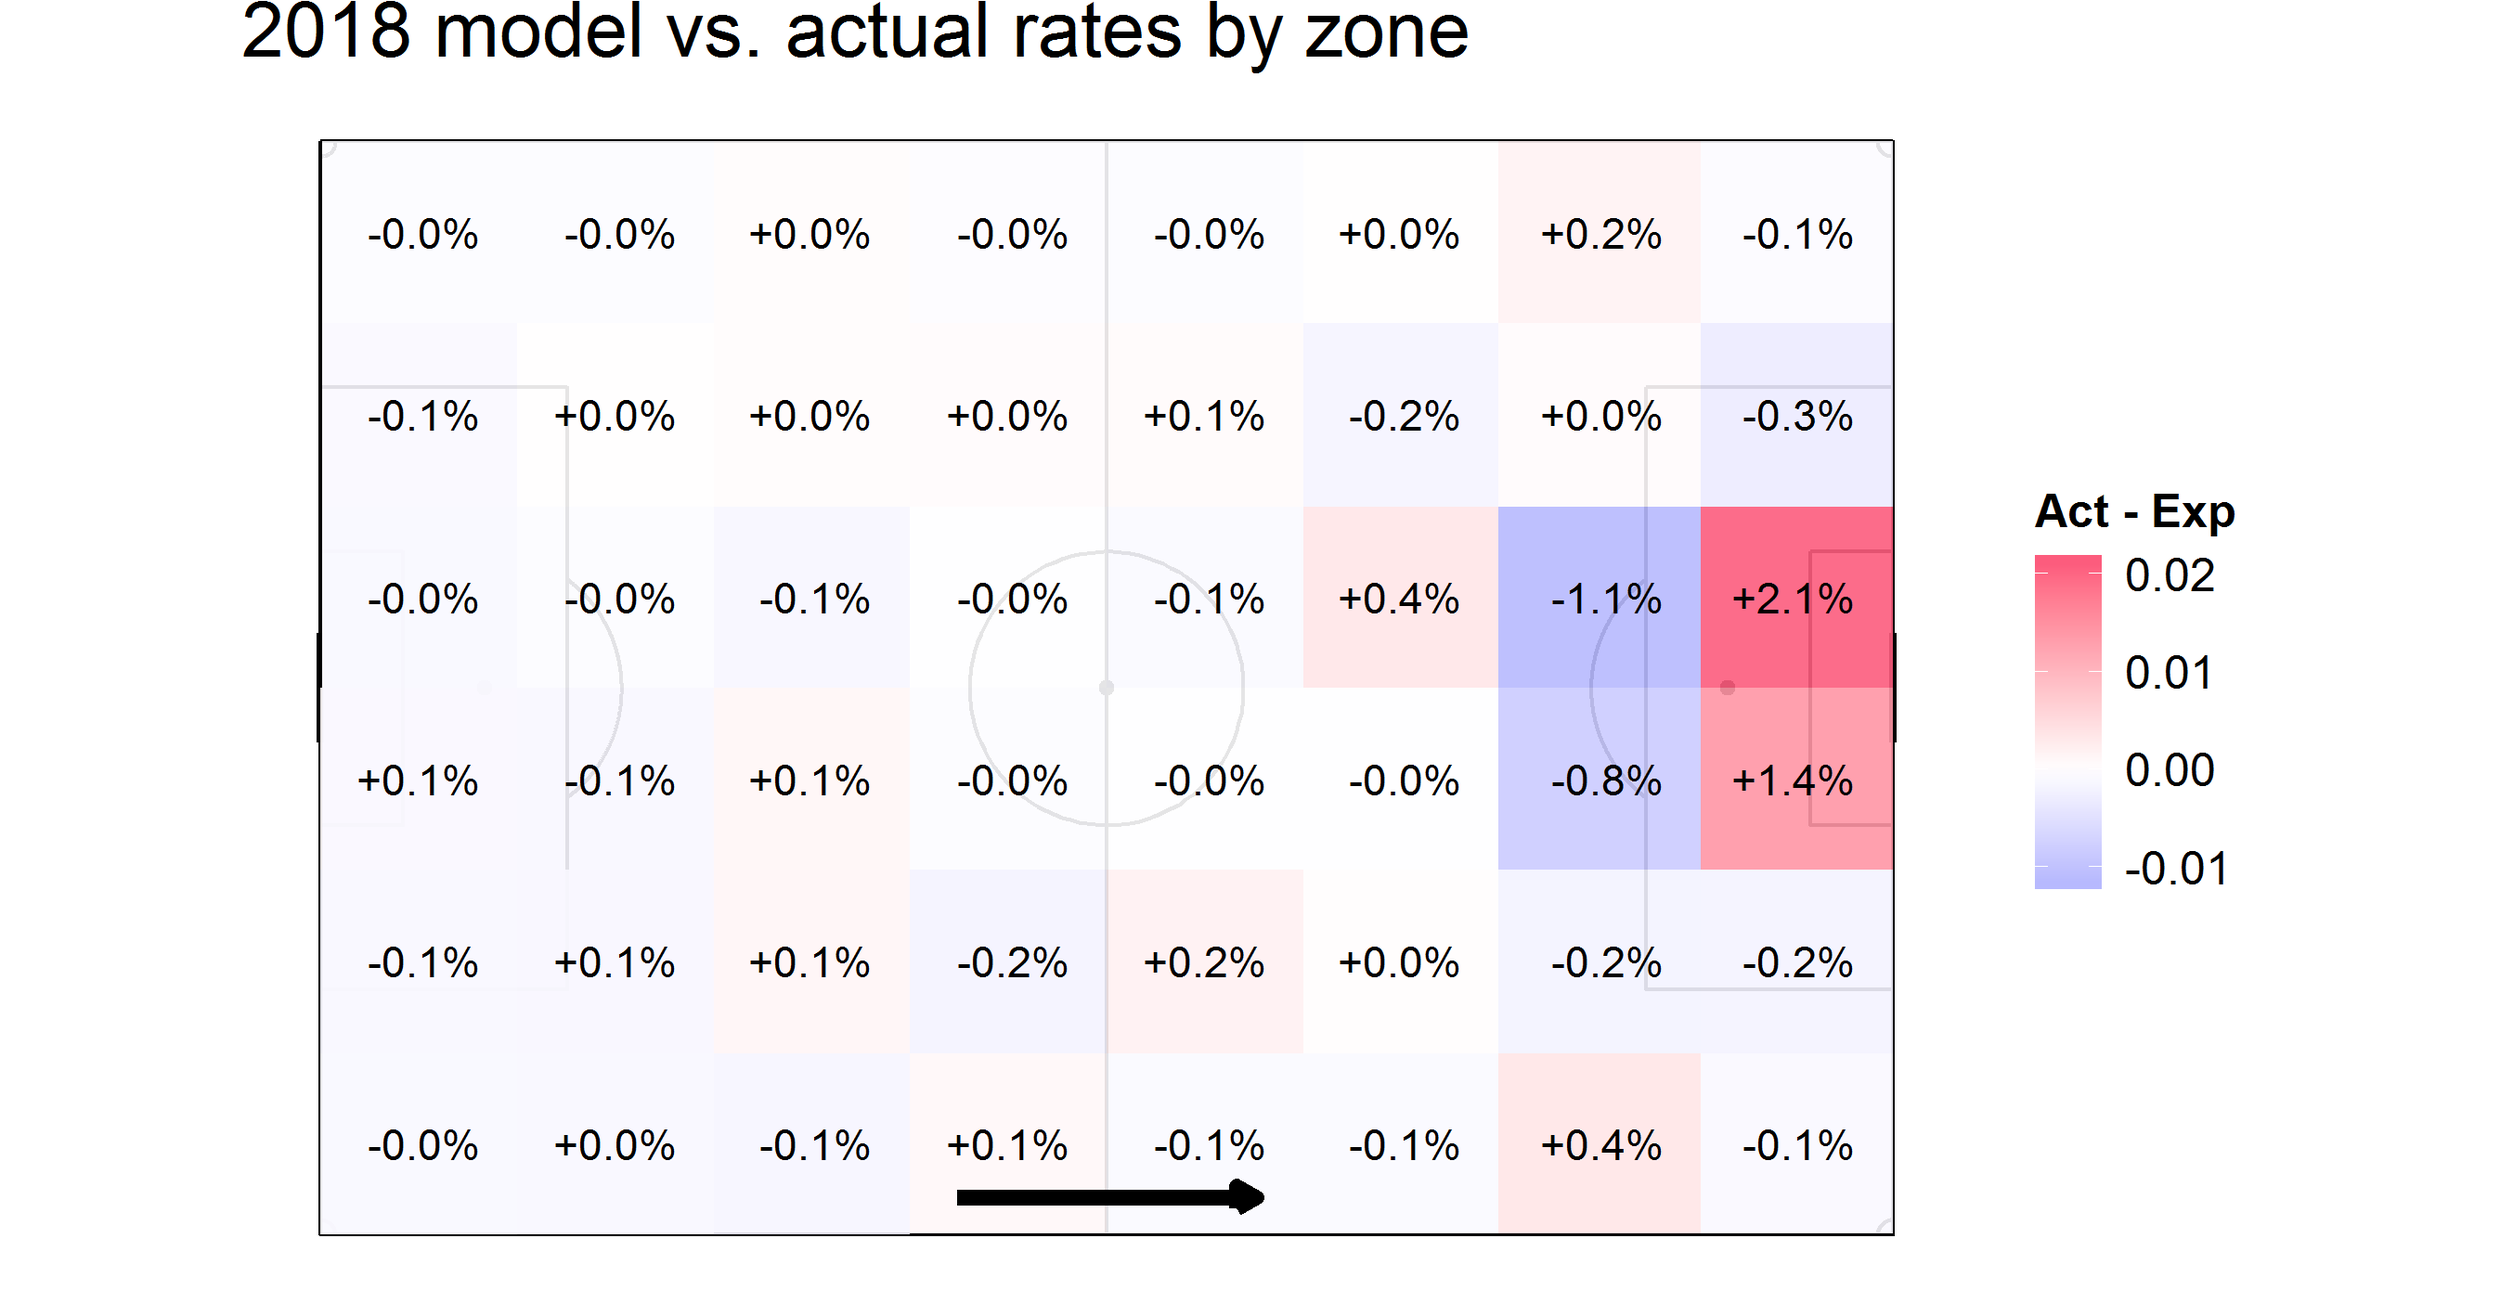
Here’s a summary of how the two models differ by zone. Positive differences indicate zones where the newer model is predicting higher completion rates, while negative differences are where the older model is predicting higher rates. The models generally agree for most of the pitch, but there is some disagreement around the box and on the attacking wings. The spoiler is that the new model does better in these zones.
And here are the player-seasons that will suffer the largest changes in this first model upgrade.
| Season | Completed | 2017Model | Score | 2018Model | Score | Diff | |
|---|---|---|---|---|---|---|---|
| 2015 | 1186 | 1164.7 | 21.3 | 1144.5 | 41.5 | 20.1 | |
| 2018 | 2022 | 1928.6 | 93.4 | 1945.4 | 76.6 | -16.7 | |
| 2018 | 1682 | 1636.3 | 45.7 | 1652.4 | 29.6 | -16.1 | |
| 2017 | 1520 | 1468.2 | 51.8 | 1482.8 | 37.2 | -14.6 | |
| 2018 | 1656 | 1590.8 | 65.2 | 1605.1 | 50.9 | -14.2 | |
| 2017 | 1642 | 1596.4 | 45.6 | 1610.1 | 31.9 | -13.6 | |
| 2017 | 903 | 897.1 | 5.9 | 883.7 | 19.3 | 13.3 | |
| 2018 | 2065 | 2016.8 | 48.2 | 2029.9 | 35.1 | -13.1 | |
| 2016 | 2025 | 1912.5 | 112.5 | 1925.5 | 99.5 | -13.0 | |
| 2018 | 1253 | 1238.5 | 14.5 | 1251.4 | 1.6 | -12.9 |