

CBA Talk: Comparing MLS Player Salaries to Leagues Around the World
/By Jared Young (@jaredeyoung)
Before the 2020 Major League Soccer season begins the owners and players will need to negotiate a new collective bargaining agreement. Metaphorically speaking, we could compare this negotiation to a pie eating contest, with the wrinkle being there is only one pie, and the goal is to eat the biggest piece. The fans offer the ingredients for this pie in the form of revenue, but it’s the league, the owners and the players who get to eat it. This contest won’t happen on the Coney Island Boardwalk or be streamed on ESPN+, but from time to time someone will emerge with public declarations intended to meddle with our opinions, and therefore put pressure on the other sides of the negotiation. Because we make the pie, you see, we ultimately decide how big it gets, so our opinions matter.
The league will try to convince us that the pie isn’t all that big, perhaps it collapsed after we delivered it. The owners will try to convince us that they’re not even eating the pie because they’re so busy stuffing the contractors who are building a new facility to make the game better. The players will try to tell you that their piece of the pie is so small one could barely consider it dessert. The truth, of course, will lie somewhere in between.
Since the opinions of the fans matter it’s good to be as informed as possible as to exactly how big the pie is, and how much everyone is eating. So to begin let’s look at the world through the lens of the MLS players. MLS players and their Union should be examining how they are paid relative to their American non-soccer counterparts as well as their competition internationally. In the four main sports the United States these negotiations have evolved to a point where player compensation is tightly tied to league revenue. In essence American leagues have tightly defined the size of the pie and how much players should typically get to eat.
Note: A discussion of the data sources and compilation decisions is located after the conclusions
Let’s start with a comparison of MLS to it’s domestic competition. MLS spent $271 million on player compensation in 2017, including net income via transfer fees, and earned an estimated $963 million. Net player spending was 28% of revenue in 2017.
The four major domestic leagues all target close to 50% for such a metric even though the data actually available shows that percentage as somewhat lower (a discussion on this topic also appears below). Nevertheless the four major leagues range between 37% and 46% using the data compiled, 9% to 18% higher than in MLS. Mapping that to hard salaries means that players could argue to see $87 to $174 million in higher compensation, or $150 to $300 thousand more per player in order to conservatively achieve par with their domestic competition.
MLS is by far the smallest and youngest of the leagues which potentially excuses this gap in two ways. The first is that the league is still investing in infrastructure, like Academies, facilities and stadiums, which limits their ability to spend on players. The second is that they have a higher fixed expenses relative to the size of the fan base and access to revenues. These issues can only be solved with time and growth, but as the league matures these issues should go away and MLS players will strive to reach salaries commensurate with their domestic leagues.
Turning to their global competition let’s start with establishing where MLS sits from a revenue perspective relative to the rest of the world.
MLS ranks sixth in the survey of fourteen leagues, right behind the big five European leagues and barely behind Brazil. This gives you the sense of the scale the US Market has relative to the rest of the world. Even a league that ranks a distant fifth in it’s own country has the financial clout of the biggest leagues in the world.
Examining the wage relationship to revenues reveals a larger gap between MLS and other leagues.
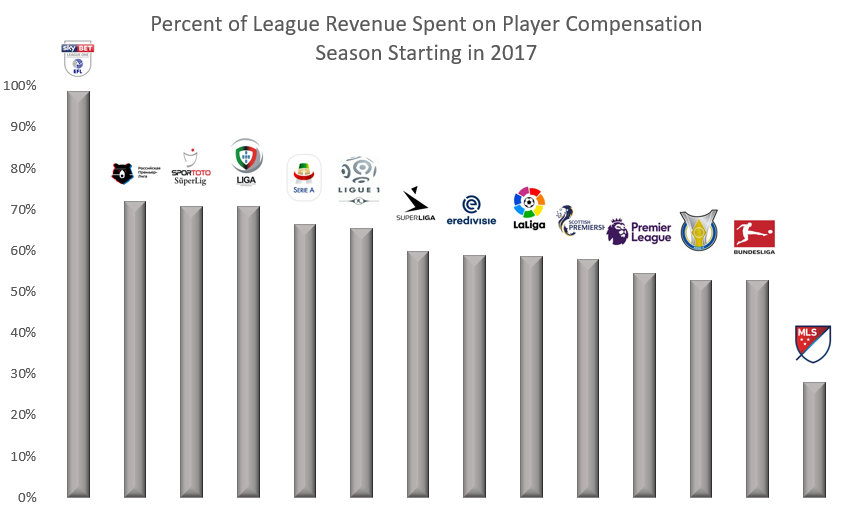
Other top flight leagues range between 52 and 72%. The lone 2nd tier league in the survey, the English Championship, is close to 99%. The impact that promotion and relegation has on the lower leagues is evident. Due to the financial upside of promotion, teams are willing to spend nearly all of their revenue for a chance to dramatically increase those revenues. The top flight teams are unencumbered by salary cap restrictions outside of Financial Fair Play oversight, which drives an open competitive market for top players and results in higher player bills.
Meanwhile, the MLS level at 28% is the result of a number of factors. The single-entity structure allows the league to centralize player spending and hold stronger negotiating leverage. Another factor is the lack of promotion and relegation which mitigates insecurity around future revenue, and therefore limits the short term need to spend. But the fact that the sport is relatively small in America is likely an understated factor.
If one is willing to take less reputable data sources into account, Japan’s J League has a compensation to revenue structure more aligned with MLS. Their estimated revenues of $650 million in 2017 combined with player expenses of $175 million put their rate at 27%. Perhaps managing a sport that isn’t the top sport in the country has some advantages, as there might be lower expectations for the quality of the league. The pressure to succeed is no doubt greater where soccer is the top sport, therefore putting pressure on owners to spend to win.
Examining the revenues of the international leagues makes the fixed cost argument proposed earlier more difficult to swallow, as they have a similar fixed cost base and are still spending significantly more on players. The argument that the MLS owners are still investing in features outside of the players is still a viable argument given the relatively early stages of the league. But these numbers do beg the questions: Exactly how much of the league’s revenue is being invested in the long term interests of the game, and how much of this spending is needed in the future? In other words, how long before the league can afford to pay players like they are paid in other sports leagues?
The players compensation is so far off the target they are unlikely to match the compensation levels of their competition in the next CBA. So what can they reasonably expect? Forbes data goes back to 2007 as does the player salary data, so a historical look at the trend could help answer that question.
In the two years available prior to the current CBA, the league the average was 19%, and since the 2014 CBA was put in place the average has been 25%. It seems reasonable to assume the players could get at least that lift of 6% again, which would put them in the low 30% range or perhaps a little higher.
A different lens to take with this data is to look from a fans point of view. The revenues the league earns, whether directly (via tickets sales) or indirectly (via advertisements), is the price paid for the league by the fans. The player compensation reflects, by and large, the quality of the entertainment they are paying for. MLS has put themselves at a disadvantage in this regard, as the entertainment to price ratio looks poor for fans of the league, relative to other entertainment dollars they could spend. MLS is literally banking onto its core base of fans willing to pay this higher premium, while they continue to attract and convert other sports fans to the league who are expecting a higher entertainment return for their dollar.
The $1 billion in revenue milestone is imminent for Major League Soccer, even if that will never be publicly declared. For most other sports leagues that would mean the players are taking roughly $500 million, yet MLS players are barely receiving half of that amount. That may be a necessity for the owners at this early stage of the league, but at some point the league will run out of fans willing to pay a premium to watch a local soccer team. The owners will need to compete with the quality of the leagues many soccer fans watch through a device. How close the numbers get will depend on how hard the players push in this next round of the CBA. Just how hungry for pie are they?
The next CBA Talk will focus on the negotiation from the owners’ perspective
Notes on the data sources
For MLS information, the Major League Soccer Players Union has been publicly releasing player salaries for over a decade, but the league also invests in players by way of transfer fees. While these fees are typically not released, transfermarkt.com tracks such fees paid to the extent possible. To attain net wages spent on players, the net transfer fees paid/received in each season was added/subtracted from the total amount of compensation paid to the players.
Revenues were compiled from Forbes annual publications, the best consistent source of these estimates. There is one key issue in the case of Major League Soccer, due to the way the league is structured. While Forbes’ estimates revolve around net team revenues, a good portion of the league revenues never make it to the teams. The television agreements are the most important example. Those revenues go to fund the player salaries, which the league funds within a certain budget. So additional research and assumptions needed to be made to get a complete picture of MLS. This is where Chris Smith of Forbes (@ChrisSmith813) was very helpful. These estimates include the television deals, the agreement with Adidas and their other top three league level sponsorship deals. In 2017 these league level agreements reached an estimated total of $150 million, that was added to the Forbes team level estimates for revenue. Similar estimates were made for all of the years in the trend graph that dated back until 2007, the first year that Forbes estimated MLS team revenues. No such additions were made to the other American sports leagues as those league only revenues are assumed to be immaterial relative to the purpose of the analysis. That’s clearly not the case with MLS.
Related to the accuracy of Forbes’ estimates there is one point of comparison thanks to City Group, the ownership group of NYCFC. In Europe the financials of football clubs are routinely made public, as is the case of the company that owns Manchester City. The fiscal year doesn’t exactly matchup with the calendar years in this article, but revenues for NYCFC are made public in the document. In FY2017 NYCFC is reported to have earned £30.1 million, or approximately $39 million adjusted. Forbes estimated their revenues at $42 million for the 2017 season. The FY2018 number was substantially higher at £40.4 million, or $53.3 million comparably, but a portion of that increase was attributed to Stadium Naming Rights. The Forbes estimate in this case seems very reasonable.
For the European soccer leagues Deloitte produces a report that publishes the wages including net transfer fees and revenues for each league. For the data from Brazil a research paper was used.
The American sports leagues analysis used more diverse sources. The American leagues have contractual levels of wage to revenue ratios but those are difficult to match with publicly available data. For example, NHL player wages are tied as precisely as possible to a 50% target, but the reality can often appear different. Still we can use these targets as context to determine if the data available is reasonable. The NFL salaries were taken from here, the MLB from here, the NBA from here, and the NHL from here. From a revenue perspective, all of the data was taken from Forbes and aligned with the season starting in 2017. Not all of the leagues have 2018 data yet, so that is the last point of comparison.
The NFL CBA targets a 48.5% wage to revenue ratio but the numbers in the chart reflect something much lower. The numbers in the chart reflect active cap spend plus dead money in the 2017 season. This obviously ignores money spent in year on bonuses that would be prorated as active cap hits to later years. Including the dead money from prior signing bonuses mitigates this issue somewhat but the spending in year is likely higher than the dead money which would result is some of the understatement.
The other leagues either contractually or publicly target a 50% wage to revenue ratio so the discrepancy in this data can come down to a few more factors:
1) Forbes estimates are systematically too high
2) Some revenues that Forbes includes are not included by the leagues in the official calculation
3) There are ancillary expenses, like contract insurance, that the leagues include as wage expenses that publicly available salary databases do not.
The goal for this analysis was to find as consistent a method as possible to the estimate these numbers for both the soccer leagues, including MLS, and the American leagues and that search for consistency guided the decisions.