

A LOOK INTO THE EFFICIENCY OF THE MAJOR LEAGUE SOCCER SUPERDRAFT - PART 2
/By Scott Knuth
In Part 2 of this analysis of the Major League Soccer SuperDraft we will look at the individualized performances of players and how those performances are attributed to their drafting club. The valuation metric we will be using is Goals Added (g+), a player valuation metric developed by ASA staff led by Matthias Kullowatz. In an introduction to the methodology behind Goals Added, John Muller describes g+ as being a “new model that values any touch of the ball anywhere on the field in terms of goals. For every single on-ball action—a header won, a dribble lost, an awful corner kick that sails over everyone’s head, you name it—the model digs through a bunch of contextual data and calculates how much the play improved that possession’s probability of ending in a goal and, just as importantly, how much it reduced the other team’s chance of scoring on the next possession.”
The first concept we are going to examine in this section is the players’ g+ per 90 versus the rounds of the draft. In an ideal situation, g+ runs linearly with the draft rounds, where the higher the draft round equates to a higher g+. In observing Figure 6 we see that is not the case. Instead, the MLS SuperDraft seems to be unpredictable in terms of player performance compared to draft position. In this analysis, we incorporated a control variable requiring a player to have played in a minimum of at least 10 MLS matches in order to be eligible. By doing so we eliminate outliers who might have skewed numbers due to the small sample of games that they have played in.

As expected, the graph above shows the majority of players signing contracts are drafted in the 1st round. While there is a noticeable difference in volume between the different rounds of the draft, there is a similarity in the g+ being attributed to the players, and there are no players that average over 0.6 g+ Per 90. In looking at g+ Per 90 of .25 and above, there are a total of 15 players that meet the criteria; 12 from the 1st Round, 1 from the 2nd Round, 1 from the 3rd Round, and 1 from the 6th Round. Ideally, there would be a linear trend where the first overall pick has the highest g+ Per 90, the second overall pick has the second-highest g+ Per 90, and so on. Figure 6 above shows that this is not a linear model as there are players from lower rounds in the SuperDraft that have a higher g+ per 90 than picks in the first round. This reinforces the idea that the SuperDraft is an inefficient player acquisition method. An interesting point to consider is the above figure only accounts for players that have gone on to play in at least 10 MLS matches, which disqualifies 457 of 576 SuperDraft selections from those figures. We will go into more depth regarding this statistic in a later section of the analysis. While Figure 6 provides a good example of how the g+ per 90 of the qualifying players are distributed amongst draft rounds, these players only make up a small minority of MLS SuperDraftees. In the next section, we will look at the individualized results of these metrics.

The individualized analysis of players, using Goals Added (g+) as a player valuation metric can also provide interesting insights into the efficiency of the MLS SuperDraft. Figure 7 will allow us to view the G+ Per 90 of individual players versus what their overall draft number was, while also color-coding the position the player primarily plays. If the MLS SuperDraft succeeded by having a linear draft, where the highest picked player is the most efficient in terms of G+ Per 90, the picks would run from the top-right portion of Quadrant 1 to the bottom-left portion of Quadrant 3. In observing this analysis, it becomes apparent that this is not necessarily the case. Rather, the majority of the players are positioned in Quadrant 4. While there is a slight downward trend for picks 1-12 that would match the trend for a linear draft, after that it stagnates and tends to be consistently around the same g+ Per 90 for picks 13-100. There are currently only 53 players that were drafted from 2013-2019 that have over a .16 g+ Per 90. There are some interesting names that are in Quadrant 1; Romario Williams and Pedro Riberio both no longer play in Major League Soccer and both Cyle Larin and Andre Shinyashiki were Rookie of the Year Award winners. Another interesting point, in contrast, is that there are 58 players who were drafted before the 50th pick that are below .16 g+ Per 90. In comparing the 53 players who had above the average of .16 g+ Per 90 to the 576 total drafted players over the seven drafts it comes out to only 9.2% of all draftees. Although these analyses offer an intriguing insight into the different efficiencies of MLS draft picks, they do have the possibility of being affected by a sampling bias. The sampling bias could occur because of the smaller sample sizes of certain players. While we did include a control variable of having to have played in a minimum of 10 matches, we recognize there is still a difference between a player playing in 10 matches versus a player playing in 50 matches. In the next section, we will look further into the performance of individual players by comparing their metrics against the percentage of minutes played.
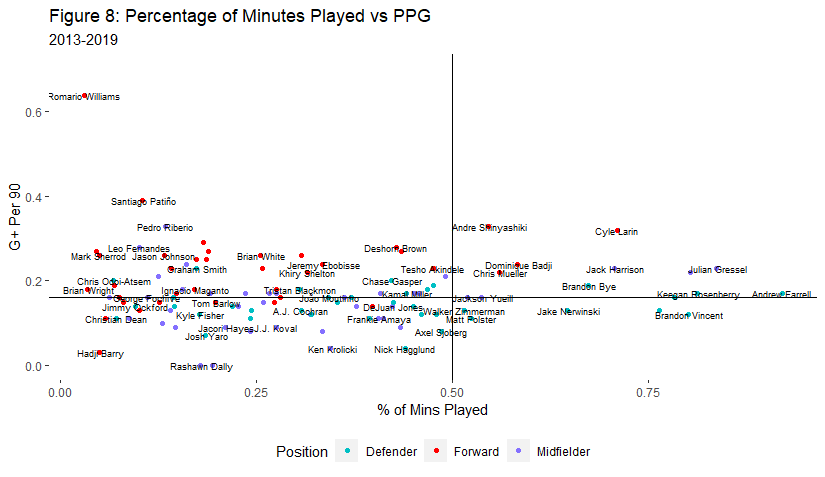
Analyzing the individual performance of players by comparing valuation metrics to their percentage of minutes played is another valuable insight into the SuperDraft. . An important note to make in the next section is that there are 119 players that meet the control variable of playing in at least 10 MLS matches out of the 576 players that were drafted in the 2013-2019 time period we are observing. In Figure 8 we will analyze the comparison of players’ g+ Per 90 against their percentage of regular-season minutes played. The first noticeable thing we see is that there are only 10 players that appear in Quadrant 1; which is where players with above .16 g+ Per 90 and over 50% of available minutes played are located. The furthest four right players in Quadrant 1 are all recognizable names to someone that watches Major League Soccer regularly; Julian Gressel (MLS Rookie of the year 2017), Andrew Farrell (2016 MLS All-Star), Cristian Roldan (United States Men’s National Team call up in 2017, 2018, 2019 and 2020), and Keegan Rosenberry (2017 USMNT January Camp and 2016 MLS All-Star). Conversely, the bottom left corner of Quadrant 3 has the three players with the lowest g+ Per 90 and percentage of minutes played: Christian Dean (3rd Overall Pick 2014), Hadji Barry (13th Overall Pick 2016), and Rashawn Dally (49th Overall Pick 2019). The small percentage of players in Quadrant 1, where it represents players that average over .16 g+ Per 90 and have played over 50% of available minutes, identifies 10 out of 576 total drafted players or 1.7%. This reinforces the idea that the MLS SuperDraft may be an inefficient player acquisition method. The next section will encompass an analysis of teams’ historic draft selections from 2013-2019.

The next step in analyzing the efficiency of the MLS SuperDraft is to look into the recent processes of drafting clubs. By taking each club and looking at whether they signed or didn’t sign a player is a good way to initially see if they are efficiently using their draft picks in terms of draft position in correlation to playing time and/or g+ Per 90. In Figure 9 we look at the drafting clubs from 2013-2019 and how many of their draft picks were signed to MLS contracts.
In this figure, we can see that most clubs sign approximately 53% of their draft selections, which leaves around 47% of their picks unsigned. This means that teams are dumping around 47% of this specific asset which could have been traded for other considerations. As an example, the Vancouver Whitecaps have 23 players selected who ultimately were not signed to MLS contracts in the last 7 drafts. Those 23 picks could have been traded for considerations to assist in signing a player through a different mechanism, such as GAM/TAM, an international roster spot, or a homegrown player’s rights. There are two other notable observations to make in regard to this graph. The first is that the recent expansion teams; Atlanta, Cincinnati, LAFC, Orlando City, NYCFC, and Minnesota have signed over 50% of their draft picks. The second observation is that the Columbus Crew and New England Revolution both have high signing rates of 69% and 71%, respectively. These two clubs have had varying results over those years where New England averaged a 5th place finish in the Eastern Conference, missed the playoffs a total of three times, and finished runners-up in the MLS Cup once. Columbus also averaged a 5th place finish in the Eastern Conference, missed the playoffs two times, and finished as runners-up in the MLS Cup once. At the other end of the spectrum, there are the Vancouver Whitecaps and Toronto FC who sign 32% and 39% of players drafted, respectively. In that 7-year time frame, Vancouver averaged finishing in 5th place in the Western Conference and missed the playoffs 3 times. Toronto FC averaged a finish of 5th place in their conference, they have missed the playoffs three times, made the MLS Cup finals three times, and won the MLS Cup in 2017. In looking at the two opposite ends of signing percentages of drafting clubs, it appears that there is no discernable difference between the effects of signing your draft picks. Once again, this would suggest that the SuperDraft is an inefficient process as it has an unpredictable element when it comes to signing and having players perform well. As previously mentioned, there were 457 of 576 drafted players who did not play in at least 10 matches for their club. In the next graph, Figure 10, we can see a team-by-team breakdown of how many of their signed draftees go on to play 10 or more matches. This figure includes all players drafted by clubs regardless of signing with the club or not. This brings about some interesting observations.

In 7 total drafts, there have only been 119 total players that have played at least 10 games for their respective clubs. With the 119 players being spread among the 25 teams that we have analyzed, this comes out to about 5 players per club that meet the 10-game threshold, which is less than the number of drafts that they’ve partaken in. While the threshold of 5 players per club is slightly skewed due to the six expansion clubs that have joined the league during this time period (along with the dissolution of Chivas USA), it gives us an interesting figure to look at. By observing the individual results of the MLS franchises we found that the club with the highest percentage of drafted players that played 10 or more matches was Orlando City with 35%, followed by FC Cincinnati, New England Revolution, and Seattle Sounders all with 33%. On the opposite end of the spectrum, the New York Red Bulls had the lowest percentage with only 10% of their drafted players playing more than 10 matches. They were followed by the Portland Timbers and FC Dallas with 13% and 12%, respectively. The second interesting observation is that it isn’t necessarily the recent expansion teams that were on the outer limits of the spectrum other than Orlando City and FC Cincinnati. The expansion teams’ percentages were as follows: Atlanta United with 20%, FC Cincinnati with 33%, LAFC with 29%, Minnesota with 31%, NYCFC with 14%, and Orlando City with 35%. It is interesting, however, to see that there is a slight correlation between the percentages and how teams have performed over recent seasons, with the three “objectively better” clubs: Atlanta, NYCFC, and LAFC having the three lowest percentages and the three clubs that haven’t done as well leading up through the 2019 season; Minnesota, FC Cincinnati, and Orlando City, having the highest percentages. The third observation is that when excluding the recent expansion clubs and Chivas USA, the average percentage of drafted players to play more than 10 matches was 20.3%. These above observations help frame the picture that there is a very low yield of drafted players that end up playing significant minutes or matches for their clubs.
Next, we compare the players’ percentage of minutes played versus their Goals Added (g+), sorted by the club that drafted them. Figure 11 encompasses this analysis with each team sorted into their own graph on a 25-team grid. Two notes about this graph are first that the red dot in the graphs represents players that weren’t signed by the club that drafted them but were signed by a different MLS club and second, that the graph does not include players that were not signed by any clubs. The main takeaway from Figure 11 is that there are varying levels of success when looking at the Percentage of Minutes Played for each drafting club. The Goals Added(g+) for the players tends to stay relatively constant throughout all the Drafting Clubs. While there is some evidence of teams doing well in the SuperDraft there is other evidence of the unpredictability of draft picks.

This next section will look at the most recent rosters of MLS clubs and compare the performance of drafted versus non-drafted players. Figure 12 is comprised of the Goals Added (g+) of the players of all MLS clubs and is color-coded according to if they were a player selected in the MLS SuperDraft or not.

Some interesting observations can be made when looking at Figure 12. The first is that there are some high-performing drafted players, however, these individuals were traded from their drafting clubs, such as Tim Parker and Aaron Long. Second, the outliers are skewed in Figure 12 as there are players who have not played in a large number of matches yet have a high g+ Per 90. These players are easily identifiable by their percentage of minutes played along the x-axis. These numbers do not hold much weight when analyzing the overarching theme as their sample sizes are too small to accurately judge their contributions. Third, we notice that several teams have clusters of blue dots representing drafted players that don’t play many minutes. Finally, it is important to recognize that 105 of the 619 players that were on an MLS roster in 2019 were players selected in the SuperDraft and that 44 of those 105 players had a g+ Per 90 below the average of all draftees from 2013-2019.
To further analyze our findings, let’s investigate the idea that there is a correlation between Team Average PPG and Team g+ Per 90 versus where a team finishes overall in the MLS Regular Season. To do this we created a weight-based simulation to see how the Team PPG and the cumulative g+ Per 90 affected the outcome of games.

First, we took the PPG and g+ Per 90 that a player averaged throughout their history in Major League Soccer. We then created a simulation that randomly selected two teams to play one another and selected 11 players from each team, the only control variable included is that positionally only one goalkeeper could/had to be picked, otherwise, there was a random selection for all other positions. Next, the players on each team had their PPG and g+ Per 90 summed up for each team where it was rounded up to the nearest whole number. The whole numbers of each team were then added together, and a “draws coefficient” was added in.
For example if Atlanta United and Chicago Fire played each other; Atlanta’s starting 11 might have a PPG of 34 and Chicago might have a PPG of 29. Those two numbers were then added together to find the total, and then a coefficient of 27% was applied to that number to account for draws in the league. A coefficient of 27% is used because it represents the average number of draws in Major League Soccer over the time period researched in an article by the Washington Post’s Steve Goff. The simulation then took the total with the coefficient added and randomly selected a number out of the total PPGs/g+ Per 90s. Atlanta would be given the win if the numbers 1-34 were selected, Chicago would be given the win if the numbers 35 to 63 were selected, and if the numbers 64 to 73 were selected, it was recorded as a draw. This was repeated until all teams played 34 games keeping the control variable in place so they could not play a team more than three times. We ran the simulation to replicate 25 seasons’ worth of games, where each team played a total of 850 games with 34 games per season over a 25-season timeframe. The attached table above shows the results of the simulation. Over the course of the 850 games, replicating 25 seasons, the results of the simulation end up being similar to how the MLS standings ended the 2019 Regular Season. There is a standard deviation of approximately 4.3 showing the differentiation between the simulation results and the results of the 2019 regular season. Below in Figure 13 we can see some of the information listed above in graph form. The 2019 Finish for each club is what overall position the club finished in the 2019 regular season based on their accumulated points. PPG Sim Rank was calculated by the results of the simulation using PPG as the metric. g+ Sim Rank was calculated by taking the results of the simulation using g+ Per 90 as the metric. The g+ and PPG Average took the average of the g+ Ranking and PPG Ranking and assigned it a rank amongst the 24 MLS clubs.

In terms of looking at the results of the sim and seeing how they correlate to real life there are several findings to note. The first being is that the results immediately pass the eye test when looking at the upper limit of the 2019 season as the five lowest teams on the graph; Atlanta, LA Galaxy, LAFC, NYCFC, and Minnesota all finished in the top 8 of the 2019 Regular Season. Interestingly, the five teams highest on the graph; Colorado, Cincinnati, Houston, San Jose, and Vancouver finished in the bottom 8 of the 2019 regular season. While it is important to remember that correlation does not necessarily imply causation, it is nonetheless an interesting point for discussion or further research. All of this reaffirms the idea that only 9.2% of drafted players had a g+ Per 90 that was higher than the average g+ Per 90 of 0.16 for all drafted players. In part 3, we will analyze the previously mentioned trades that included MLS SuperDraft picks.