

Using Goals Added (g+) to Assess Dollar Value
/by Sean Steffen
One of the most interesting aspects of MLS, when compared to many other popular soccer leagues in the world, is that MLS operates under a salary cap. From a roster-building perspective, this has a tremendous impact on how players are valued. Consider the following thought experiment. Let’s say that we have two players who play the same position, have the same age and injury history, and have the exact skill level. For all intents and purposes, they are the same player. Now, let’s say that Player A has a much better agent than Player B and manages to get a contract with a team for 4 times the amount of money as player B.
In an uncapped league, if both players played the same number of minutes and had the same impact on the field, the fact that one is making so much more than the other should not have a significant impact on the team. In a capped league, however, the team that is paying 4x the amount of what the other team is paying is at a significant disadvantage because they now have less money available to spend on other players.
While the MLS salary cap is complicated by things like designated player spots and targeted allocation money which allows teams to spend over the cap in principle but not on the books, the concept of value in a capped system is still extremely important in this league, especially since these mechanisms are finite in nature. A team that spends lots of money on a DP or TAM player that isn’t producing is still at a disadvantage because they are using valuable, finite, assets such as DP spots and available TAM that could be better spent on a better-producing player. This is a stark contrast to uncapped leagues where teams can simply go out and get another high-dollar signing if their current high-dollar signing isn’t producing.
All of this is to say that, in MLS, from a scouting and roster-building perspective, assessing how much a player will impact your team is only part of the equation. How much you pay for that impact is equally important, if not more so.
But how do we do such a thing? As someone who has had multiple years of experience being involved in the scouting apparatus for an MLS team, I can tell you firsthand that it is not an easy task, nor is it an exact science. I do believe, however, that teams that invest in the resources to address these questions will be a lot better off in the long run than teams that do not. The science may not be exact, but, if done the right way, it is a science worth doing. And, as a former data analyst for an MLS team, it should come as no surprise that I feel that data should be a central part of this analysis.
So, how does one approach a task such as quantifying player value to salary? The biggest hurdle any analyst will face when attempting to address this is that, well, evaluating soccer players is really hard. We can look at metrics like expected goals and expected assists all we like, but questions such as how does this specific forward’s on-field impact compare to this specific defensive midfielder’s, are difficult because, talent aside, the positions contribute in such different ways, comparing requires a lot of data and brainpower.
Luckily, the fine brains here at ASA have used their massive brains to build a model that does exactly that: g+. You can read more about what g+ is here, but, essentially, it’s a metric that assesses how many goals a player is adding or subtracting from the team. And, as you can see in this article, the metric, while not perfect, is pretty good at it.
So good, in fact, that it provides the ideal framework for assessing MLS teams on their roster construction and spending. Let’s begin.
The first thing we need to do is come up with a way to assign value to a player. For this, we can simply look at how much g+ value a player is giving a team per $100,000 spent on his salary. For a quick look at this metric, here are the top 10 guys in 2020 in g+ per 100k.
| Team | Guaranteed Compensation | Goals Added | g+ per 100k | |
|---|---|---|---|---|
| HOU | $81,375 | 4.55 | 5.59 | |
| NYRB | $81,375 | 4.26 | 5.24 | |
| MTL | $81,375 | 4.25 | 5.22 | |
| NYRB | $63,547 | 3.03 | 4.77 | |
| ORL | $121,328 | 5.08 | 4.19 | |
| NYRB | $81,375 | 3.35 | 4.12 | |
| PHI | $103,309 | 4.23 | 4.09 | |
| NYRB | $85,190 | 3.13 | 3.67 | |
| RSL | $63,547 | 2.22 | 3.49 | |
| LAG | $81,375 | 2.84 | 3.49 |
Aside from the quick brag that the top guy was a signing my analysis played a role in, what jumps out here is that every player on this chart is on a low salary. This stands to reason, given the metric, but I’ll go into that in a moment. To explore things further, I divided the 2020 data into five Salary ranges.
| Range | |
|---|---|
| > 1.6 million | |
| 612k-1.6 million | |
| 400k-612k | |
| 200k-400k | |
| 0-200k |
Using this framework, I created the chart below to examine value per salary range. The below box and whisker chart shows the range of g+ per 100k value per salary category. Two things are worth noting about how the data is managed before we begin the analysis.
The first is that the salary bins are based off the guaranteed compensation of players released by the MLS Players Union for players in 2020 and the TAM and DP bins are based on league financial rules for DP and max tam range guys. MLS roster designations are, in actuality, a little more complicated than this, so our salary range bins should be viewed as rough guidelines for salary range and not definitive TAM and DP designations.
The second thing worth noting is that the DP bin is not calculated against guaranteed compensation, but rather, the DP charge on the cap. This decision was made because this article is most interested in cap management rather than owner spending, which is a subtle difference worth noting. While an owner might be interested if his 8 million dollar player is 8 million dollars good, from a cap perspective, it does not matter if that player is 3 million dollars or 8 million as the budget charge is the same, so judging players on their salary doesn’t, in that scenario, matter much in a cap construction mindset.

As we can see, the salary bin with the greatest ceiling is this lower salary category which we saw dominate the top 10 list above. This same salary group, however, also happens to carry with it the lowest floor, dipping well below 0, meaning that in many instances, players in this salary bin are giving the opposition teams a greater probability of scoring than their own team.
On the flip side, TAM players have the lowest scores in terms of value. This is not to say that TAM players are bad investments. On the contrary. Later in this article, we will see that some of the most successful teams in the league are the teams that are getting the most out of their TAM players. Their position, rather, is a reflection on what this metric is. Remember, g+ per 100k is not interested in who the best players are, but rather, the players who provide the most for the money, and it stands to reason that the best players are compensated the most fairly, hence the low value of TAM players.
The same principle would be true for DP players if we were calculating their value against compensation rather than their cap hit, and, in fact, my first attempt at this chart did not make such a distinction with DPs and they came out lower than TAM players.
Now that we have defended the good name of TAM, I think there is more to say about this chart at a macro level. Mainly, that there is a high consequence range in the low and medium salary bins. This suggests that, from a roster-building standpoint, these are the contracts that teams should focus on the most in terms of maximizing their salary budget.
Obviously, this is easier said than done, but, if we turn again to the list of guys on the top 10 chart, we can certainly see signs of investment paying off. For Maynor Figueroa, while I can’t reveal any details about the ins and outs of how that signing went down, suffice to say, his years in the league provided a lot of data to look at. Kyle Duncan, on the other hand, is a great example of a team utilizing their academy to cultivate value at low contract levels. Two different approaches, but two similar outcomes—optimized spends that free up money to be invested elsewhere.
Using this box chart framework, ASA’s own, Eliot McKinley, was kind of enough to take the data and create the following chart which examines how each team does in each salary bin compared to the league median.
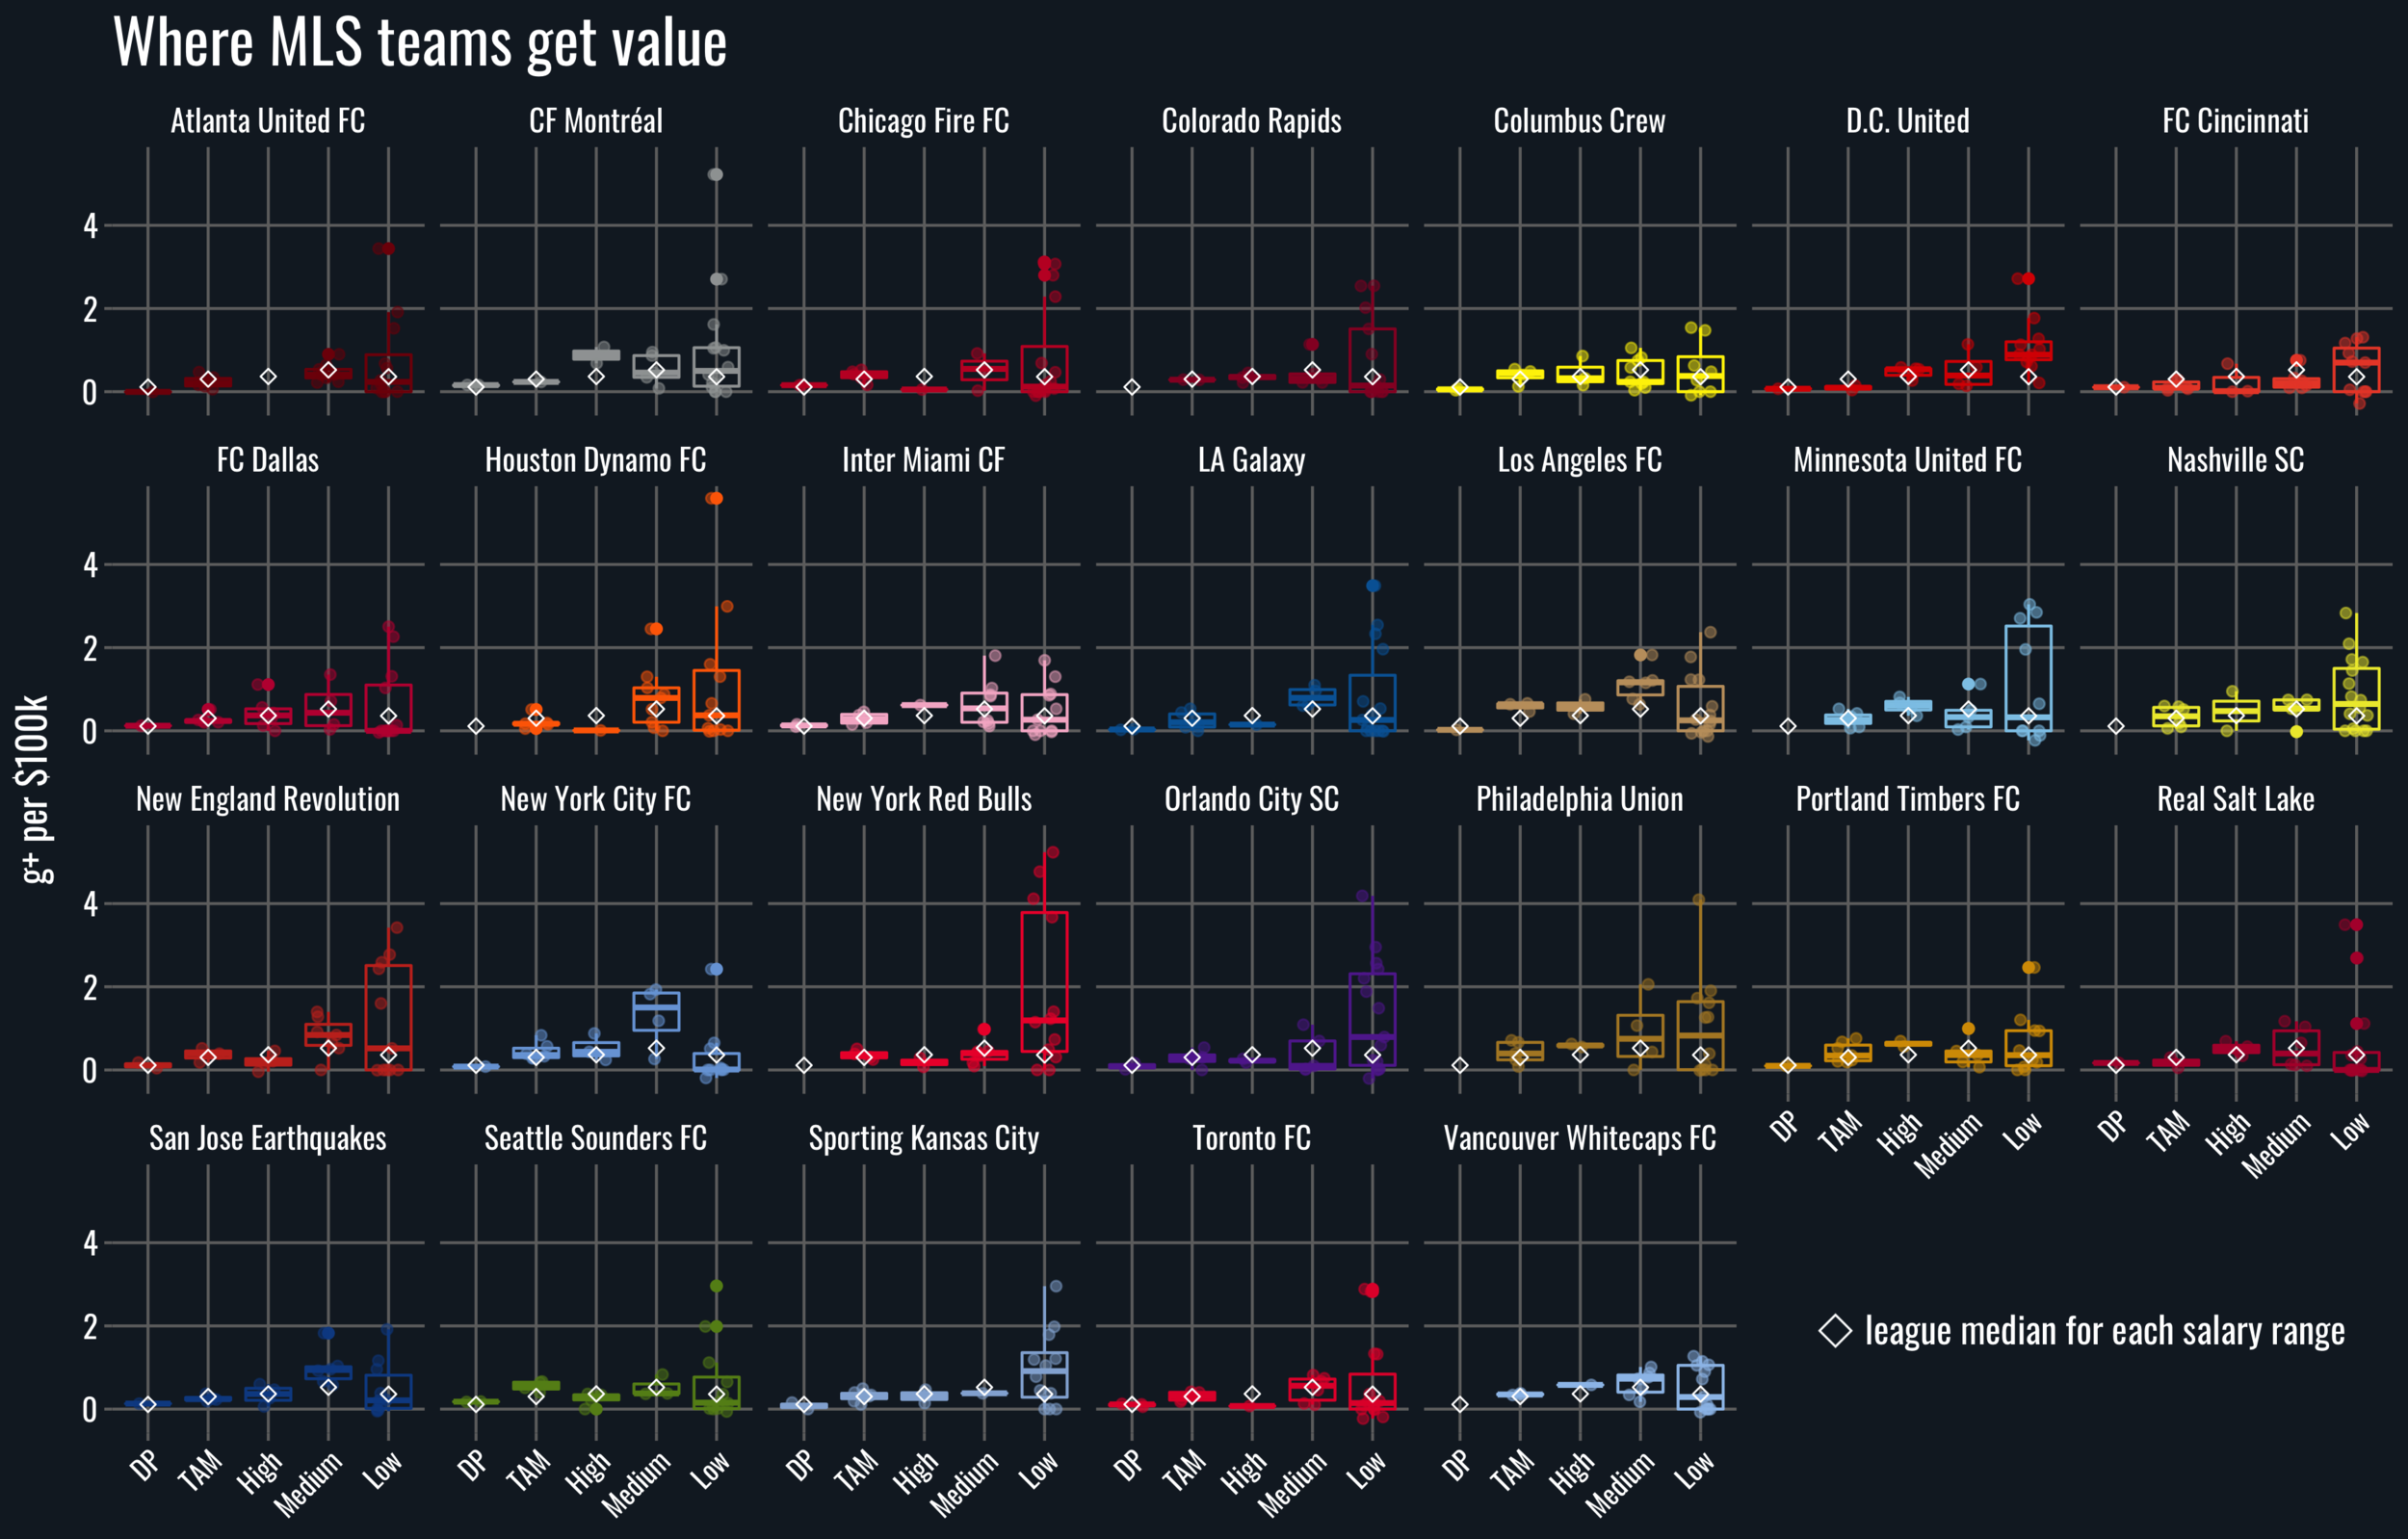
Here we can see how each team does in each category. To extend this analysis further, I’d like to go through each salary level in a little more detail.
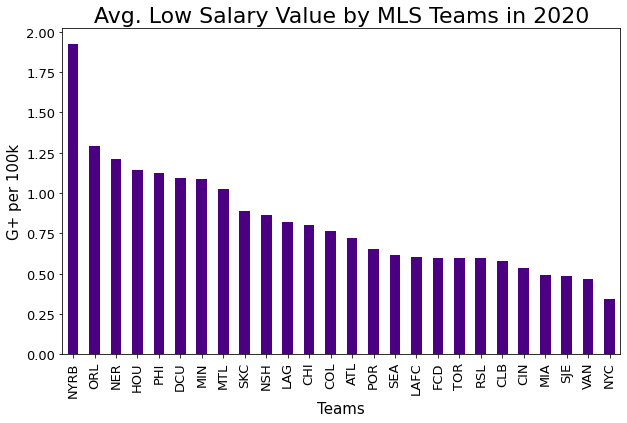
Low
Below is the list of the top g+ per 100k performers in our low salary range. You’ll notice that it’s the same list as the top performers in this category in the whole league which appeared above. This is no coincidence, as it’s the result of the ceiling for value on these contracts being so high. Finding guys that add around 4 to 5 goals to your team at sub 200k contracts frees up a ton of money to invest elsewhere. Obviously, these types of players do not grow on trees (although, many of them do grow in academies), but the right fit can give you well above average contribution at a salary so low, you are essentially opening up room to bring in a whole new player.
| Team | Guaranteed Compensation | Goals Added | g+ per 100k | |
|---|---|---|---|---|
| HOU | $81,375 | 4.55 | 5.59 | |
| NYRB | $81,375 | 4.26 | 5.24 | |
| MTL | $81,375 | 4.25 | 5.22 | |
| NYRB | $63,547 | 3.03 | 4.77 | |
| ORL | $121,328 | 5.08 | 4.19 | |
| NYRB | $81,375 | 3.35 | 4.12 | |
| PHI | $103,309 | 4.23 | 4.09 | |
| NYRB | $85,190 | 3.13 | 3.67 | |
| RSL | $63,547 | 2.22 | 3.49 | |
| LAG | $81,375 | 2.84 | 3.49 |
From a team perspective, no team in MLS came close to the Red Bulls when it came to the average g+ per 100k value they were getting from such contracts. It’s interesting that Dallas isn’t higher given their highly touted academy system, but, again, this is merely a look at a single year. A multi-year look at FCD would show they are doing very well in this category. But I’ll save such insights for another article.
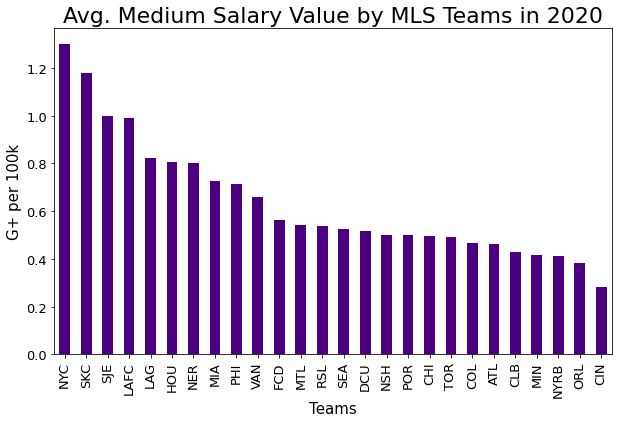
Medium
While the biggest gains in maximizing value appear to be in the low salary category, it’s worth noting that the median g+ per 100k value of players in the medium bin is higher than that of the lower bin. The low-salary group, after all, is composed of plenty of young players who are new to the league who may or may not even find their way into regular minutes. By comparison, the medium salary bin players are the guys that serve as the backbone of MLS teams—a sort of sturdy foundation on top of which the DPs and TAM level guys can work their magic. And, as you can see below, occasionally you can find guys like some on this list who can provide g+ value on par with the best TAM guys in the league, at a fraction of the price.
| Team | Guaranteed Compensation | Goals Added | g+ per 100k | |
|---|---|---|---|---|
| HOU | $210,843 | 5.17 | 2.45 | |
| PHI | $257,000 | 5.29 | 2.06 | |
| SKC | $200,000 | 3.96 | 1.98 | |
| NYC | $299,806 | 5.79 | 1.93 | |
| SJE | $215,125 | 3.93 | 1.83 | |
| LAFC | $239,000 | 4.36 | 1.82 | |
| NYC | $300,000 | 5.47 | 1.82 | |
| MIA | $331,250 | 5.99 | 1.81 | |
| NER | $282,038 | 3.94 | 1.40 | |
| FCD | $315,000 | 4.26 | 1.35 |
In this category, New York City shined, and, given that NYCFC was the top performer in the g+ model last year among MLS clubs, lends credence to the idea that finding value on these lower and mid-contracts is a key element to successful roster building.
High
It’s tempting to look at MLS salary lists and see guys making this kind of money and perceive these contracts as “bad”. When you compare the output to guys in the previous lists, there does appear to be some truth to this. While there is more value to be found in the previous two bins and more raw gains to be found in the TAM and DP bins, the players in the below list are not necessarily bad players. Given that roster construction is influenced by things such as availability, I am not at all prepared to say that there aren’t good buys to be had in this range. In fact, one could argue that, from a value standpoint, success in the previous two categories can free up enough money to go after proven guys in this category like Michel Barrios or Romell Quioto who can provide you 6 goals without having to spend any TAM.
| Team | Guaranteed Compensation | Goals Added | g+ per 100k | |
|---|---|---|---|---|
| FCD | $560,000 | 6.23 | 1.11 | |
| MTL | $559,833 | 6.02 | 1.08 | |
| NSH | $417,750 | 3.97 | 0.95 | |
| NYC | $470,000 | 4.13 | 0.88 | |
| CLB | $495,633 | 4.25 | 0.86 | |
| MIN | $571,250 | 4.66 | 0.82 | |
| LAFC | $411,750 | 3.12 | 0.76 | |
| POR | $516,250 | 3.58 | 0.69 | |
| RSL | $425,000 | 2.94 | 0.69 | |
| MTL | $429,312 | 2.93 | 0.68 |
Montreal was at the top of this category in terms of value on these contracts. While this may look like a sign of good investment at first glance, that perception changes if we view these high-budget charge contracts as a luxury earned by value gained in the previous categories. Perhaps this money could have been better spent in the previous categories. Compare this to Philadelphia or LAFC, who performed well in the low and medium salary range categories respectively, and one might argue their contracts in this high salary range are more justified, and, therefore, have better positioned their franchise for future success as a result.

Targeted Allocation Money
Below are the top 10 guys that fall within our TAM range. This is not to say that all of these guys are TAM players, but simply that they fall within this range in guaranteed compensation.
Once again, it is worth emphasizing that we are not saying that this is an order of the best players in this salary range. The model, for instance, has Jordan Morris adding 2.1 more goals to the Sounders in 2020 than Diego Chara did to the Timbers. In other words, the model rates Jordan Morris’ impact on the Sounders in 2020 as higher than that of Chara. Chara, however, cost the Timbers 451,350 dollars less, which, in theory, means more TAM available to be used on other players.
I am not, of course, trying to pick on Jordan Morris or the Sounders. The fact that he’s on this list means that the Sounders are getting very good production from Morris for the price.
A final note would be that MLS’s complex rules on how one can use TAM can complicate such comparisons. One can easily imagine a scenario where a higher g+ player is the better buy than a higher g+ per 100k player because the TAM you saved might not be enough to buy down a player that will exceed the goals added difference.
| Team | Guaranteed Compensation | Goals Added | g+ per 100k | |
|---|---|---|---|---|
| NYC | $650,000 | 5.42 | 0.83 | |
| POR | $668,750 | 5.07 | 0.76 | |
| PHI | $856,875 | 6.11 | 0.71 | |
| POR | $829,875 | 5.60 | 0.67 | |
| PHI | $698,500 | 4.63 | 0.66 | |
| SEA | $781,542 | 5.18 | 0.66 | |
| LAFC | $1,052,000 | 6.95 | 0.66 | |
| SEA | $1,120,100 | 7.17 | 0.64 | |
| LAFC | $618,000 | 3.95 | 0.64 | |
| NSH | $700,000 | 4.17 | 0.60 |
From a team perspective, the top performing teams in the league appear to be utilizing the TAM category quite well. New York City and Seattle finished first and second in the team g+ differential list in 2020, while Philly and LAFC were fourth and fifth.
If we once again turn our thinking to higher salary players being best utilized as a luxury earned by good spending, then the Philly and LAFC example from the previous category extends to this one. One can not say the same for Seattle, who are a curious case indeed, and one worth exploring, perhaps in a future article, who’s g+ value seems to be more top down.

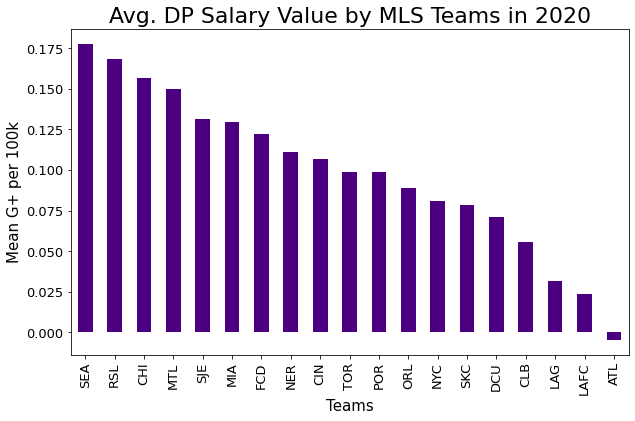
Designated Player
With the injuries of Vela and Martinez, 2020 was a bit of an odd year for designated players. Below are the top 5 performers in goals added, along with their g+ per 100k. Since all DPs in this model have the same cap hit, there is no difference between the raw g+ numbers and the value numbers, but I’ve included the value numbers as a point of comparison to earlier charts.
| Team | Goals Added | g+ per 100k | |
|---|---|---|---|
| TOR | $5.87 | 0.96 | |
| MIA | $5.26 | 0.86 | |
| SEA | $4.80 | 0.78 | |
| CHI | $4.22 | 0.69 | |
| ORL | $4.05 | 0.66 |
Again, Seattle is a curious case of success from value built from contracts on the top rather than throughout. Other than Seattle, however, the teams that got the most from their DPs didn’t fare too well. Obviously, this is exacerbated by the injuries of guys like Vela and Martinez, but a larger observation can be made here about roster construction as a whole.
If we once again think of the guys at the top as luxuries earned from good spending on lower contracts that create a solid foundation of value for these high dollar players to build on, it should come as no surprise that teams with good DP output but poor downstream value are generally not top of the table. Now compare this to a team like LAFC, who has been a consistent fixture in these lists, performing well in the medium, high, and tam ranges, and falling short in the DP range because their record-breaking MVP DP from the previous year was injured. In LAFC we can see a model of success built on extracting value on nearly every salary level.
Conclusions
As you can see, this simple framework can be quite powerful in examining roster construction within a capped structure. In fact, there are no doubt teams who are acutely aware of this fact and incorporate analysis in this vein to maximize expenditures within it.
In short, there is tremendous value in … well, value, and the top spending teams in the history of this league have not always been the best, as can be seen in this terrific interactive chart by Steve Fenn.
But what teams are maximizing their spending the best over multiple years? What positions offer the most value? Are there aspects of the g+ model that cost significantly less, constituting a major market inefficiency rife for exploitation? Why do fools fall in love?
Some of these questions will be addressed in future articles on the subject, some will be answered if an MLS team would like to hire me (I’m available), and one is a song from the American Graffiti soundtrack. I suppose you’ll have to stick around to find out which is which.