MLS Possession with Purpose Week 2: The best (and worst) performances

In case you missed it, I will be offering up a series of related articles throughout this season focusing on my Possession with Purpose analysis - a drive towards developing a simplified, yet systematic, statistically-based rating approach on Strategic Team performance (both attacking, defending and cumulative) in executing the Six Steps of PWP. Part of this effort also includes highlighting individual players who have had a significant role in how a team performed that week. I don't claim to say that 'the player' selected is the best player on the team but it is intended to show how one players' activities help influence a team outcome. If you haven't read the introduction and explanations to PWP click here for more details.

For this week my article focuses strictly on team performance for Week 2; an additional article may be offered up later this week that covers the cumulative PWP Indices for the first two weeks; if I get it posted I'll paste a link here.

The top PWP Strategic Attacking team for week 2 was Real Salt Lake; that may come as a bit of a surprise given some other outcomes this past week - more later on that; but a good thing to remember is that high strategic ratings for RSL are not unusual given their penchant for possession and some pretty good goal scoring ratios based off shots taken and shots on goal.

PWP STRATEGIC ATTACKING INDEX WEEK 2 2014

Here's the breakout on how they performed in each of the six steps of PWP:

REAL SALT LAKE PWP STRATEGIC ATTACKING PROCESS WEEK 2 2014

The RSL Attacking Team Player of the week is Joao Plata; here are some highlighted individual statistics that helped influence team performance...

REAL SALT LAKE PWP INDIVIDUAL ATTACKER OF THE WEEK 2 2014

The bottom feeder in Strategic attack this week was the Montreal Impact (1.9808).   Some internal key indicators used to develop that rating included being 5th lowest in Total Passes (389); 5th lowest in Passing Accuracy at ~69%; 8th lowest in Passes within their Attacking Third; 10th highest # of Passes completed in the Final Third (62); 5th best with 16 Shots Taken with 5 Shots on Goal (tied for 6th best) yet no goals scored.

Other teams were less productive in some cases but the summation of all those indicators pointed to Montreal as being the least effective and efficient as a Team in Attack.

Now how about Jermaine Defoe and Toronto FC?  He had two goals in a blinding win for the Reds visiting Seattle.   Is there a reason why Toronto didn't get the best PWP Attacking team this week? A good question, and here's why they missed out.

Recall from last year that one of the top attacking teams in MLS was Vancouver - yet on the defending side they were not quite so fortunate.   Also note that both Chicago and Dallas also had on average (and in total) more goals scored than 3 other teams making the Playoffs.

In reviewing the intent of PWP; it's not intended to mirror outputs that directly match goals scored; if it was then the PWP Composite Index for last year would have been 70% accurate as opposed to 90% accurate.   For now let's just say that Toronto did a great job in taking 3 points in Seattle - it's a long season with many games yet to be played.   So the analysis doesn't snub Toronto - it simply attempts to better recognize that Real Salt Lake had a more comprehensive team attack than Toronto.

Unlike last week, the top Defending team performance did not come from the top attacking team; recall RSL gave up 3 goals-against in their draw with San Jose.

The top Defending team this past week were the Houston Dynamo.  Given Montreal were the bottom feeder in Attack it only makes sense that the most effective and efficient team in Defense... was... Houston; part of that rests with an impotent attack by Montreal but part of it also rests with a very active defending team unit of Houston.

It should be noted that last week Houston were number two in attack and defense; and while they only scored one goal this week they did, like last week, come away with a clean sheet.  Is this an early sign the the Dynamo are indeed a force to be reckoned with in the East?

Here's how they compared to all other teams in Week 2:

PWP STRATEGIC DEFENDING INDEX OF THE WEEK 2 2104

Here's their Defending percentages for the six steps of the PWP Strategic Defending Process:

HOUSTON DYNAMO PWP STRATEGIC DEFENDING PROCESS OF THE WEEK 2 2104

And the PWP Defending Player of the Week award goes to Corey Ashe:

HOUSTON DYNAMO PWP INDIVIDUAL DEFENDING PLAYER OF THE WEEK 2 2014

Some could offer that David Horst or another defender might have nailed this award - for me the number of touches and passing accuracy speak to a comprehensive impact in the game and while David did great job in the box; especially with clearances I felt and thought Corey Ashe played the most comprehensive game on both sides of the pitch.

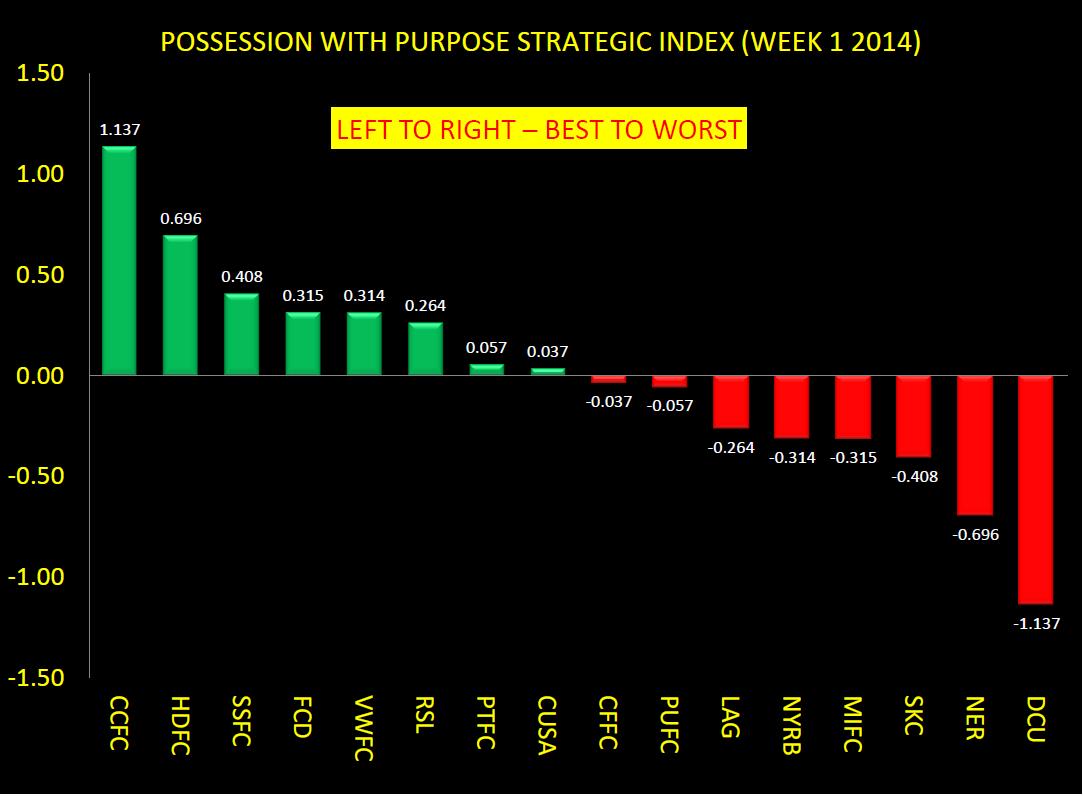
Finally, before offering up some additional observations, here's the complete picture on the PWP Composite Strategic Index for Week 2:

PWP COMPOSITE STRATEGIC INDEX FOR WEEK 2 2104

Observations:

A interesting output is how well Toronto showed against other teams this week; they took three points in their away match to Seattle yet fell below zero in their cumulative total.   Part of that outcome has much to do with their on-field strategy - play the counter and allow Seattle the better part of possession in hopes of capitalizing on mistakes to generate goals.

In looking at the Seattle statistical indicators for that game they were obnoxiously potent in posssession, passing, and penetration (like some others team so far this year) but simply couldn't put quality shots on goal or another goal past Cesar.

All told Seattle offered up 643 passes {HUGE} (this includes crosses, throw-ins, etc where the intent is to move the ball from one player to another), a 79% passing accuracy with 68% possession, 61% passing accuracy within the Attacking Third, (95 passes successfully completed), yet they only tallied 13 shots taken with just 2 of them on goal.   Seattle controlled the game only up to the point of setting the stage for shots and shots on goal - two of the most critical steps in Possession with Purpose.

As the year unfolds the counter-attacking style of Toronto, and others, while ceding possession, may be much more clear and additional tendencies should pop up to validate other teams taking this approach.  For now I'll call it an outlier but don't expect it to be an outlier later this year as more patterns develop.

Like last year, Portland is finding itself near the top in overall PWP.   As noted in my match analysis there is a potential weakness with Portland this year in telegraphing shots.  With 35 total shots taken this year 17 of them have been blocked before reaching the keeper - a trend to continue to watch for sure!

FC Dallas now have Pareja running the team and, if his team performs like the Rapids did last year, it is likely we continue to see them in the top half of the Index .  Last year Dallas faltered around the midway point and a good indicator then was a drop in defensive performance.  Should be interesting to see if that drop-off manifests itself after week 17 or so if there attack continues to stay aggressive.

Philadelphia have added Edu this year and their attack is considerably different given a more possession based approach - Jared Young offered last week that Okugu provided some very solid defensive play against Portland - we'll be sure to watch how he and Edu and others look to improve the Union results this year.

All for now; you can follow me on twitter @chrisgluckpwp

Best, Chris

MLS Possession with Purpose Week 1: The best (and worst) performances

Greetings one and all as the new season begins in MLS. In case you missed it I published an article on here not to long ago that dives into my Possession with Purpose Indices to include a general introduction on what it is and means as well as some explanations behind the Indices. If you haven't gone through the article before or if you need a refresh click here.

Here's how the teams fared, compared to each other, in Possession with Purpose Week #1:

POSSESSION WITH PURPOSE STRATEGIC COMPOSITE INDEX WEEK 1 RESULTS

Observations:

This Index is not influenced by previous season results; it's a new year and a fresh/clean slate for teams to build from as they all challenge each other to make the Playoffs. So all you supporters of teams that didn't do so well this past year - fahgetaboutit!

Next thing to consider is that positive numbers indicate the team performed better in attack and defense than their opponent - in looking at the diagram note that Columbus is at the far left while their opponent is on the far right.  As the season unfolds these overall positions should change.  As noted Columbus had the best overall attack compared to all other teams this past week; here are their percentages in the six steps of PWP:

BEST PWP RESULTS FOR WEEK 1 IN MLS - COLUMBUS CREW

Another top performer was Houston - some consider, last year, they were a sleeping giant that simply didn't wake up in time for a solid Playoff run - I do - in their first game this year they burst the flood gates with 4 goals and some solid and superb defense led by a guy I absolutely hated to see leave Portland - David Horst.

Some may gaffaw at this but this time last year - before his injury - I thought David had a superb chance to get a wee bit stuck in (some minutes) on some USMNT training like Michael Harrington did this off-season.

I still think David has great pedigree as a stand-up defender with great timing and good vision to see gaps and create gaps. So if you are a Houston supporter know that I have a special interest in seeing David do great things.

As for reading the diagram - there's a note there to read it from left to right (best to worst). The composite Index is the difference between the team Attacking PWP Index and the team Defending PWP Index. The overall total represents the ratios of success each team had in performing the six basic steps, possession, passing accuracy, penetration, creation, targeting, and scoring a goal. It's not perfect but last year it was very representative.

Before getting to the other PWP Indices...

This is the first week and like most things that are measured, to begin with, there may be wide variation in the first 10 or so samples analyzed - so like last year Chivas began with a good start.

Does that continue or do we see them tail off - likewise - DC United ended the season near bottom in almost every single PWP category - so far they are right where they left off. Will time show that Eddie Johnson was a good purchase - we'll see.

As for the leaders from last year like Real Salt Lake, Sporting KC and Portland. It's no secret now that RSL opened up with a solid three points away to LA Galaxy - is it rude to expect that Robbie Keane will miss another penalty shot this year?

How about that torrential downpour in Portland - rain is not unusual for that part of the country - does it rain a bit more on the Timbers this season or will the sun begin to shine as Fernandez, Valeri, Nagbe, Urutti and others really get there gears engaged with what many feel and think might be the most potent attacking system/scheme/player personnel package in the league?

In considering what Sporting KC has on their plate early in the season, 5 games in the course of 15 days I think - is it too much to expect that they will show early indication of dominance again?

In looking at the PWP Attacking Index here's how those teams rated:

PWP STRATEGIC ATTACKING INDEX WEEK 1 2014

Observations:

It's no secret that goals scored will heavily influence the outcome of a game - that's to be expected - so those teams that scored a brace or more of goals this early in the season will rate higher than some that didn't score as many goals.

Another new feature this year will be a PWP Attacking and Defending Player of the Week - where some key individual statistics are highlighted that helped influence overall team performance.

For this past week the PWP Attacking Player of the Week is Federico Higuain.

PWP ATTACKER OF THE WEEK #1 2014

In looking at the PWP Defending Index here's how the teams fared:

PWP STRATEGIC DEFENDING INDEX WEEK 1 2014

Observations:

Since this is the first week the top defending team also happens to be the top attacking team.

For each specific week (not cummulative) this will be the case - for me there is nothing wrong with that - it takes a solid defense to win games as well.

At the end of the season there might be a pattern on who's the top performer, week to week, that is influencing the outcomes of team performances better than others; we'll see.

For this past week the PWP Defending Player of the Week is Michael Parkhurst.

PWP DEFENDER OF THE WEEK #1 2014

In closing...

As the season progresses (right around week 15 or so) I'd offer that the PWP Strategic Composite Index should help paint a picture/expectation on what teams are working towards making the Playoffs and what teams are the doormats.

By week 17 last year this Index had accurately predicted 8 of the top 10 teams to make the Playoffs and by seasons end this Index had offered up 9 of the top 10 teams to make the MLS Playoffs; exceeding, in accuracy/prediction both the Squawka.com and Whoscored.com Indices - hopefully that level of predictability shows up again this year.

A couple of housekeeping things - my first and foremost source for data remains, like last year, the MLS Chalkboard developed and provided by Opta. Second - as the year continues I will attempt to peel back some more detail on 'defending' by teams in the final third.

Not sure how that will go but know that in a few weeks time I should be able to offer some additional team defending performance indicators for all MLS teams...

All the best, Chris

Possession with Purpose: an introduction and some explanations

Please welcome to our little team of analysists and helpers Chris Gluck, whose PWP is going to be added to the metrics table this year---a solid instrument in telling us how teams have performed in turning possession into goals. Currently it's one of the best open-source metrics out there to tell us such things. I hope you'll enjoy his contributions as much I will - Harrison First things first --- my thanks to Harrison Crow and Matthias Kullowatz for the opportunity to post my Possession with Purpose Introduction on American Soccer Analysis.

If you’ve been following me this past year through Columbian Newspaper--out of southern Washington--you’ll know that I’ve been researching statistics in Major League Soccer. My intent has been to develop a simplified (Strategic) set of team performance indicators that may help others better understand soccer and how the outcome of a game may be better understood based on the primary inputs to the game.

Data for my research comes from documenting and analyzing all 646 MLS Regular Season games in 2013; the source data originates with OPTA and is displayed on the MLS Chalkboard and the MLS Statistics Sheet found through www.mlssoccer.com.

With that here’s my introduction on Possession with Purpose…

To first understand the context, I offer that this is one of the End States of my effort: create a simplified approach and documented method for measuring team performance where the output is an Index that (while excluding points) comes close to matching results in the MLS League Table.

Beginning with that End State in mind here is the End State product:

pic1

Observations from the Diagram…

Note that 9 of the top 10 teams in this Index made the MLS Playoffs last year with the Houston Dynamo finishing 12th in the Index.

For comparison, in benchmarking whoscored.com their Index only had 8 of their top 10 teams make the Playoffs, while www.squawka .com matched my 90% success rating, but the team they missed in the top 10 (New England) finished 16th in their Index.

From a strategic standpoint, the End State objective has been met; create a simplified approach and documented method for measuring team performance where the output is an Index that (while excluding points) comes close to matching results in the MLS League Table.

Defining the PWP Attacking and Defending Processes…

Here are the six steps in the PWP Strategic Attacking Process:

  1. Gain possession of the ball,
  2. Retain possession and move the ball,
  3. Penetrate & create goal scoring opportunities,
  4. Take shots when provided goal scoring opportunities,
  5. Put those shots taken on goal,
  6. Score the goal.

Here are the six steps in the PWP Strategic Defending Process:

  1. Minimize opponent gaining possession of the ball,
  2. Minimize opponent retaining possession and moving the ball,
  3. Minimize opponent penetrating and creating goal scoring opportunities,
  4. Minimize opponent taking shots when provided goal scoring opportunities,
  5. Minimize opponent putting those shots on goal,
  6. Minimize opponent scoring the goal.

Every step is this process has an average success rate (percentage) based upon data gathered from all 646 MLS Regular Season games.

Understanding the context of these steps versus other conditions and activities that influence the outcome of a game…

In case you missed it I call these Processes and the Indices “Strategic” to separate their value/meaning relative to other things that can influence the outcome of a game.

For me I have two other ways to classify information that can influence the outcomes in those steps. I have Operational conditions and Tactical metrics; provided below are some examples of each:

  • Operational conditions: Scheme of maneuver a team uses in setting up their system, such as flat-back four, flat-back three, double-pivot midfield, single-pivot midfield, bunkering with counterattacking, pressing high, direct attacking, possession-oriented attacking, weather conditions, location of the game (home/away), conference foe, non-conference foe, etc…
  • Tactical metrics: Locations of shots taken, shots on goal, and goals scored; penalty kicks, free kicks, crosses, headers won/lost, tackles won/lost, interceptions, clearances, blocked crosses, blocked shots, etc.

The diagram below shows the PWP Strategic Attacking Process with the average percentage of success rate in MLS for 2013. A more detailed explanation of each step is provided below the diagram.

pic2

Step 1: Gain possession of the ball: The intent behind this basic step should be clear; you can’t win the game if you don’t possess the ball to some extent. A second consideration about this step is that the more you possess the ball the less your opponent possesses the ball.

  • From a defensive standpoint there are any number of ways a team can work to gain possession of the ball; they include, but are not limited to, tackling, intercepting, clearing the ball, winning fifty-fifty duels on the ground or in the air, or simply gathering a loose ball based upon a deflection or bad pass.
  • For this Process the measurement of success is the percentage of possession a team has in a given game; note that in Soccer, the primary method for measuring possession is to add up the number of passes made in a game and divide into that the amount of passes one team makes (create a ratio percentage of possession); the opposing team has the difference between 100% and the percentage of possession that the other team has.
  • It’s not perfect but it provides a simplified ratio to compare one team versus another…

Step 2: Retain possession and move the ball: It shouldn’t be a secret to many that in most cases the team possessing the ball will need to move the ball in order to penetrate the opponents Defending Third and score a goal.

  • This is not to say a team has a minimum number of passes they need to complete to score a goal; for teams winning possession deep in the opponents Defending Third there may be times where the only thing needed is a quick shot on goal.
  • By and large, however, most teams – when they gain possession of the ball – do so in their own Defending Third and then move the ball (eventually forward) in a position where a teammate can create a goal scoring opportunity for another team member to take a shot.
  • For this process, the measurement of success is the team's passing accuracy percentage across the entire pitch; passes completed divided into passes attempted.
  • It’s not perfect, but it provides a simplified ratio to compare one team versus another; statistically speaking there are weaknesses in how this percentage is measured by the big data folks.
    • Throw-ins, for example, move the ball across the pitch from one player to another yet they are not officially counted as passes.
    • Successful crosses are also not counted as a successful pass even though the ball moves successfully from one player to another.
    • Oddly enough, when evaluating the data provided on the MLS chalkboard, an Unsuccessful cross is included as a Pass attempted (?!)
    • For the purposes of this analysis I had to count all successful crosses as successful passes; therefore my final pass completions totals will be slightly higher than what Opta provides. It is what it is…
  • I should also point out here that there are occasions when a team wins possession of the ball and takes a shot where no pass was completed. Like I said, this measurement method is not perfect but it is ‘equal’ in ignoring that exception for all teams.
  • Therefore the measurement itself has value in tracking the majority (bell curve) of activities that normally occur in a game of soccer. And as a reminder, these are Strategic steps in PWP; by definition a Strategic step will not measure to a level of granularity; that is where Tactical metrics come into play based upon an Operational condition where the team is applying pressure higher up the pitch.

Step 3: Penetrate and create goal scoring opportunities: Most know that a pitch is divided into three parts; the Defending Third, Middle Third, and Attacking Third. For the purposes of this effort, Penetration is associated with entering the opponent’s Defending Third with the intent to score.

  • For this Process, penetration is measured by dividing the volume of passes a team completes within the opponent’s Defending Third into the volume of passes a team completes across the entire pitch.
  • It’s not perfect but it creates a ratio that treats all teams fairly, and given the overall accuracy of the End State Index (90%), it’s a reasonable way to measure this step.
  • In order to measure this step I first had to manually filter, for all 646 games, every pass attempted and completed using the MLS Chalkboard; my thanks to MLS and OPTA for providing us ‘stats’ guys the opportunity to do that. With Golazo stats now available, that task will be easier next year. As a stats guy, it would have been inappropriate to switch measurement methods ¾’s of the way through the year.

Step 4: Take shots when provided goal scoring opportunities: This is, by far, the hardest indicator to measure, given how current data sites really lack granularity in how they identify/define ‘created goal scoring opportunities.'

  • I define a ‘created goal scoring opportunity’ as any pass, successful or not, that may have ended with another teammate taking a shot. That’s hard to quantify, but an example, if you will:
    • A fullback overlapping down the right side puts in a wicked cross that gets cleared at the last minute by a center-back, with his head. With OPTA and other data companies that wicked cross, though unsuccessful, is not quantified as a goal scoring opportunity created; it’s merely tracked as a clearance and an unsuccessful pass.
    • I disagree; the fullback did their job in putting in that wicked cross – what really happened is the defender also did their job in clearing it – therefore a “potential” for the attacking team to complete a created goal scoring opportuinty and take a shot was denied.
    • Both the attacking team and defending team should be statistically credited for doing what they are expected to do. Others may disagree…
    • But as a Head Coach, I would put to memory that the fullback did what was supposed to happen; create the chance – therefore in my books that player created a goal scoring opportunity.
  • For this Process, the step is measured by counting the number of Shots Taken compared to the number of completed passes in the opponent’s Defending Third.
  • It’s not perfect, but it’s measured in an unbiased manner for every team, and there will be instances where a shot can be taken without a completed pass or originate from a defensive error.
  • In going back to the example, as a Head Coach I would call that effort a “failed assist.” I think there is value in knowing the number of “failed assists” as much as there is in knowing “assists.”
  • By tracking “failed assists” it provides a pure, statistical way, to track individual player performance (tactical metric) that can influence team performance.
  • Bottom line on this one, as contentious as it may be for some, recall the End State of this Final Index… create a simplified approach and documented method for measuring team performance where the output is an Index that (while excluding points) comes close to matching results in the MLS League Table.
  • Given the accuracy rating of 90% in matching the top 10 Playoff teams this year I feel and think the approach to measure this indicator works.
  • If OPTA, or another data compilation agency starts to track “failed assists”, could an Index like this reach 100% accuracy?

Step 5: Put those Shots Taken on Goal: For the most part this is an individual statistic that is added up to create a team performance indicator.

  • For this process, the step is measured by dividing the number of Shots on Goal by the number of Shots Taken.
  • It’s one of the easier indicators to measure, and if you watch any level of soccer, it's pretty self explanatory – if the Shot can come anywhere within the dimensions of the Goal, it is considered a Shot on Goal. One of two things happens; it goes in or it doesn’t.

Step 6: Score the Goal: One critical objective of the game.

  • I say ‘one’ because indications, I see, lead me to offer that this game is not all about scoring goals.
  • In my research it appears to me that teams who defend better seem to take more points in games than teams that don’t defend very well.
  • A recent example in my End of Season analysis of Vancouver: in Western Conference competition, they scored 35 goals and gave up 35 goals; all told they took just 26 of 72 possible points – clearly, in this example, scoring goals did not result in wins…
  • Prozone, a noted professional sporting analysis company, offers the following in the article: “Using data from the last ten seasons of the Premier League, Anderson and Sally compared the value of a goal scored and the value of a goal conceded. They found that scoring a goal, on average, is worth slightly more than one point, whereas not conceding produces, on average, 2.5 points per match. Goals that don’t happen are more valuable than goals that do happen.”

In closing…

  • It’s not perfect, but it provides reasonable information in a reasonable format that has reasonable value when comparing the End State output to how the MLS League Table finished.
  • For those interested the PWP Strategic Attacking Index and Defending Index are provided below:

pic3

PWP STRATEGIC DEFENDING INDEX END OF 2013

  • In looking at these two Indices, note the number on the left; the difference between the Index number in the Attacking Index and the Defending Index is the number that appears to the left in the Final Strategic Index at the beginning of this article.
  • That may help explain why some teams finished above zero, as opposed to below zero in the Final Index.
  • Teams finishing above zero had team attacking percentages that exceeded their team defending percentages; in other words they were better in their attack against the opponents than the opponent’s were in attacking them.
  • Team success rates in these six steps will be used next year to begin to analyze how well the team is performing as the new season starts compared to performance the previous year.

Follow Chris on twitter at https://twitter.com/ChrisGluckPTFC, and keep up with his PWP metric all season!