Postseason Preview: Real Salt Lake

Postseason Preview: Real Salt Lake

After an encouraging 2017 featuring the emergence of a handful of exciting young talent, Real Salt Lake seemed poised to take a step forward in 2018. Technically they did, by making the playoffs on the last day of the regular season, courtesy of an epic collapse from the LA Galaxy. RSL found themselves in that precarious position thanks to a lot of inconsistency. The team’s stretch run, for example, featured a 6-2 dismantling of the Galaxy followed by a home draw to Minnesota, and a 1-1 tie at Kansas City (maybe RSL’s best performance of the year given the context) followed by two blowout losses to Portland. Those painful ups and downs are what happens when you build a team on still-developing stars - it’s just a part of the process. Here it is in graphical form, with their 4-game rolling xGD:

Read More

Ranking the Wingers

We’re all here because someone on Twitter started a discussion pertaining to ranking MLS wingers. I’m certain that my rankings won’t satisfactorally answer that question to everybody’s liking, but hopefully it adds something useful to the conversation. First of all, let’s establish some rules.

1)    The definition of a winger for this context is going to be super vague. Essentially a wide player lined up in the midfield according to the team lineup provided at the start of a match. Argue that however you wish. This just seems easiest.

2)    The player has to have played 500 minutes in the position his season. We’re not doing this “well--he’s been a winger in the past” or “he’s been really good when played out on the wing in a few games”. I’m not playing this game. It’s 500 minutes, meet it or beat it.

3)    If you’ve met the criteria above you get a mention in this.

4)    I’m going to provide some data with these thoughts. That will of course come from American Soccer Analysis. I could have broken things down far enough to where we only consider the advanced metrics, but we have to draw the line somewhere so we’re using numbers agnostic of the position played.

5)    Look. This is a rankings list. We’re not going to agree on all of these. It’s perfectly reasonable for you to think that I am in fact, wrong. That is fine. I might be.

Let’s get on with it.

Read More

The Art of a Free Kick and How To Giovinco

The Art of a Free Kick and How To Giovinco

Sebastian Giovinco’s free kick prowess is well documented, but what if your team is not blessed with a formica atomica to bang in 13 direct free kick goals over the last 3 seasons? How do MLS teams score, or not, from free kicks?

From 2015-2017, 12,728 free kicks were taken in MLS play in the attacking half, resulting in 272 goals. Free kicks can be taken a number of ways, a direct shot on goal, a cross into the box, speculative long balls, through balls, or quick restarts, among others. The type of free kick restart is generally dictated by the position it is taken from. If a free kick is given close to goal, in the center of the field, a team will generally take a direct shot on goal (zone 14; 57.0% shots). Free kicks close to the goalline, but near the touchlines are most likely crosses (zones 13, 15, 16, 18; 57.1% crosses). Free kicks farther away from goal are almost always some other form of restart than a direct shot or cross (zones 10-12; 95.1%).

Read More

Real Salt Lake 2018 Season Preview

Real Salt Lake 2018 Season Preview

The last 24 months for Real Salt Lake have been quite the saga. A solid CCL run in early 2016 ended in the semifinals against Tigres, which was followed by a disappointing 2016 season. That was followed by terrible start the 2017 season, but then led to an inprobable late run at the playoffs.

Gone are the years of peak Kyle Beckerman and Nick Rimando with a magnificent Javier Moralez leading a jewel of an attack. But here again are the days of a potent Real Salt Lake built upon a staunch defense force and skilled playmakers. Much of the cast has changed, but the style has been reborn.

Read More

The 22 Stats that Explain the MLS Season so far

The 22 Stats that Explain the MLS Season so far

We’re a bit more than a month into the 2017 season. While that’s way too early to say anything definitive, it’s probably enough time to get a feel for where teams stand. Here are 22 stats (one per team), that explain something of each team’s season so far.

Eastern Conference

Columbus: $642,500 - combined guaranteed compensation due Ola Kamara and Justin Meram (as of September 2016’s salary release) 

For the money (equal to roughly one Nocerino), Kamara and Meram are the best attacking partnership in the league. Meram has looked good both out wide and in the middle, which bodes well for the Crew as Federico Higuain hits the wrong side of the age curve. And Ola Kamara has picked up exactly where he left off last year, with 3 goals in his first six games. 

Read More

Real Salt Lake 2017 Season Preview

Real Salt Lake 2017 Season Preview

After not making the post-season for the first time since 2007 in 2015, RSL made small improvements to sneak into the playoffs in the 6th and final playoff position. The return of striker Yura Movsisyan to Utah brought high hopes that RSL could relieve some of the offensive burden that was placed upon Joao Plata after Alvaro Saborio's departure after the 2015 season. Movsisyan's nine goals were respectable, but certainly not enough to recapture his 2009 form (his last stint in RSL) where he managed 0.42 goals per 90. His 2016 returns were a paltry 0.37 G/90. 

Plata still carried the bulk of the offense, nearly pulling a double-double in goals and assists (9 goals, 12 assists) and took the bulk of RSL's shots. However, his returns were even worse than Movsisyan's as Plata only managed 0.32 G/09 when compared to his breakout season in 2014 of 0.59 G/90.

Read More

2016 ASA PREVIEW: REAL SALT LAKE

The abysmal 2015 season for RSL was predicated on the failure to adapt to a new formation and lack of offensive depth. In Jeff Cassar's second season in charge of RSL, the team managed to compile anemic attacking numbers. Transitioning from a 4-4-2 diamond formation that seemingly defined RSL through the Jason Kreis era, the new shape exposed some players that were previously pivotal components to RSL's consistent success in the past.

Both Kyle Beckerman and Joao Plata were sluggish to figure out how to thrive in a new shape and struggled with their new identity, but for different reasons. As Beckerman ages, the expectation is that his motor will slow, his poor first step and general quickness will get even worse, but his game IQ and game management skills will improve. The issue with the attempted 4-3-3 shape is that the single, central midfielder is burdened with a more intense physical workload because of the vertical space that is now only occupied in front by the central forward in the middle channel. Beckerman struggled with the spatial requirements, his significant numbers have been declining for the past three seasons, and was ultimately exposed in the middle of the park.

Set for another terrorizing season in the final third, Plata came back from being injured during the beginning of the season and never found his feet in the new spacing. Although he seemed to thrive in open space, the lack of connection and compactness saw him struggling on isolated islands through many of his appearances.

Our projections for 2016 after the jump.

Read More

MLS Possession with Purpose Week 2: The best (and worst) performances

In case you missed it, I will be offering up a series of related articles throughout this season focusing on my Possession with Purpose analysis - a drive towards developing a simplified, yet systematic, statistically-based rating approach on Strategic Team performance (both attacking, defending and cumulative) in executing the Six Steps of PWP. Part of this effort also includes highlighting individual players who have had a significant role in how a team performed that week. I don't claim to say that 'the player' selected is the best player on the team but it is intended to show how one players' activities help influence a team outcome. If you haven't read the introduction and explanations to PWP click here for more details.

For this week my article focuses strictly on team performance for Week 2; an additional article may be offered up later this week that covers the cumulative PWP Indices for the first two weeks; if I get it posted I'll paste a link here.

The top PWP Strategic Attacking team for week 2 was Real Salt Lake; that may come as a bit of a surprise given some other outcomes this past week - more later on that; but a good thing to remember is that high strategic ratings for RSL are not unusual given their penchant for possession and some pretty good goal scoring ratios based off shots taken and shots on goal.
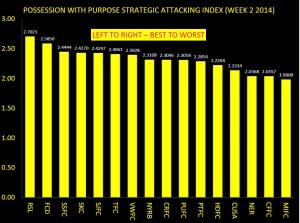
PWP STRATEGIC ATTACKING INDEX WEEK 2 2014

Here's the breakout on how they performed in each of the six steps of PWP:
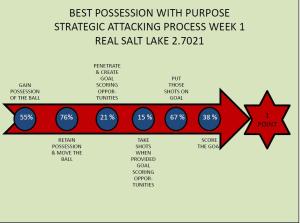
REAL SALT LAKE PWP STRATEGIC ATTACKING PROCESS WEEK 2 2014

The RSL Attacking Team Player of the week is Joao Plata; here are some highlighted individual statistics that helped influence team performance...
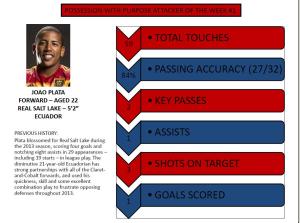
REAL SALT LAKE PWP INDIVIDUAL ATTACKER OF THE WEEK 2 2014

The bottom feeder in Strategic attack this week was the Montreal Impact (1.9808).   Some internal key indicators used to develop that rating included being 5th lowest in Total Passes (389); 5th lowest in Passing Accuracy at ~69%; 8th lowest in Passes within their Attacking Third; 10th highest # of Passes completed in the Final Third (62); 5th best with 16 Shots Taken with 5 Shots on Goal (tied for 6th best) yet no goals scored.

Other teams were less productive in some cases but the summation of all those indicators pointed to Montreal as being the least effective and efficient as a Team in Attack.

Now how about Jermaine Defoe and Toronto FC?  He had two goals in a blinding win for the Reds visiting Seattle.   Is there a reason why Toronto didn't get the best PWP Attacking team this week? A good question, and here's why they missed out.

Recall from last year that one of the top attacking teams in MLS was Vancouver - yet on the defending side they were not quite so fortunate.   Also note that both Chicago and Dallas also had on average (and in total) more goals scored than 3 other teams making the Playoffs.

In reviewing the intent of PWP; it's not intended to mirror outputs that directly match goals scored; if it was then the PWP Composite Index for last year would have been 70% accurate as opposed to 90% accurate.   For now let's just say that Toronto did a great job in taking 3 points in Seattle - it's a long season with many games yet to be played.   So the analysis doesn't snub Toronto - it simply attempts to better recognize that Real Salt Lake had a more comprehensive team attack than Toronto.

Unlike last week, the top Defending team performance did not come from the top attacking team; recall RSL gave up 3 goals-against in their draw with San Jose.

The top Defending team this past week were the Houston Dynamo.  Given Montreal were the bottom feeder in Attack it only makes sense that the most effective and efficient team in Defense... was... Houston; part of that rests with an impotent attack by Montreal but part of it also rests with a very active defending team unit of Houston.

It should be noted that last week Houston were number two in attack and defense; and while they only scored one goal this week they did, like last week, come away with a clean sheet.  Is this an early sign the the Dynamo are indeed a force to be reckoned with in the East?

Here's how they compared to all other teams in Week 2:
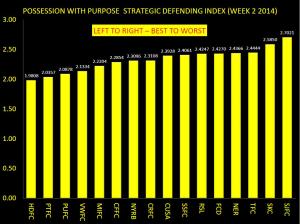
PWP STRATEGIC DEFENDING INDEX OF THE WEEK 2 2104

Here's their Defending percentages for the six steps of the PWP Strategic Defending Process:
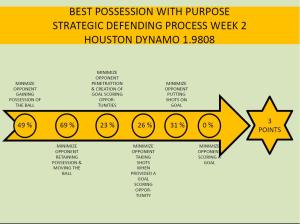
HOUSTON DYNAMO PWP STRATEGIC DEFENDING PROCESS OF THE WEEK 2 2104

And the PWP Defending Player of the Week award goes to Corey Ashe:
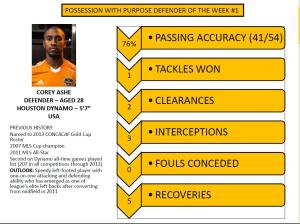
HOUSTON DYNAMO PWP INDIVIDUAL DEFENDING PLAYER OF THE WEEK 2 2014

Some could offer that David Horst or another defender might have nailed this award - for me the number of touches and passing accuracy speak to a comprehensive impact in the game and while David did great job in the box; especially with clearances I felt and thought Corey Ashe played the most comprehensive game on both sides of the pitch.

Finally, before offering up some additional observations, here's the complete picture on the PWP Composite Strategic Index for Week 2:
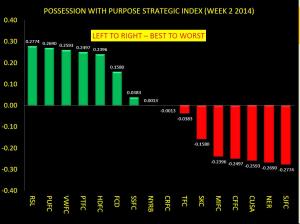
PWP COMPOSITE STRATEGIC INDEX FOR WEEK 2 2104

Observations:

A interesting output is how well Toronto showed against other teams this week; they took three points in their away match to Seattle yet fell below zero in their cumulative total.   Part of that outcome has much to do with their on-field strategy - play the counter and allow Seattle the better part of possession in hopes of capitalizing on mistakes to generate goals.

In looking at the Seattle statistical indicators for that game they were obnoxiously potent in posssession, passing, and penetration (like some others team so far this year) but simply couldn't put quality shots on goal or another goal past Cesar.

All told Seattle offered up 643 passes {HUGE} (this includes crosses, throw-ins, etc where the intent is to move the ball from one player to another), a 79% passing accuracy with 68% possession, 61% passing accuracy within the Attacking Third, (95 passes successfully completed), yet they only tallied 13 shots taken with just 2 of them on goal.   Seattle controlled the game only up to the point of setting the stage for shots and shots on goal - two of the most critical steps in Possession with Purpose.

As the year unfolds the counter-attacking style of Toronto, and others, while ceding possession, may be much more clear and additional tendencies should pop up to validate other teams taking this approach.  For now I'll call it an outlier but don't expect it to be an outlier later this year as more patterns develop.

Like last year, Portland is finding itself near the top in overall PWP.   As noted in my match analysis there is a potential weakness with Portland this year in telegraphing shots.  With 35 total shots taken this year 17 of them have been blocked before reaching the keeper - a trend to continue to watch for sure!

FC Dallas now have Pareja running the team and, if his team performs like the Rapids did last year, it is likely we continue to see them in the top half of the Index .  Last year Dallas faltered around the midway point and a good indicator then was a drop in defensive performance.  Should be interesting to see if that drop-off manifests itself after week 17 or so if there attack continues to stay aggressive.

Philadelphia have added Edu this year and their attack is considerably different given a more possession based approach - Jared Young offered last week that Okugu provided some very solid defensive play against Portland - we'll be sure to watch how he and Edu and others look to improve the Union results this year.

All for now; you can follow me on twitter @chrisgluckpwp

Best, Chris

How it Happened: Week One

Hello friends. This is the first in what will hopefully be a weekly feature here at ASA by yours truly. First, the background: Not being a fan of any particular MLS team is hard. It's hard to follow an entire league of 19 teams. Seven or eight games a week are difficult to catch up on, even when they aren't all played at the same time. Previously, I've watched highlights and 'condensed games' to try to pick up which teams and players were playing well, but it just doesn't work. The only way to really learn a team's strengths, weaknesses and tendencies is by watching every minute of every game they play. There's no way I can do that with every team in MLS while still working a full-time job. Sorry.

My solution is this: I plan on committing to watching a full 90 minutes of three games per week. This gives me six teams that I'll feel that I truly know (at least for that week), and should certainly teach me a heckuva lot more than just if I just watched their highlight packages. Since this here is an analytical and statistic-focused blog, I'll break down each of the three games by one particular stat or Opta chalkboard image that I think told the story of the game for each team. Think this idea is idiotic? Love it? Please, let me know: feedback is always appreciated. But leave my mom out of this.

DC United vs. Columbus Crew

Stat that told the story for Columbus: 58% of successful passes in attacking half for the fullbacks

clb1

The above image is all of the completed passes for Crew fullbacks Waylon Francis and Josh Williams on Saturday. These two players are clearly defenders who aren't afraid to get forward, but the startling frequency with which they were able to get up the field against DC had to have alarm bells ringing for United fans. For folks who prefer numbers to images, here you are: 49 of the 85 passes that Francis and Williams completed (58%) were in the attacking half. That's a pretty solid attacking contribution from two guys who are listed along the back line.

This was made possible for Columbus by a couple of adjustments made by new coach Gregg Berhalter. Centerbacks Michael Parkhurst and Giancarlo Gonzalez split reallllly wide when in possession, allowing both fullbacks to get forward. This was made possible by holding midfielder Wil Trapp, who sat very deep to cover the gap between centerbacks. It's only one game, but it certainly looked like a good strategy in week one for Columbus.

Stat that told the story for DC: 1 attacking player's pass into the penalty area

dcu1

Really, the above image for Columbus tells a lot of the story for DC, as well: they got hammered because the Crew got the ball wide and stretched DC's shape like a bad hamstring. With a team full of new faces who clearly haven't learned to play with one another yet, the defense was abused by all the space Crew players were able to find. But I can't use the same stat for both teams, so here's what I got for United: one. One successful pass from any of the three players nominally deployed in attack (Eddie Johnson, Fabian Espindola, Luis Silva) that ended in the penalty box.

Seriously: take a look at the Opta Chalkboard above. I get that it's hard to complete passes in the 18, but for the three guys who are tasked with creating chances, there needs to be more than one completed pass that ends up there. Oh, and that one completed pass? It came from a free kick, and ended with a flick-on by Davy Arnaud that didn't even turn into a shot. There was a lot wrong with DC in 2013 and a lot wrong with DC last weekend, but if the new faces of Johnson and Espindola were expected to cure all attacking ills....Ben Olsen may be in for a rude awakening.

Portland Timbers vs. Philadelphia Union

Stat that told the story for Portland: 20 crosses in the second hour of the game

The Timbers came out for the season opener and were dealt a dose of their own medicine from the new-look Philadelphia Union. Playing in a 4-3-3, the Union clogged the center of the field, put a lot of pressure on Portland and really made it difficult for the home team to get into their possession game. But as any good team does, the Timbers made adjustments. After being credited with just two crosses from open play in the games first 35 minutes, Portland emphasized wide play with Michael Harrington getting forward and Darlington Nagbe flaring out wide. After the 35th minute, Opta credited Portland with 20 crosses from open play. Some of this was due to bombing the ball forward as they sought an equalizer late, but recording 10 times as many crosses was certainly the product of an adjustment made by the Timbers.

Stat that told the story for Philadelphia: 12 midfield interceptions & recoveries to start the game

As I said above, the Union started the game very strong, with their midfield really clogging up Portland's attempts to possess the ball. The midfield three of Maurice Edu, Brian Carroll and Vincent Nogueira seemed to be replicating some of what made Portland so successful in 2013: clogging the middle of the field and winning a majority of loose balls. Opta credits those three with 12 combined interceptions and recoveries in the game's first 22 minutes. However, as also noted above, Portland adjusted to the Union's set-up and began to emphasize wide play. The Union didn't really adjust to the adjustment, as the Timbers clearly became more and more comfortable as the game went on. After those 12 interceptions/recoveries in the first 22 minutes, Edu, Carroll and Nogueria only recorded seven more the rest of the game.

LA Galaxy vs. Real Salt Lake

Stat that told the story for LA: 2.39 expected goals; 0 actual goals

lag1

If you're at this site, chances are you know the concept behind expected goals. If not, scroll down a ways and read up. Anyway, look at the above image: that's not a map of shots that typically leads to a shutout. According to the numbers run by ASA's own Harrison Crow, a league average team would've finished 2.39 goals from those shots. They finished zero. If you aren't into the stats and would prefer the English commentator's version: Robbie Keane missed some sitters, Landon Donovan was unlucky not to finish any of his half-chances, and Juninho and Marcelo Sarvas combined for some speculative efforts that nearly bulged the ol' onion bag. Oh, and Nick Rimando had a magisterial day in net to keep his clean sheet.

Stat that told the story for RSL: Joao Plata's complete game

I'm cheating a little here because that's not a real stat, but any time there's a 1-0 game, it's tough to leave out any conversation about the lone goal scorer. In this case, that's the diminutive Ecuadorian, Joao Plata. Plata debuted for Toronto FC three seasons ago, and it seems like he's been around for a lot longer than your average 22-year-old. But it's true. Plata is only 22, and if Saturday night is any indication, he could be in for his best season in MLS yet. Not only was Plata's finish on the game's only goal very cool, he was consistently playing with a lot more tactical awareness than I've seen out of him in the past. Whether it was setting up Alvaro Saborio for golden chances or making intelligent runs to stretch the defense and open up space for Javier Morales, Plata had a very, very good game against LA.