The Art of a Free Kick and How To Giovinco

The Art of a Free Kick and How To Giovinco

Sebastian Giovinco’s free kick prowess is well documented, but what if your team is not blessed with a formica atomica to bang in 13 direct free kick goals over the last 3 seasons? How do MLS teams score, or not, from free kicks?

From 2015-2017, 12,728 free kicks were taken in MLS play in the attacking half, resulting in 272 goals. Free kicks can be taken a number of ways, a direct shot on goal, a cross into the box, speculative long balls, through balls, or quick restarts, among others. The type of free kick restart is generally dictated by the position it is taken from. If a free kick is given close to goal, in the center of the field, a team will generally take a direct shot on goal (zone 14; 57.0% shots). Free kicks close to the goalline, but near the touchlines are most likely crosses (zones 13, 15, 16, 18; 57.1% crosses). Free kicks farther away from goal are almost always some other form of restart than a direct shot or cross (zones 10-12; 95.1%).

Read More

FC Dallas 2017 Season Preview

FC Dallas 2017 Season Preview

US Open Cup. Supporters’ Shield. Coach of The Year. Defender of the Year. You might not believe it, but Dallas will be even deeper and scarier in 2017.

2016 Review

Finally, some hardware! In 2016 FC Dallas ended a 19-year trophy drought by winning the US Open Cup and the Supporters’ Shield, but fizzled out in the playoffs without the magic of Mauro Diaz, who went down due to an Achilles tendon tear. Interesting how the injury occurred against Seattle and then it was the “#NotMyMLSCupChampion” Sounders that benefited in the playoffs, isn’t it? Real fútbol fans know that the team at the top of the table is the true league champion (eds note: we puked a little in our mouth, too. The homerism dies down from here, we promise).

Read More

2016 ASA PREVIEW: REAL SALT LAKE

The abysmal 2015 season for RSL was predicated on the failure to adapt to a new formation and lack of offensive depth. In Jeff Cassar's second season in charge of RSL, the team managed to compile anemic attacking numbers. Transitioning from a 4-4-2 diamond formation that seemingly defined RSL through the Jason Kreis era, the new shape exposed some players that were previously pivotal components to RSL's consistent success in the past.

Both Kyle Beckerman and Joao Plata were sluggish to figure out how to thrive in a new shape and struggled with their new identity, but for different reasons. As Beckerman ages, the expectation is that his motor will slow, his poor first step and general quickness will get even worse, but his game IQ and game management skills will improve. The issue with the attempted 4-3-3 shape is that the single, central midfielder is burdened with a more intense physical workload because of the vertical space that is now only occupied in front by the central forward in the middle channel. Beckerman struggled with the spatial requirements, his significant numbers have been declining for the past three seasons, and was ultimately exposed in the middle of the park.

Set for another terrorizing season in the final third, Plata came back from being injured during the beginning of the season and never found his feet in the new spacing. Although he seemed to thrive in open space, the lack of connection and compactness saw him struggling on isolated islands through many of his appearances.

Our projections for 2016 after the jump.

Read More

2015 ASA Preview: Real Salt Lake

*xG = expected goals, xA = expected assists, xGD = expected goal differential. For more information see our xGoals by Team page.

By Matthias Kullowatz (@mattyanselmo)

2014 Review (and beyond)

Real Salt Lake finished third in the Western Conference last season and competed in the MLS playoffs for the seventh consecutive year. RSL’s president, Bill Manning, was awarded Executive of the Year, and for good reason. RSL—the Tampa Bay Rays of MLS—has continued making the playoffs year in and year out on a low budget. In 2014, the team’s total compensation paid to players was sixth lowest in MLS, $2.4M below the league average team.*

The top story around here about Real Salt Lake revolves around its ability to frustrate me. Over the past two seasons, RSL has led the league in scoring more goals than our model expects it to, and in allowing fewer goals than our model expects it to. So what’s in the water in Utah?

Nick Rimando is in the water. Over the past three seasons, Rimando has made saves valued at more than six goals per season better than average.** Using a simple regression, we can estimate that those six goals in a season were worth about four additional points for RSL in the standings each year. Not bad for one player.

Offensively, we've shown that outperforming expected goals becomes a stable metric as the season progresses. The only question is, how does RSL do it? Perhaps of importance, its offense is extremely slow and methodical relative to other teams. According to Tempo Free Soccer, RSL was third in the league in 2014 in passes per possession (PPP) but dead last in possessions per game (PPG). There is certainly a correlation across the league between PPP and outperforming expected goals, indicating that perhaps long possession (by number of passes) frees up players for shots with more time and space. Or maybe teams that are capable of creating time and space know that they need to pass the ball around enough to find the right opportunity. Either way, it’s clearly possible that RSL is such a team that has an ability to outperform its expected goals offensively.

Between 2011 and 2013, striker Alvaro Saborio consistently outperformed his own expected goals by about two per season. In 2014, he started just 13 games and played 1230 minutes, making way for the four-foot-15-inch Ecuadorian, Joao Plata. Plata clearly appreciated his opportunity, producing 56 of his own shots and 13 goals in just 24 starts—6.5 goals more than expected, given his quality and quantity of opportunities. While Plata will likely regress some in the finishing department, it seems that RSL’s style fosters overperformance. It is still up for debate as to how much of this overperformance comes from each of team style, individual finishing, and random variation.

2015 Preview

Whenever the season actually starts, RSL will kick off with one of the best goalkeepers in the league once again in Rimando. We’ve talked about him already, but his backup may be one of the more undervalued assets on the team. Jeff Attinella made just below $50,000 in total compensation in 2014, not too far above league minimum of $36,500. Our keeper ratings show that he saved four more goals than expected last season, and while 10 starts is hardly a large enough sample size to conclude he’s a top goalkeeper, a history of success in the NASL suggests that he’s capable. Additionally, our own Will Reno projects him essentially as a typical starting MLS goalkeeper, and Tom Worville suggested that Attinella was an undervalued keeper using WhoScored data. For 50,000 bananas, RSL fans can be reassured that if Rimando were to go down, the season wouldn't be hopeless.

Defense

This offseason saw the departure of two starters along RLS’s backline, Nat Borchers to Portland and Chris Wingert (and his classy tucked-in jersey) to New York City FC. They combined for 5,780 minutes, half of which will likely go to the prodigal son, Jamison Olave. Olave will replace Borcher’s position at centerback, but probability in a much different way. Olave features an athleticism that does not conjure up any images of Borchers, though it’s perhaps a reckless athleticism at times. Olave did accumulate eight yellow cards last season, exactly as many as Portland’s Diego Chara who is particularly known for such chicanery. Despite the physical differences, for what it’s worth, some of their statistical outputs are quite similar.

Player xG xA Shots KP AirDuels/G Steals/G Pass%
Borchers 1.2 0.2 13 4 2.6 0.4 86%
Olave 1.4 0.4 13 3 2.6 0.5 83%
Data from both our archives and Whoscored.com

Who will get those other minutes left by Wingert is up for debate, but Demar Phillips appears to be the frontrunner. The Jamaican international joins RSL from Aalesunds FK, a successful team in Norway’s top division. Also an option is the 26-year-old Abdoulie Mansally, who made 11 appearances with six starts last season. Both could provide a stronger offensive presence than Wingert from the back. Mansally was once a forward, and produced more xGoals and xAssists than Wingert on a per-minute basis in 2014, and Phillips has scored 12 goals for the Jamaican international team over the years, indicating some experience being offensive.

Midfield

RSL is known for its 4-4-2 lineup with an effective diamond midfield. It started four midfielders in every game but one last season, at least nominally. This is interesting because multiple sources suggest that RSL could come out in a 4-3-3 in 2015. After losing Ned Grabavoy to NYCFC in the expansion draft—in addition to a growing pool of forward talent—RSL may be rethinking its personnel and style. Last season the midfield quartet of Grabavoy, Javier Morales, Kyle Beckerman, and Luke Mulholland produced 15.5 expected goals and 16.2 expected assists in 10,581 minutes. For comparison’s sake, D.C. United’s primary middle four logged 10,359 minutes and recorded just 10.8 expected goals and 6.8 expected assists. Though it may not be completely fair to compare them to D.C. United, team style aside, it shows that RSL got a lot more out of its midfield than another successful MLS team that also played a 4-4-2.

Regardless of formation, 2015 is likely to feature more of USMNT member Luis Gil and less of Mulholland. Mulholland outpaced Gil in shots and expected goals last season, but not by much once you consider that Gil played 500 fewer minutes. Just 21 years of age and getting USMNT experience, Gil is ready to start and play 2,500+ minutes.  But the question remains, will RSL’s midfield be able to continue to produce high quantity and quality of chances in a new formation? Was Grabavoy more important to the mix than many thought? I don't have these answers, but perhaps 2015 does.

Forwards

Another reason for the potential formation change may have a lot to do with the emergence of Plata, Olmes Garcia, and Devon Sandoval as good young forwards, as well as the mid-season signing of Argentine striker Sebastian Jaime back in August. With Saborio returning from an injury-shortened season, RSL may feel that it can maximize production by simply allowing more forwards to play at once. The loss of Robbie Findley’s 822 minutes may not even be noticed.

There was a focus Plata’s 13 goals and what he was able to do for RSL by scoring, but I noticed something else in his statistical line. He led RSL’s forwards in 2014 by far in key passes and expected assists with 48 and 5.7, respectively. Of course, he played more minutes, so how about this one: in 2,084 minutes, Plata recorded more key passes and xAssists individually than every other main RSL forward in a combined 4,294 minutes.*** Even if it starts three forwards in 2015, Real Salt Lake would have one that distributes enough to make it work well.

Conclusion

Despite the losses of Borchers, Grabavoy, and Findley, among others, RSL definitely has the fire power to compete for a top three finish in the Western Conference, though that may not be the average projection. I feel that RSL’s success in 2015 hinges on its ability to make the midfield as effective as it was the past, whether it chooses to replace Grabavoy with a forward (4-3-3) or work Gil in with the remaining midfielders (4-4-2). Our predictive model from the end of last season suggested that RSL would be expected to finish essentially tied for fourth in the West with Portland, Sporting KC, and Vancouver. I think it's fair to project RSL to finish somewhere between 3rd and 7th in a tight Western Conference.


* http://www.mlsplayers.org/salary_info.html

**Check out our keeping ratings under the xGoals tabs!

***Includes Saborio, Garcia, Findley, Sandoval, and Jaime.

Real Salt Lake: Perennial Model Buster?

If you take a look back at 2013's expected goal differentials, probably the biggest outlier was MLS Cup runner up Real Salt Lake. Expected to score 0.08 fewer goals per game than its opponents, RSL actually scored 0.47 more goals than its opponents. That translates to a discrepancy of about 19 unexplained goals for the whole season. This year, RSL finds itself second in the Western Conference with a goal differential of a massive 0.80. However, like last year, the expected goal differential is lagging irritatingly behind at --0.77. There are two extreme explanations for RSL's discrepancy in observed versus expected performance, and while the truth probably lies in the middle, I think it's valuable to start the discussion at the extremes and move in from there.

It could be that RSL plays a style and has the personnel to fool my expected goal differential statistic. Or, it could be that RSL is one lucky son of a bitch. Or XI lucky sons of bitches. Whatever.

Here are some ways that a team could fool expected goal differential:

  1. It could have the best fucking goalkeeper in the league.
  2. It could have players that simply finish better than the league average clip in each defined shot type.
  3. It could have defenders that make shots harder than they appear to be in each defined shot type--perhaps by forcing attackers onto their weak feet, or punching attackers in the balls whilst winding up.
  4. That's about it.

We know are pretty sure that RSL does indeed have the best goalkeeper in the league, and Will and I estimated Nick Rimando's value at anywhere between about six and eight goals above average* during the 2013 season. That makes up a sizable chunk of the discrepancy, but still leaves at least half unaccounted for.

The finishing  ability conversation is still a controversial one, but that's where we're likely to see the rest of the difference. RSL scored 56 goals (off their own bodies rather than those of their opponents), but were only expected to score about 44. That 12-goal difference can be conveniently explained by their five top scorers--Alvaro Saborio, Javier Morales, Ned Grabavoy, Olmes Garcia, and Robbie Findley--who scored 36 goals between them while taking shots valued at 25.8 goals. (see: Individual Expected Goals, and yes it's biased to look at just the top five goal scorers, but read on.)

Here's the catch, though. Using the sample of 28 players that recorded at least 50 shots last season and at least 5 shots this season, the correlation coefficient for the goals above expectation statistic is --0.43. It's negative. Basically, players that were good last year have been bad this year, and players that were bad last year have been good this year. That comes with some caveats--and if the correlation stays negative then that is a topic fit for another whole series of posts--but for our purposes here it suggests that finishing isn't stable, and thus finishing isn't really a reliable skill. The fact that RSL players have finished well for the last 14 months means very little for how they will finish in the future.

Since I said there was a third way to fool expected goal differential--defense. I should point out that once we account for Rimando, RSL's defense allowed about as many goals as expected. Thus the primary culprits of RSL's ability to outperform expected goal differential have been Nick Rimando and its top five scorers. So now we can move on to the explanation on the other extreme, luck.

RSL has been largely lucky, using the following definition of lucky: Scoring goals they can't hope to score again. A common argument I might expect is that no team could be this "lucky" for this long. If you're a baseball fan, I urge you to read my piece on Matt Cain, but if not, here's the point. 19 teams have played soccer in MLS the past two seasons. The probability that at least one of them gets lucky for 1.2 seasons worth of games is actually quite high. RSL very well may be that team--on offense, anyway.

Unless RSL's top scorers are all the outliers--which is not impossible, but unlikely--then RSL is likely in for a rude awakening, and a dogfight for a playoff spot.


*Will's GSAR statistic is actually Goals Saved Above Replacement, so I had to calibrate.

How it Happened: Week One

Hello friends. This is the first in what will hopefully be a weekly feature here at ASA by yours truly. First, the background: Not being a fan of any particular MLS team is hard. It's hard to follow an entire league of 19 teams. Seven or eight games a week are difficult to catch up on, even when they aren't all played at the same time. Previously, I've watched highlights and 'condensed games' to try to pick up which teams and players were playing well, but it just doesn't work. The only way to really learn a team's strengths, weaknesses and tendencies is by watching every minute of every game they play. There's no way I can do that with every team in MLS while still working a full-time job. Sorry.

My solution is this: I plan on committing to watching a full 90 minutes of three games per week. This gives me six teams that I'll feel that I truly know (at least for that week), and should certainly teach me a heckuva lot more than just if I just watched their highlight packages. Since this here is an analytical and statistic-focused blog, I'll break down each of the three games by one particular stat or Opta chalkboard image that I think told the story of the game for each team. Think this idea is idiotic? Love it? Please, let me know: feedback is always appreciated. But leave my mom out of this.

DC United vs. Columbus Crew

Stat that told the story for Columbus: 58% of successful passes in attacking half for the fullbacks

clb1

The above image is all of the completed passes for Crew fullbacks Waylon Francis and Josh Williams on Saturday. These two players are clearly defenders who aren't afraid to get forward, but the startling frequency with which they were able to get up the field against DC had to have alarm bells ringing for United fans. For folks who prefer numbers to images, here you are: 49 of the 85 passes that Francis and Williams completed (58%) were in the attacking half. That's a pretty solid attacking contribution from two guys who are listed along the back line.

This was made possible for Columbus by a couple of adjustments made by new coach Gregg Berhalter. Centerbacks Michael Parkhurst and Giancarlo Gonzalez split reallllly wide when in possession, allowing both fullbacks to get forward. This was made possible by holding midfielder Wil Trapp, who sat very deep to cover the gap between centerbacks. It's only one game, but it certainly looked like a good strategy in week one for Columbus.

Stat that told the story for DC: 1 attacking player's pass into the penalty area

dcu1

Really, the above image for Columbus tells a lot of the story for DC, as well: they got hammered because the Crew got the ball wide and stretched DC's shape like a bad hamstring. With a team full of new faces who clearly haven't learned to play with one another yet, the defense was abused by all the space Crew players were able to find. But I can't use the same stat for both teams, so here's what I got for United: one. One successful pass from any of the three players nominally deployed in attack (Eddie Johnson, Fabian Espindola, Luis Silva) that ended in the penalty box.

Seriously: take a look at the Opta Chalkboard above. I get that it's hard to complete passes in the 18, but for the three guys who are tasked with creating chances, there needs to be more than one completed pass that ends up there. Oh, and that one completed pass? It came from a free kick, and ended with a flick-on by Davy Arnaud that didn't even turn into a shot. There was a lot wrong with DC in 2013 and a lot wrong with DC last weekend, but if the new faces of Johnson and Espindola were expected to cure all attacking ills....Ben Olsen may be in for a rude awakening.

Portland Timbers vs. Philadelphia Union

Stat that told the story for Portland: 20 crosses in the second hour of the game

The Timbers came out for the season opener and were dealt a dose of their own medicine from the new-look Philadelphia Union. Playing in a 4-3-3, the Union clogged the center of the field, put a lot of pressure on Portland and really made it difficult for the home team to get into their possession game. But as any good team does, the Timbers made adjustments. After being credited with just two crosses from open play in the games first 35 minutes, Portland emphasized wide play with Michael Harrington getting forward and Darlington Nagbe flaring out wide. After the 35th minute, Opta credited Portland with 20 crosses from open play. Some of this was due to bombing the ball forward as they sought an equalizer late, but recording 10 times as many crosses was certainly the product of an adjustment made by the Timbers.

Stat that told the story for Philadelphia: 12 midfield interceptions & recoveries to start the game

As I said above, the Union started the game very strong, with their midfield really clogging up Portland's attempts to possess the ball. The midfield three of Maurice Edu, Brian Carroll and Vincent Nogueira seemed to be replicating some of what made Portland so successful in 2013: clogging the middle of the field and winning a majority of loose balls. Opta credits those three with 12 combined interceptions and recoveries in the game's first 22 minutes. However, as also noted above, Portland adjusted to the Union's set-up and began to emphasize wide play. The Union didn't really adjust to the adjustment, as the Timbers clearly became more and more comfortable as the game went on. After those 12 interceptions/recoveries in the first 22 minutes, Edu, Carroll and Nogueria only recorded seven more the rest of the game.

LA Galaxy vs. Real Salt Lake

Stat that told the story for LA: 2.39 expected goals; 0 actual goals

lag1

If you're at this site, chances are you know the concept behind expected goals. If not, scroll down a ways and read up. Anyway, look at the above image: that's not a map of shots that typically leads to a shutout. According to the numbers run by ASA's own Harrison Crow, a league average team would've finished 2.39 goals from those shots. They finished zero. If you aren't into the stats and would prefer the English commentator's version: Robbie Keane missed some sitters, Landon Donovan was unlucky not to finish any of his half-chances, and Juninho and Marcelo Sarvas combined for some speculative efforts that nearly bulged the ol' onion bag. Oh, and Nick Rimando had a magisterial day in net to keep his clean sheet.

Stat that told the story for RSL: Joao Plata's complete game

I'm cheating a little here because that's not a real stat, but any time there's a 1-0 game, it's tough to leave out any conversation about the lone goal scorer. In this case, that's the diminutive Ecuadorian, Joao Plata. Plata debuted for Toronto FC three seasons ago, and it seems like he's been around for a lot longer than your average 22-year-old. But it's true. Plata is only 22, and if Saturday night is any indication, he could be in for his best season in MLS yet. Not only was Plata's finish on the game's only goal very cool, he was consistently playing with a lot more tactical awareness than I've seen out of him in the past. Whether it was setting up Alvaro Saborio for golden chances or making intelligent runs to stretch the defense and open up space for Javier Morales, Plata had a very, very good game against LA.

Season Preview: Real Salt Lake

The optimist looks at Real Salt Lake’s 2013 season and praises the club for making the MLS Cup Finals. The pessimist complains that they lost the MLS Cup Finals in penalty kicks despite holding a lead with 15 minutes remaining, facing a goalkeeper who seemed like his joints had frozen solid. The optimist praises the club’s performance in the U.S. Open Cup, lauding their run to the finals. The pessimist complains that they lost in the finals against DC United, a dreadful team. The optimist praises the team for finishing with a 16-10-8 record and a +16 goal differential in the regular season. The pessimist complains that they failed to win the Supporters Shield (again!) by 3 points. For Real Salt Lake in 2013, perception was everything. 

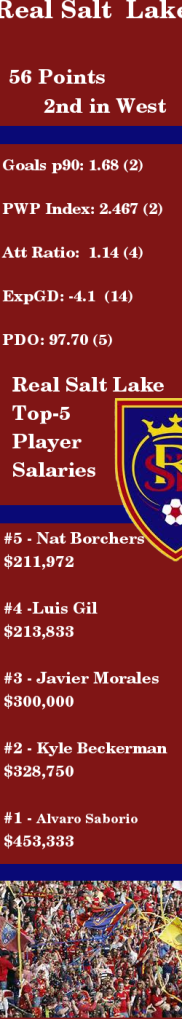
2013 Finish: 16-10-8, 56 points; 57 GF, 41 GA. Second place in Western Conference. Lost in MLS Cup Finals.

2013 RSL Formation - 2014-02-24

Transactions

Players In

Players Out

Name Pos   Name Pos  
Jordan Allen M/F Homegrown Yordany Alvarez M Out of Contract
Luke Mulholland M Free Brandon McDonald D Out of Contract
      Josh Saunders GK Out of Contract
      Khari Stephenson M Out of Contract
      Lovel Palmer D/M Traded to Chicago

Roster Churn: RSL returns 90.5% of its minutes played in 2013 (1st in all of MLS).

Know When to Hold ‘Em

In early 2013, Real Salt Lake owner Dell Loy Hanson made the decision not to extend Jason Kreis’s contract, gambling that Kreis’s stock would come down and he would be able to nab the coach at a bargain price. After all, the club had just lost Will Johnson, Jamison Olave, Fabian Espindola, and Jonny Steele in an offseason filled with cost-cutting moves. 2013 seemed likely to be a rebuilding year. Twelve months and two cup finals later, Jason Kreis is preparing for the 2015 debut of New York City FC, leaving Jeff Cassar, promoted from assistant coach, to lead Real Salt Lake. Cassar, with the team since 2007, is a safe choice, but even with all 11 starters returning, he may find it difficult to replicate the kind of success that RSL achieved under Jason Kreis.

In Good Hands


Nick Rimando returns to man the RSL nets for the 8th consecutive season. There’s nothing much that can be said about Rimando that you probably don’t already know. A 14-year veteran of the league, Rimando has ascended to third in command of the United States net. Remarkably, Rimando has a 10-0-0 record with the U.S. team, and is already tied for 5th all-time on the goalkeeper victory list with Brad Guzan.

Rimando’s national team opportunities have come as a result of stellar club play. Last season, he finished 2nd to Donovan Ricketts in Goalkeeper of the Year award voting, and was probably unlucky to do so. Rimando really is the total package: His reflexes and shot-stopping ability are legendary, and while it may not surprise you that Rimando finished 4th in pass completion percentage, the diminutive Rimando is also an excellent commander of his penalty area. In 2014, Rimando finished 4th in MLS in catches per 90 with 2.63. This paragraph is far too long for one that could have been summed up simply with "Real Salt Lake is in good hands with Nick Rimando."

Continuity in the Back

2014 RSL Roster - 2014-02-24With Chris Wingert, Nat Borchers, Chris Schuler, and Tony Beltran patrolling in front of him, Nick Rimando, too, will be in good hands. In the playoffs, Borchers and Schuler showed the potential to become one of the best pairings in the league. Though that is contingent on whether Schuler can remain healthy. In both the 2012 and 2013 seasons, Schuler was sidelined for multiple months with a foot injury. It was evident just how much Salt Lake missed Schuler last season when he was injured: with Schuler on the field last season, RSL conceded only 0.94 goals per 90, without him, they conceded 1.45 goals per 90. Yes, the sample size is small, and no, these numbers do not take into account opponent and location of the game. Still, Schuler’s contributions to defense were evident when 20-year old Carlos Salcedo was forced to step in. Nat Borchers provides much more certainty. In his 9-year Major League Soccer career (he spent two years with Odd Grenland in Norway), Borchers has averaged more than 28 starts per season.

RSLinfoThe Best Defense…

However, for all they do defensively, it may be their contributions to the attack that makes the RSL backline so valuable. Nat Borchers is one of the calmest defensive distributers in the league. Last season he had the 3rd best pass completion rate in the league, behind only Osvaldo Alonso and George John. This may be because Real Salt Lake puts a premium on possession and building the attack from the back, which sees Beckerman and the rest of the midfielders providing outlet options constantly. The team led MLS last season in possession percentage, pass success percentage, and percentage of passes that were under 25 yards. After all, Kwame Watson-Siriboe finished with a 93% passing rate (in but a mere handful of games), and Carlos Salcedo and Schuler both finished above 80%.

Wingert and Beltran involve themselves in the attack as well, though not always in the traditional, bomb-down-the-flanks-and-send-in-a-cross manner. When Real Salt Lake is in possession, the two outside backs (and Beltran especially) inhabit an advanced position on the field, where they can combine effectively with Gil, Grabavoy, Morales, and Saborio. Beltran is the more threatening of the two outside backs, finishing last season 5th in the league in key passes among defenders with 25.

Owning the Ball

The midfield will look awfully familiar for RSL fans this season as well, and why shouldn’t it? No midfield quartet in MLS can control the pace of the game like Kyle Beckerman, Ned Grabavoy, Luis Gil, and Javier Morales. Beckerman provides the transition from defense to attack, from left to right. He does it often, and he does it well. The only midfielder with more passes than Beckerman last season was Marcelo Sarvas, who had 3 more passes than Beckerman, though the Galaxy midfielder did it in 610 more minutes. Beckerman was the runaway leader in passes per game with 69.7, nearly 10 more than number two on the list. And though better known for his grit and tactical nous, Beckerman also manages to throw in no-look assists from time to time, just for fun (and to [almost] win MLS Cup).

Number two on that list of passes per game in MLS last year? None other than Javier Morales. Though he always has a target on his back, the 34-year-old Argentine playmaker often drifts wide and deep to ensure that he sees enough of the ball. And when he gets the ball, RSL benefits. Last season, Morales finished (per game) in the top 10 in fouls suffered (1st), key passes (2nd), successful through balls (4th), and successful crosses (6th).

These numbers are gaudy enough, but numbers like that are often indicative of a high-risk style of play, sending in large numbers of passes and crosses to in the hopes that a few of them will lead to dangerous scoring opportunities. And while he does send in a lot of passes (Morales has attempted [2,327] and completed [1,857] more passes in the opponent's half than any other MLS player over the last two years), what sets Morales apart from his peers is his effectiveness. While the average pass completion percentage of the rest of the top ten “key passers” (all attack-minded players) in 2013 was 76.6%, Morales’s was a hearty 83.1%. This number is inflated a bit both because he plays on such a talented, possession-oriented team and because he receives the ball farther from goal than, say, Thierry Henry or Robbie Keane, both of which lead to more safe ball touches. But even with these advantages, Morales should be regarded as one of the most talented players in the league, one who was unfortunate not to have been included in the MVP race last season.

The Other Guys

The rest of the midfield will be rounded out by two of the most underrated players in the league. Gil gets more publicity than Grabavoy. He did when he signed with Major League Soccer amid rumors of pursuit by clubs like Arsenal, and he does as a 20-year-old who has caught the eye of Jurgen Klinsmann. Gil deserves his plaudits, of course. After all, how many MLS players have played in 84 games before their 20th birthday? (By my count, just Freddy Adu and Eddie Gaven, though others, like Diego Fagundez, should get there).

But how many times have you heard Ned Grabavoy referenced recently? If you listen to the media or fans, probably not very many, but if you’re taking note of the play-by-play man on an RSL broadcast, you probably hear it quite often. Grabavoy is everywhere on the field: relentlessly pressuring the ball (he finished 14th last season in tackles per game among midfielders), and then quickly and efficiently--far more than he gets credit for (86% pass completion rate, 4th best in MLS)--distributing it. Remarkably, despite all of Grabavoy’s defensive grit, he finished tied for 6th among MLS midfielders in fouls suffered with 63 (9th in fouls per game with 2.0), and committed only 37 himself. If that’s not enough, he pitched in with 5 goals on only 29 shots, intelligently taking 20 shots inside the box versus only 9 outside.

The Finishers

Up top, Salt Lake will deploy their preferred pair of Alvaro Saborio and Robbie Findley. Saborio may be the most indispensable member on the RSL squad. He has scored at least 11 goals in each of the four seasons he has been in the league. Last season, due to injuries and international call-ups, he only managed 15 starts, yet still racked up 12 goals. His .80 goals per 90 minutes led the league.

Findley will provide support for Saborio. He may not have the greatest skill on the ball, but his pace down the channels draws defenders out of position and opens up space for Saborio and streaking midfielders. However, if Findley gets off to a slow start, he’ll have to watch his back. Last season, the trio of Olmes Garcia, Joao Plata, and Devon Sandoval, three very different types of forwards, all showed promise, and will be looking for even more playing time this season.

The Prediction

This preview has featured incessant, nearly sycophantic levels of praise for RSL players, but years of success despite shuttling players in and out of Utah to stay under the salary cap suggests that maybe it’s the system just as much as it is the players. After all, when Sebastian Velazquez filled in for Luis Gil, he looked great. Same for Yordany Alvarez for Ned Grabavoy. Joao Plata, Robbie Findley. Sandoval, Saborio. How much of the success of RSL was because of the system? How much of the system was based on Kreis’s presence?

American Soccer Analysis readers seem to think that the team will not have quite the same success this year. They have projected RSL to finish 4th in the Western Conference this season, with 20.69% of voters placing them there. Although very few people think that they will miss the playoffs entirely, with only 13.05% of voters placing them in spots six through nine.

A Closer Look At The MLS MVP Race

Editor's Note: This was the first of many articles by Jacob, who can be found at @MLSAtheist on twitter. It's quite amazing, and I encourage you to read it. He's one of several wonderful writers that we are adding to the site in the coming weeks. Please give him a follow and good feedback, as you have for Drew, Matty, and me. This is all part of putting together newer, better site content.

Not long ago, I saw a piece on ESPN handicapping the MLS MVP race, featuring the one and only Alexi Lalas. Say what you will about Lalas, but what he said on this topic got my mind jogging. The season was still a couple weeks from being complete, but the Redhead tipped Marco Di Vaio over Mike Magee for the award, based mostly on his higher goal total. He explained that goals are the rarest and most important event in soccer, so the guy who scores the most (and in the most games, giving his team a better chance to win) is the best candidate for the award. But here at American Soccer Analysis, we know that just because a guy puts the final touch on a goal doesn’t necessarily make him the most valuable component of that play, let alone that season.

Anyway, Lalas had a point: goals are important. And whether you like it or not, goal scorers and creators are always going to be the award winners in this sport. But still, looking solely at goal totals seems far too simplistic when handicapping the race for MVP. So, as we are wont to do around here, I tried to delve a little deeper.

First of all, you can contribute to goals without being the one to actually kick it into the net. I’ll do the most obvious thing possible, and just add assists to the equation. Additionally, not every player gets to play the same amount. Especially in MLS, where some of the top players are constantly called away for international duty, some MVP candidates only play in two-thirds of his team’s games. But if the premise here is that the award is intended to go to the most prolific goal creator, we should really look at how many goals they create when they’re actually on the field.

Here are the ten top MVP candidates (I know they probably aren’t all that deserving, but ten is a good round number and I’m a little OCD), and how many goals they’ve created, as well as their per 90 minute rate.

Player

Goals

Assists

G+A Per 90

M. Magee

21

4

.806

M. Di Vaio

20

2

.698

R. Keane

16

11

1.22

J. Morales

8

10

.710

Camilo

22

6

1.04

D. Valeri

10

13

.909

F. Higuain

11

9

.694

D. Fagundez

13

7

.742

T. Cahill

11

5

.642

G. Zusi

6

8

.535

It’s no surprise to see Keane and Camilo leading the way with over one per game, as they have the highest sum of goals and assists, and Keane did his work in fairly limited minutes. But again, goals and assists are a little too superficial for us here at ASA. After all, some goals are the fault of terrible defending, goalkeeping, or just some really fortunate bounces; instead it’s preferred to look at chance creation. If a player is consistently creating chances, it’s nearly inevitable that it should lead to more goals. Now rather than just the shots that actually end up in the net, we’ll run the numbers regarding shots, as well as passes that lead to shots (key passes) for the same players:

Player

Shots

Key Passes

Shots Created Per 90

M. Magee*

114

65

5.77

M. Di Vaio

89

25

3.62

R. Keane

54

53

4.86

J. Morales

33

94

5.01

Camilo

95

37

4.91

D. Valeri

55

59

4.51

F. Higuain

69

115

6.39

D. Fagundez

43

27

2.60

T. Cahill

47

19

2.65

G. Zusi

41

75

4.43

This time we’ve got a couple of different leaders, as Federico Higuain and Mike Magee take the lead thanks to their trigger-happy styles. Higuain’s incredible number of key passes, despite playing for a middling Crew team, should raise some eyebrows---the dude’s an absolutely fantastic attacker.

Still, I have an issue with just looking at shots created. After all, we know not all shots are created equal. Without looking up the shot location data of every one of the shots in the above table, I think there’s still a way to improve the statistics: add in a factor of accuracy.

For Higuain, creating over six shots a game is terrific. But from watching a lot of Columbus games, I can tell you that plenty of those shots were low percentage bombs from 30 yards out, and plenty of others were taken by other fairly inept Crew attackers. To try to factor this in, I’d like to look at how many shots on target each player creates - the ones that actually have a chance at becoming goals. While shots on goal stats for individual players are easy to find, it’s tougher to decipher when key passes lead to shots that test keepers rather than boots into the stands. To compensate, I used each player’s team percentage of shots on target to estimate how many key passes turned into shots on goal, leading to the final following table:

Player

Shots on Goal

Key Passes

Team Shot%

SoG Created Per 90

M. Magee*

50

65

48% / 51%

2.68

M. Di Vaio

56

25

54%

2.21

R. Keane

31

53

48%

2.56

J. Morales

19

94

52%

2.68

Camilo

56

37

49%

2.76

D. Valeri

31

59

49%

2.36

F. Higuain

36

115

43%

2.96

D. Fagundez

30

27

50%

1.57

T. Cahill

22

19

48%

1.25

G. Zusi

21

75

42%

2.00

There we have it. My endorsement for MVP this season, based on a combination of Alexi Lalas’ inspiration and my own twisted statistical mind, is Federico Higuain of the 16th-best team in the league, the Columbus Crew.

Just kidding, guys! Obviously the MVP debate should take more into account than who creates shots on goal. Defense, leadership, your team actually winning---all of these things should and do matter. But still, I think this was an interesting exercise and hopefully opened at least one set of eyes to how prolific Higuain is.

Finally, a few thoughts/takeaways in bullet form:

  • Higuain was held back by his team’s terrible shooting accuracy, but not as much as Graham Zusi. Now I understand why analytic folks like Sporting Kansas City’s chance creation so much, yet the team hasn’t always seen the results.
  • Diego Fagundez is incredibly selective about his shooting - almost 70% of his shots hit the target.
  • Javi Morales doesn’t shoot much for being so prolific at creating others shots. Reminds me of this post by Tempo Free Soccer---really interesting as far as categorizing attackers as shooters vs. providers.

*Since Magee was traded mid-season, his season total stats were harder to find. While I used Squawka for everyone else’s stats, I ended up having to tally Magee’s game-by-game stats from Who Scored. It’s possible that the two sites have different standards for what constitutes a shot or key pass, and that could’ve skewed the data for Magee. I’m not sure any of them look too far out of whack that I’m too suspicious, but it’s possible so I thought it should be noted.