Playoffs are a real possibility for the Whitecaps

Vancouver finished outside the playoff picture last year in a conference that allows 55.6 percent of its members to advance into November. Despite passing the "eye test" with a lot of talent, and despite producing a positive goal differential, the Whitecaps did little to convince our more advanced soccer statistics that they were a good team. Vancouver fired off 12.9 shots per game, but allowed 15.1. Furthermore, when those shots are valued based on quality, Expected Goals suggests Vancouver was below average, posting a negative xGD. Supporters may have pointed to their excellent shot accuracy and finishing rates as signs of talent and reason for optimism, but those things don't stabilize quickly, and the man who was most responsible deserted them for Liga MX. To kick off the season, we provided previews of all 19 teams. Jacob covered Vancouver, and he justifiably wrote, "As the 2014 season gets set to begin, Vancouver is one of just a few teams in the league that don’t appear to be as good as last year." Losing internationals Kenny Miller, Y.P. Lee and Camilo would probably make any MLS team worse, and before the acquisition of Matias Laba, Steve Beitashour was probably the most notable addition. On average, you readers picked the Caps to finish 7th in the West, and 76 percent of you guessed that they would miss the playoffs. I'm quite confident that I picked them to finish in 8th place. Missing the playoffs may very well still happen, but that outcome doesn't seem to have a majority of the probability anymore.

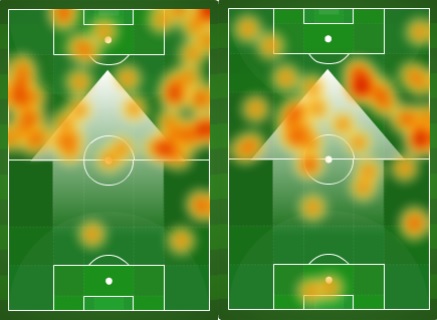
I think it's fair to say that Vancouver's 2014 has been surprising for most everybody. After ten games, nearly one-third of a season, Vancouver finds itself in third place. More importantly, it has an above-average shot attempt ratio (1.1) and positive expected goal differentials both overall (+0.13 per game) and in even gamestates (+0.36 per game). In 2013, the first 10 games of the season proved to be reasonably predictive of points earned in the final 24, as shown below.

Predictor Correlation P-value
GD 0.43 0.091
AttRatio* 0.55 0.000
xGD 0.78 0.000
xGD (zero) 0.75 0.000

A team's actual goal differential during the first 10 games had the weakest correlation to its points earned in the last 24 games, as any reader of this blog would have expected. But look at the correlations between xGD in the first 10 games and points earned in the last 24 games. Only more seasons of data will tell us if the correlation is truly that strong, but it's definitely a good indication for Vancouver. The xGD model would expect them to earn another 37 points, totaling 53 points for the season---a figure that, in combination with our playoff chances, suggests the playoffs might be more likely than not likely for the Vancouver Whitecaps.

*The correlation for Attempt Ratio was calculated from all team seasons between 2011 and 2013, while the other correlations could only be calculated from 2013 with the available data.

Expected Wins #2 - After 184 MLS Events (92 Games)

Hopefully most of you read Part I of my series on Expected Wins in Major League Soccer. As a quick reminder the Expected Wins analysis is my internal data quality review on the seven data points I use to support my quantitative Possession with Purpose analysis; the stronger the correlation these data points have the more confidence I have in the overall Indices that are created to assess team performance.

For your benefit, in case you forgot, here are the seven data points I continue to analyze as we reach the 92 game point in MLS; which equals 184 events:

  1. Passes Attempted Entire Pitch
  2. Passes Completed Entire Pitch
  3. Passes Attempted Final Third
  4. Passes Completed Final Third
  5. Shots Taken
  6. Shots on Goal
  7. Goals Scored

All data points, at this time, have equal weight.

What is interesting is that over the week to week course of the season 40% (20/50) of the weekly top five teams, in Attacking PWP, have averaged less than 50% possession in their matches.  

For me that's pretty cool as it indicates this analysis is not really biased towards teams that use a shorter-passing scheme in attack.  Week 5, 3 of 5 teams were under 50% and the other two were both under 51% possession.

Some of those teams are possession based teams like DC United, Portland and Seattle but in that week the margin of possession did not have as much effect as the ability of those teams to finish quality chances - the top three teams that week all scored goals equal to their shots on goal.

The five teams that week who exceeded 80% in Passing Accuracy; usually a good indicator of ground based attacking all finished outside the top 5.


Moving on after that tidbit, here's the averages for overall (blue bar), teams that win (green bar), teams that draw (orange bar) and teams that lose (red bar).

Expected Wins 2 Averages

Facts as they exist today after 184 Events in 2014:

  • The overall tenor of the data points and their relationship really hasn't changed that much since XpW 1.
  • Teams that win average 51.11% Possession; losing teams average 48.89% Possession, (lower)
  • Teams that win average 76.39% in Passing Accuracy; losing teams average 74.10% (lower)
  • Teams that win average 20.48% Penetration in the Final Third based upon Total Passes completed; teams that lose average 20.32% (lower)
  • Teams that win average 18.64% Shots Taken per pass completed in the Final Third, losing teams average 19.22% (higher)
  • Teams that win average 42.67% Shots on Goal per Shot Taken; teams that lose 32.13% (lower) (by over 10%!)
  • Teams that win average 46.18 Goals Scored per Shot on Goal; losing teams 17.03% (lower) (by over 29%!)

Like after XpW 1 (102 Events - 51 games) losing teams shoot the ball more often, on average, but are less accurate when it comes to putting those shots on target and into the net.  Patience in creating quality continues to outweigh quantity...

Overall, the averages for Shots on Goal for winning teams has increased from XpW 1 (4.90) to XpW 2 (5.36); basically the better teams have gotten better and the losing teams have gotten worse (3.84 now) versus (4.10 in XpW 1).

I wonder how that trend will continue through the rest of this year?

Tthe 2% gap in Passing Accuracy between winning teams and losing teams has held from XpW 1 to XpW 2.

The gap in Shots on Goal has increased in losing teams to 10% as opposed to 9% (XpW 1).

The gap in Goals scored has remained near steady at roughly ~30%; though slightly smaller in XpW 2.

Losing teams still continue to take more Shots than winning teams; 12.74 (winning teams) to 12.80 (losing teams) but... that gap has dropped since XpW 1 - perhaps losing teams are looking to be more patient in their shot selection?

So how does the overall data relate in an Exponential Relationship?

Expected Wins 2 Trend-lines

Observations:

The light shaded lines are the lines of data as in XpW 1 - and the trend-line colors remain the same.

This time the R2 has dropped just a tad.98 to .95 - all things considered most would consider that correlation Rock Solid... I do - and the correlation of these data points, viewed as a whole, have a higher correlation together than Goal Differential (R2 = .88) to Points in the League Table.

Goal differential is usually a great indicator but it also remains a qualitative statistical indicator not a quantitative indicator.

Like last time there remains a difference in the R2 between winning teams, teams that draw, and losing teams; with draws now having greater correlation than wins.  Why?  I'm not sure - but as noted by the closeness of all the data points there still remains a fine line between winning, losing and drawing.

Last time I felt that helped explain the difference between mistakes or unlucky breaks - I continue to sense that is the main difference.  So might this be an indicator of luck - I don't know - what do you think?

I have seen discussions of late, on Telly, and in some articles written elsewhere, that focus more on 'space available' as opposed to just Shots Taken...  hopefully that trend continues!

I also remain hopeful that OPTA and other statistical web sites will offer up more critical events taking place in the Final Third...  One other article written since XpW 1 is my analysis (as promised in Xpw 1) on defensive indicators; here's a link to Hurried Passes and those details.

In closing:

I still don't have enough data, in my opinion, to offer additional thoughts on individual team performance relative to home and away games; that probably won't have statistical reliability until the midpoint of the season (game 323 - events # 646).

There are trends but I'll save that for another article, enough for now.

Best, Chris


How it Happened: Week Ten

Another weekend, another bunch of ones and zeroes on the scoreboards for the games I checked out. The season's a quarter done now for just about every team, and reality is starting to set in that playoffs are only going to be a dream for some this year. Still, MLS is a league of incredible parity and almost everyone still harbors dreams of the postseason, no matter how realistic they are at the moment.

Portland Timbers 1 - 1 LA Galaxy

Stat that told the story for both teams: 2 goals, 1 uncalled red card on a breakaway in 2nd half stoppage time

lapor10

It's nearly impossible to analyze this game without spending a bulk of your attentions on second half stoppage time, when both goals were scored. Not only that, but LA's Juninho had a breakaway chance to put the game away and was bundled over with no foul called. All in all, it was a pretty incredible conclusion to a game that was fairly entertaining, if not particularly well-played. To some degree, it was more of the same for both teams: the Galaxy struggled to finish the chances they were able to create, and Portland looked out of sorts and a little slow compared to last year's high-octane outfit.

I want to spend a paragraph here talking a little about the apparent tactical trends of the league at the moment. For the last couple years, it seemed like the formation en vogue was the high-pressing 4-3-3: Kansas City and Portland were the most notable success stories using this setup. But this year, it appears the trend has shifted to the 4-4-2 with a diamond midfield, a la Real Salt Lake. It seems like every team in the league has at least experimented with it this year, from LA to Colorado to DC. The MLSSoccer.com March to the Match podcast did a great feature on this tactical trend a few weeks back detailing some of the pros and cons of the formation.

Anyway, this game seemed like a pretty decent case study with these two formations facing off with one another: Portland's 4-3-3 against LA's diamond midfield. It's my opinion that the narrow diamond midfield does a great job of neutralizing what made the Timbers' 4-3-3 so effective last year - that's part of why RSL just seemed to have Caleb Porter's number last year. Portland was at their best last year mainly because of two guys: Diego Chara and Will Johnson, who played as a double pivot and covered more ground than the Trans-Pacific Railroad. However, the Galaxy's narrow midfield boxes that double pivot in with four central mids who are all tucked inside, limiting the number of balls Chara & Johnson can win and thereby limiting Portland's possession. There are plenty of other reasons the Timbers haven't been great so far this year, but it's a trend worth watching as they try to turn their season around.

Columbus Crew 0 - 1 Vancouver Whitecaps

Stat that told the story for Columbus: 90.33% of minutes this season have been played by starting eleven

It's no secret that Columbus started out this season like gangbusters and have since played more like busts. The reason for this is inherently simple: they only have one way of playing. Every single game from Columbus is basically the same: they play the same guys in the same roles and try the same things. It caught teams by surprise in the first few games, but now that the opposition knows what's coming (short passes out of the back, fullbacks getting way forward, etc.) it's gotten a lot easier to beat. And now it's up to coach Gregg Berhalter to make some adjustments and at least give the Crew a plan B so this losing skid doesn't continue.

Stat that told the story for Vancouver: average age of midfield and forward: 23 years old

Vancouver has sneakily been one of the surprise stories of the 2014 MLS season. Everyone knew they had a good deal of young talent on the squad, but nobody was sure how the chemistry would work out under first-year coach Carl Robinson. So far, returns have been impressive. Not only has Robinson set the team up in a position to be successful tactically, but he's handed over a ton of responsibility to the youngsters to great effect. With veterans Kenny Miller gone and Nigel Reo-Coker perhaps on the way out, even more of the load is going to be heaped onto the 25-and-under players. During this victory, the only midfielder or forward in the starting eleven over 25 was Pedro Morales (28). And even when they made subs, they brought on 20-year-old Omar Salgado and 21-year-old Russell Teibert - I'd say the future is bright in Vancouver.

Philadelphia Union 0 - 1 DC United

Stat that told the story for DC: wide presence of the forwards

dc10


It's interesting that a lot of season previews of DC United focused on if the wide play would be good enough to get quality service for new striker Eddie Johnson. I say this because DC has been as good, if not better, as anyone could've hoped, despite the presence of roughly zero wide midfielders and zero Eddie Johnson goals. There are obviously a few reasons they've been so good, but chiefly among them is that this is Fabian Espindola's team. He's played better this season than I ever remember him looking in Salt Lake as the focal point of United's attack, orchestrating everything and creating a lot of chances. He does this by floating to the wide areas of the field to provide some width to DC's narrow formation, as his heat map above shows (EJ's actually pretty good at this too, particularly when holding the ball up).

Stat that told the story for Philadelphia: 647,428 times caught ball-watching this season*

Philadelphia was everyone's darling in the first few weeks of the season. All their new acquisitions looked really impressive, they had a young and improving defense and some talent up top that was sure to start banging in the goals soon. Fast forward a couple months, and the bottom has fallen out. This loss was their ninth game without a win, they've switched formations like four times hoping for a spark, and their coach might get fired soon. So what's wrong? Lots of things. But #1 in my book is simply that the Union didn't seem that interested in playing soccer against DC this weekend. I can't tell you how many times I've seen Philly midfielders or defenders or really anyone just watch an opposing player run by them or pass the ball by them with little to no contesting. And this isn't a problem for one or two players, it's the entire team. Sorry to be such a rah-rah coach type who says they just need to try harder, but the Union need to be more active, or engaged, or try harder....whatever wording works best.

*this is only an approximation because I couldn't find Opta's information on this

MLS Week 11 My PWP-Pick-List - Can the Fire take 3 from Sporting?

Last week there were some outrageous results - Chivas taking three points in Colorado and Chicago taking three points in New York - wow - who'da guessed that? For me both were stunners - and if I don't mind saying - very timely, as was the San Jose 2-1 win versus FC Dallas...  all told I was five for 12 last week excluding the Canada Cup games.

So what's in store for this week and weekend?  Any preordained stunners to consider, hard to say, and with some star players moving to the USMNT camp soon there will be some teams working really hard to fill gaps.

For me - this is when a systematic approach brings value provided players minimize mistakes in critical areas.  Some teams, it seems, this year are being plagued by mistakes; two come to mind, the Portland Timbers and the Philadelphia Union.

Both teams are performing well in attacking and defending indicators, as a whole, but the results just aren't there - with the Timbers it's about individual mistakes and according to some the same can be said for Philadelphia.

And if you recall from my Expected Wins article, the line between winning, losing and drawing is really, really fine...

So forward into the season both Sporting and Philadelphia have two games this week; is your fantasy team set up to support that potential for more points?

Sporting KC at home to Philadelphia:  I'd expect this is a statement game for the Union - some members of the press have been rating the Union pretty low of late and their end results seem to support that - but end results aren't necessarily a reflection of a team gone bad; sometimes individual mistakes directly influence the game outcome and somtimes they don't.  However viewed one of the best teams in MLS, in both record and on-pitch performance, is Sporting KC.  Will Collin have the discipline to hold his yellow/red card tendencies in check - can Philadelphia score and prevent goals against.  At this stage, at this time the cards might be right for a stunner like Chicago had last week but I just don't see it happening - Sporting take three points...

Toronto at home to New York:  Is this a classic game of counter attacking for Toronto against a very possession and penetration oriented Red Bulls team?  I think so - and since the Red Bulls defending performance hasn't been the best this year there may be an issue for them in taking three points - but that's with the Reds having fresh legs - the Reds might be going all out in the Canada Cup game three days prior so when all said and done I'm seeing the Red Bulls beat the Reds...

Philadelphia at home to New England:  The games just don't get an easier for the Union as they take on the 2nd best team in the Eastern Conference three days after playing the top team in the Eastern Conference.  Some members of the paid media have been socializing how poor the Union have been in their winless run of late.  Is this another nail in that 'press/media' environment.  For the sake of good team performance I hope not but... when viewing New England so far this year they are also very strong in attack and defending across the pitch.  With all that said Edu will be missing and it's a short time span from Wednesday - tired legs versus fresh legs and no Edu.  In seeing the bad fortune of Philadelphia early this season a reasonable pick is the Revolution to take three points.  I'm not going to do that though - Philadelphia have strong team performances at home; better than the average team performances by the Revolution on the road - I submit Philadelphia takes three points...  perhaps a stunner pick but if mistakes are at a minimum for the Union they can win.

DC United at home to Montreal:  It would appear that the Montreal Impact and DC United have played role reversal this year.  I don't think I see Montreal taking three points against a much improved United - short analysis here - DC United take three points.

Chivas travel to FC Dallas:  Can the Goats pull off another stunner like they did in Colorado?  Wow... if they do poker goes up and Dallas doesn't.  I'm not inclined to think they do given how strong Dallas is in attack - that said they do prove, on occasion, that their central defending area is a bit weak...  All told I don't see Dallas losing - three points should be expected "and" taken here...

Houston at home to LA:  Star players will be missing and I submit the bigger stars will be missing from the Galaxy - not to diminish the great value Davis brings to the USMNT - on the contrary - I think the Houston bench can better support the loss of Davis - and at home to boot.  Houston wins...

Real Salt Lake at home to Colorado:  Can anyone actually beat Real Salt Lake - so far they are unbeaten this year and their internal team attacking and defending performance indicators don't do anything but get better.  Can they win with Saborio, Beckerman and Rimando missing?   Colorado may put up a good fight in this game especially since they were really out of sorts against Chivas - I'd like to pick a draw but won't...  teams don't go into a game looking to draw even though in this instance a draw might actually be what Mastroeni wants :).  With that I opine RSL wins...

Seattle at home to San Jose:  Dempsey and Evans are training at the USMNT camp as is Wondolowski - is Fucito likely to get a start with Wondo gone?  Don't know - but I think the Sounders can afford to replace their two stars a bit better than San Jose... not much else to offer up on this one - big stadium, big crowd and likely 3 big points for Seattle...

Portland at home to Columbus:  Bad form for Columbus of late - team performance has dropped since week 3 and I'm not sure the medicine for that is a trip to Portland and a win-starved Timbers team.  The big question here is the back-four for the Timbers; Harrington is injured still (I think) and ball watching seems to occur frequently at key points - well, every second is a possible key second - their only really key if the mistake leads to a goal.  In this case the ball watching last week was pretty bad - I doubt Porter was happy and it's likely the video and mental part of training was a big focus this week.  I'd expect Portland to come out focused and come out as winners... Timbers take three.

Chicago at home to Sporting KC:  Seems good fortune that Chicago entertain Sporting after the USMNT training starts - two key players out for Sporting and Opara injured means Olum and Collin are the likely pairing if Collin doesn't get another red card earlier in the week.  Chicago are coming off a huge win against a full strength Red Bulls - it's home and Harry Shipp is getting these guys into shape.  Not bad young lad, and Amarikwa has shown good skills as well...   upset for most, but I see the Fire taking three points here...

In closing - I was 5/12 last week (about 45% total so far in my picks) and took a right uppercut when Chivas, Chicago and DC got wins on the road. There's no sure thing in MLS as last week pointed out.  Perhaps fortune smiles more on the home teams this week.

Best, Chris


PWP: Chicago lights up New York while Montreal feels the Impact of Sporting KC

As noted in my headline, the Chicago Fire simply lit the fireworks with the youngster Harry Shipp leading the way; good for him and well done, son!  As for the new leader in Montreal--and ex-Fire coach--things weren't quite as rosy. You'll recall early last week I published this article on MLS Coaches - showing statistics, not pure speculation, on which coaches have teams that aren't performing to standard in MLS at this time.  Frank Klopas was one of those Head Coaches mentioned, and sadly his team was the only team in the bottom four of that list who didn't win this past weekend.

Mark Watson did with San Jose, Frank Yallop did in the obvious thriller in New York, and Wilmer Cabrera saw his Goats absolutely stun Colorado.  Sooner or later the wheat will separate from the chaff.

But back to Chicago.  They didn't take the PWP Attacking Team of the week by much; Sporting KC was a close second while Cabrera and the Goats were 3rd best and New England rounded out the top 4 with that blowout against Seattle.

PWP Attacking Player of Week #10 - Harry Shipp - surprised?  Not likely, for only the second time this year my PWP Attacking Player of the Week was the same as the MLS Player of the Week... as odd as it may sound I take pride in my PWP Players of the Week not matching those from MLSSoccer.com.

PWP ATTACKING PLAYER OF WEEK 10

A busy day for the young lad, and almost too much information to go into my standard PWP Player of the Week.

That said Sporting KC got back on track with another smashing win against Montreal.  And while they scored three goals what stood out most was their smothering defense; a leader in helping that effort was my PWP Defending Player of the Week; Chance Myers.

PWP DEFENDING PLAYER OF WEEK 10

Duly noted that some players had some superb passing statistics in this game; here's a diagram of all the successful passes for Sporting against a hapless Montreal side... and even more intriguing is this diagram (also from the OPTA Chalkboard) of all the unsuccessful passes by Sporting.  WOW!  Not sure I've ever seen so sparse a chalkboard as that for unsuccessful passes!

In looking at the defensive side of the pitch Montreal offered up 45 total passes in the Sporting defending third - of which nine were throw-ins... in the area here (just atop the 18 yard box) Montreal had 5 unsuccessful passes and 3 successful passes with two of those successful passes being throw-ins.

Moving on... So this week who's top and who's not in Possession with Purpose after 10 full weeks of play in MLS?

PWP COMPOSITE INDEX THROUGH WEEK 10

As a reminder, the top five Western Conference teams in the End-of-Season PWP Composite Index were the top five Western Conference teams to make the Playoffs.  In addition, the top five Eastern Conference Teams in the same Index were the top five Eastern Conference teams to make the Playoffs.

Last year's Champion has finally reached the top spot; will they be able to hold on?  I don't know, but still-unbeaten Real Salt Lake has shifted from 7th to 4th this week.

Columbus is starting their painful drop while Seattle, LA, and FC Dallas hover, and New England continues to push higher.

What is unique about this Index is it's not influenced by the "next bright and shiny object" syndrome.  Teams will fade and teams will push higher, but not on a whim; I hate whims...

With respect to the bottom teams in this Index - there is no question that the worst performing team in MLS is Montreal.  I'm not sure how anyone can consider their pathetic team output - across all categories measured - anything other than worst.  

Chivas got a notable win, but one win does not a streak make - falling a bit further this week was Toronto - moving from 6th worst to 4th worst.  Are some other teams in MLS catching on to that 'mistake driven' football that Nelson might be working towards?

Hard to say, but with some MLS stars moving off to prepare for the World Cup, there will definitely be important lineup change, and possible some big changes to this Index in the next six weeks.

In closing:

Another busy week coming with the Canada Cup Championship plus two more games for Sporting and Philadelphia.

Two diagrams for your consideration:

PWP ATTACKING INDEX THROUGH WEEK 10

This is the Cumulative PWP Attacking Index after week 10.

Note that the separation between the top attacking team (FC Dallas) and the 10th best attacking team (Vancouver) is 2.4984 - 2.3365 = .1619.  So when you see the overall Composite Index there really isn't that much that separates the tenth place attacking team from the 1st place attacking team...

However, small movement is still expected given that a number of teams will be without some key players for at least 5 weeks - we can hope for more for the USMNT's sake.

PWP DEFENDING INDEX THROUGH WEEK 10

This information reflects how well the combined opponents of these teams performs in the Defending PWP.

In looking at the diagram what the last place team offers is that the opponents of Chicago Fire, by and large, possess the ball, pass the ball, penetrate with the ball, take shots with the ball, and score with the ball more than Chicago does... if that trend continues it is likely that Chicago will have a very poor record by the end of the season.

In considering Philadelphia for a minute - they are in the bottom half but they are not being dominated by their opponents - sometimes games won and lost or drawn end up being more about a single mistake or... multiple mistakes as opposed to poor team performance.  It's data like this that tells me, as an analyst, that Hackworth has a reasonable system and plan - its' just not working because something on the pitch is broken.

I think many would offer that is the same case for Portland this year - most know that 5 points were lost due to PK's early this year, and perhaps three points were lost this past Sunday when some players simply forgot that they were soccer players and instead decided to be ball watchers...

All for now, Chris

ASA Podcast XLVI: The One Where We Talk World Cup 30-Man Roster

Hey, we're back... just like that we have two podcasts (not one, but two!) in less than seven days. This one is a special edition, as Jurgen Klinsmann announced his USMNT 30-man preliminary roster for the World Cup yesterday. In response, Matt Hartley and I decided to record a podcast. The result is brilliant, and you should listen. [soundcloud url="https://api.soundcloud.com/tracks/149278254" params="color=00cc11&auto_play=false&hide_related=false&show_artwork=true" width="100%" height="166" iframe="true" /]

MLS Head Coaches: Leveraging PWP Analysis on Performance

I promised this year, at various times, to offer some thoughts about how Possession with Purpose can be used to support analysis on how well Head Coaches might be performing compared to others. As a reminder from last year; five of the bottom six teams in my PWP Composite Index had coaching changes, Columbus, Chicago, San Jose, Toronto, Chivas USA, and then after an early exit from the Playoffs; Montreal.  Other teams making changes included Vancouver, Colorado and FC Dallas and the depature of Kreis for NYCFC. All told, a total of 10 teams made changes in Head Coaches for one reason or another.

Will this year have similar results, and if so, who?  I don't claim to prognosticate coaching changes and the firing of Head Coaches, but changes happen, and last year's information, relative to the bottom six teams in my Composite PWP Index, is pretty compelling at first glance.

So after reading an article offered up by Jason Davis at ESPNFC "Three MLS coaches on the hot seat," plus releasing my article earlier this week on Crosses offered in MLS, I figured the timing was pretty good for my first installment.

Here's some of my initial information for consideration on "system of attack":

  1. For home games Frank Klopas, Mark Watson and Frank Yallop-led teams are the top three in MLS that offer up more crosses per pass attempted in the final third.
  2. For away games Klopas, Watson, Yallop and Wilmer Cabrera-led teams are the top four teams in MLS that offer up more crosses per pass attempted in the final third.
  3. The relationship of taking points, at home, in the MLS is (-.70) for teams that cross the ball more frequently than others. In other words, the teams who cross the ball the most are more likely to lose points (at home) than teams that don't.
  4. The same relationship of taking points in away games holds as well (less at -.37). but still the same logic - the more crosses a team offers in away games the more likely they are to drop points.
  5. Bottom line is these four teams are less likely to win at home or on the road given their current system of attack in the Final Third.

In other words, these teams led by these head coaches use a system of attack that simply doesn't get positive results on a regular basis in MLS; or... these teams, led by these head coaches and general managers don't have the right players to execute that system of attack in MLS.

So how does Sporting KC do it? They are a team that offers up the 7th-most crosses at home and the 5th most crosses on the road, yet they are winning using that system of attack.

Why? I think it's because their GM and head coach, collectively, are getting the right players to play to that system of attack.

So how about overall Team Attacking and Defending performance  (Team Positions in my Composite PWP Index) after nine weeks in: (1) Possession, (2) Passing Accuracy, (3) Penetration into the Final Third, (4) Creating and Taking Shots, (5) Putting Shots on Goal, and (6) Scoring Goals?

After Week nine, four of the five worst performing teams in MLS, in these categories are:

  • Chivas USA (19th out of 19),
  • Montreal Impact (18th out of 19),
  • Chicago Fire (17th out of 19), and
  • San Jose Earthquakes (15th out of 19).

In case you missed it in an earlier article on Expected Wins - the correlation of those data points as a whole is .99 (R-squared); the closer to "1" the better and stronger the relationship.

In other words that means that the relationship of those data points is pretty much rock solid, and that it's a worthy indicator (outside of points in the league table) for objectively evaluating team (attacking and defending) performance.

So while Jason Davis indicates John Hackworth and Caleb Porter as being potential candidates for hot seat discussions, actual evidence available indicates those names don't belong there. Indeed, there are other teams performing, as a whole, much worse than Philadelphia or Portland.

Three teams performing worse at this time include Chivas USA, Houston and Toronto, while Vancouver is behind the power curve compared to Philadelphia and slightly ahead of Portland.  By the way, this is not to say John Hackworth might not belong in a list a bit later this year - but for now I think it is highly speculative to even put in print that he's a potential hot seat candidate.

And with respect to Caleb Porter - it does seem, at times, that writers outside of the Portland area speculate and use the Timbers large supporter base to artificially increase readership in some of their articles... just saying. As a writer covering the Timbers here in Portland, reading the idea that Caleb Porter is on some sort of hot seat is (softly voiced) bollocks. But that's just me...

In closing:

Given the evidence offered, does it seem reasonable that those four Head Coaches and their associated GM's are worthy of a "Hot Seat" distinction? I think so...

Winning styles come in all shapes and sizes - the critical piece is having the right players to support that effort, and the time to install the system. Klopas, Cabrera, Yallop and Watson all know more about football than I do.

And it's not my place, nor is it the place of any soccer writer (in my opinion) to pass judgment on whether or not someone should get fired or hired.

But... objective evidence indicates that those four teams, compared to others, lack an effective attacking system of play, lack strong overall team performance in attacking and defending while also lacking the most important measuring stick - points in the league table.

I'm sure this is not new, nor rocket science, to those head coaches, general managers, or owners... but... (perhaps?) it is helpful to others.

Best, Chris

You can find Chris on twitter @ChrisGluckPWP

ASA Podcast: Episode XLV

Well, after a bit of a hiatus the podcast is back. I sit down with Jacob, aka @MLSAthiest, and we have a conversation about an assortment of (mostly) MLS-related topics. A slight note on the podcast itself, I tweaked the format and presentation ever so slightly, and I would love a bit of feed back on it--good or bad. I hope you enjoy it! [soundcloud url="https://api.soundcloud.com/tracks/148465574" params="color=00aabb&auto_play=false&hide_related=false&show_artwork=true" width="100%" height="166" iframe="true" /]

Calculating Expected Goals 2.0

I wrote a post similar to this a while back, outlining the process for calculating our first version of Expected Goals. This is going to be harder. Get out your TI-89 calculators, please. (Or you can just used my Expected Goals Cheatsheet). Expected Goals is founded on the idea that each shot had a certain probability of going in based on some important details about that shot. If we add up all the probabilities of a team's shots, that gives us its Expected Goals. Our goal is that this metric conveys the quality of opportunities a team earns for itself. For shooters and goal keepers, the details about the shot change a little bit, so pay attention.

The formulas are all based on a logistic regression, which allows us to sort out the influence of each shot's many details all at once. The formula changes slightly each week because we base the regression on all the data we have, including each week's new data, but it won't change by much.

Expected Goals for a Team

  • Start with -0.19
  • Subtract 0.95 if the shot was headed (0.0 if it was kicked or othered).
  • Subtract 0.74 if the shot was taken from a corner kick (by Opta definition)
  • Subtract one of the following amounts for the shot's location:
    Zone 1 - 0.0 Zone 2 - 0.93 Zone 3 - 2.37 Zone 4 - 2.68 Zone 5 - 3.55 Zone 6 - 3.06

Now you have what are called log odds of that shot going in. To find the odds of that shot going in, put the log odds in an exponent over the number "e". 

Finally, to find the estimated probability of that shot going in, take the odds and divide by 1 + odds.

Example: Shot from zone 3, header, taken off a corner kick:

-0.19 - 0.95 - 0.74 - 2.37 = -4.25

e^(-4.25) = .0143

.0143 / (1 + .0143) = 0.014 or a 1.4% chance of going in.

A team that took one of these shots would earn 0.014 expected goals.

Expected Goals for Shooter

  • Start with -0.28
  • Subtract 0.83 if the shot was headed (0.0 if it was kicked or othered).
  • Subtract 0.65 if the shot was taken from a corner kick (by Opta definition).
  • Add 2.54 if the shot was as a penalty kick.
  • Add 0.71 if the shot was taken on a fastbreak (by Opta definition).
  • Add 0.16 if the shot was taken from a set piece (by Opta definition).
  • Subtract one of the following amounts for the shot's location:
  1. 0.0
  2. 1.06
  3. 2.32
  4. 2.61
  5. 3.48
  6. 2.99

Now you have what are called log odds of that shot going in. To find the odds of that shot going in, put the log odds in an exponent over the number "e". 

Finally, to find the estimated probability of that shot going in, take the odds and divide by 1 + odds

Example: A penalty kick

-0.28 + 2.54 - 1.06 = 1.2
e^(1.2) = 3.320
3.320/ (1 + 3.320) = 0.769 or a 76.9% chance of going in.
A player that took a penalty would gain an additional 0.769 Expected Goals. If he missed, then he be underperforming his Expected Goals by 0.769.

Expected Goals for Goalkeeper

*These are calculated only from shots on target.

  • Start with 1.61
  • Subtract 0.72 if the shot was headed (0.0 if it was kicked or othered).
  • Add 1.58 if the shot was as a penalty kick.
  • Add 0.42 if the shot was taken from a set piece (by Opta definition).
  • Subtract one of the following amounts for the shot's location:
  1. One) 0.0
  2. Two) 1.10
  3. Three) 2.57
  4. Four) 2.58
  5. Five) 3.33
  6. Six) 3.21
  • Subtract 1.37 if the shot was taken toward the middle third of the goal (horizontally).
  • Subtract 0.29 if the shot was taken at the lower half of the goal (vertically).
  • Add 0.35 if the was taken outside the width of the six-yard box and was directed toward the far post.

Now you have what are called log odds of that shot going in. To find the odds of that shot going in, put the log odds in an exponent over the number "e". 

Finally, to find the estimated probability of that shot going in, take the odds and divide by 1 + odds

Example: Shot from zone 2, kicked toward lower corner, from the run of play.

1.61 - 1.10 - 0.29 = 0.22 e^(0.22) = 1.246 1.246/ (1 + 1.246) = 0.555 or a 55.5% chance of going in. A keeper that took on one of these shots would gain an additional 0.555 Expected Goals against. If he saved it, then he would be outperforming his Expected Goals by 0.555.

Frequently Asked Questions

1. Why a regression  model? Why not just subset each shot in a pivot table by its type across all variables?
I think a lot of information--degrees of freedom we call it--would be lost if I were to partition each shot into a specific type by location, pattern of play, body part, and for keepers, placement. The regression gets more information about, say, headed shots in general, rather than "headed shots from zone 2 off corner kicks," of which there are far fewer data points.
2. Why don't you include info about penalty kicks in the team model?
Penalty kicks are not earned in a stable manner. Teams that get lots of PK's early in the season are no more likely to get additional PK's later in the season. Since we want this metric to be predictive at the team level, including penalty kicks would cloud that prediction for teams that have received an extreme number of PK's thus far.
3. The formula looks quite a bit different for shooters versus for keepers. How is that possible since one is just taking a shot on the other?
There are a few reasons for this. The first is that the regression model for keepers is based only on shots on target. It is meant only to assess their ability to produce quality saves. A different data set leads to different regression results. Also, we are now accounting for the shooter's placement. It is very possible that corner kicks are finished less often than shots from other patterns of play because they are harder to place. By including shot placement information in the keeper model, the information about whether the shot came off a corner is now no longer needed for assessing the keeper's ability.
4. Why don't you include placement for shooters, then?
We wish to assess a shooter's ability to create goals beyond what's expected. Part of that skill is placement. When a shooter has recorded more goals than his expected goals, it indicates a player that is outperforming his expectation. It could be because he places well, or that he is deceptive, or he is good at getting opportunities that are better than what the model thinks. In any case, we want the expected goals to reflect the opportunities earned, and thus the actual goals should help us to measure finishing ability to some extent.


How it Happened: Week Nine

Welcome to my few-days-old review of the weekend in MLS, where I recap three games that I watched in their entirety (well, usually) by picking a stat or Opta image that tells the story of the game for each team. This week I fell short of my usual three games, and I apologize to the legions of Red Bulls and FC Dallas fans who will no doubt be disappointed to read the following paragraph. FC Dallas 0 - 1 New York Red Bulls

Stat that told the story for both teams: 26 minutes for which I was able to watch this game

This game was hideous. Not necessarily soccer wise: Thierry Henry will be fun to watch when he's pushing a walker around on opposing half, and this was a very competitive match, from what I saw. But I couldn't even make it past 26 minutes of this game before I had to give up and turn it off. Between Je-Vaughn Watson's karate kick of Tim Cahill, the referee's less-than-stellar control of the game, and players, fans and coaches alike going insane showing their indignation at every whistle, it was absolutely painful.

Sporting Kansas City 2 - 0 Columbus Crew

Stat that told the story for SKC: the ability to switch the ball in one pass

skc9

First, an aside: re-capping the national TV game from NBCSN is next to impossible, but for a good reason. Kyle Martino on the broadcast team does such a fantastic job breaking down the tactics of the match, that it's incredibly difficult for me to pick out anything that hasn't been said yet. So I'm going to just roll with something he mentioned, and that Matthew Doyle also mentioned in his weekly column. One of the major differences between KC and Columbus is Matt Besler's ability to switch the field of play with one ball. It's an ability that led straight to the first goal (buildup pictured above according to Opta), and it's one that USMNT fans have to hope pays off in the World Cup. Columbus, for all their admirable qualities, don't really have a player with the quality to hit that ball. Federico Higuain can do it, and Wil Trapp will from time to time, but with SKC if it isn't Besler switching fields, it's Graham Zusi or Benny Feilhaber or Seth Sinovic. All in all, they're just a more complete team at the moment.

Stat that told the story for Columbus: Jairo Arrieta's actions

clb9

There's one other really big difference between the Crew and Sporting KC that spells out why Columbus doesn't measure up, at least not yet. Jairo Arrieta plays as a lone striker for Columbus. This probably isn't the greatest role for him, because he's at his best when combining with others. Sometimes this works well with him and Higuain, but sometimes (like Sunday), he ends up isolated and completely ineffective. Seriously, his action that was closest to the goal against SKC was still about 30 yards away from the endline. The Crew did have some solid moves, generally involving Josh Williams overlapping and sending in a dangerous cross, but the lack of a quality striker really did Columbus in.

Chivas USA 1 - 4 Houston Dynamo

Stat that told the story for Houston: interchanging midfield in the new formation

hou9

I'm gonna play a little trivia game here and see if you can guess which heat map belongs to which midfielder from Sunday's game for Houston. The telecast called Dom Kinnear's formation a 4-3-3, but it looked a whole lot like a 4-1-4-1 to me, taken straight out of Jay Heaps' playbook from last season. I really liked the move: the Dynamo have multiple midfielders who can tuck in or pose a threat out wide, and Giles Barnes and Will Bruin just haven't worked well together up top. So, might as well drop Barnes into the midfield. It was only Chivas, but the early returns were pretty tough to argue with: the midfield dominated every facet of the game from winning balls to creating chances. We'll see if the Dynamo stick to the formation, but I liked the innovation from Kinnear. By the way, the answer from top left to bottom right: Davis, Garcia, Driver, Barnes, Carrasco.

Stat that told the story for Chivas: first half midfield struggles: 16/19 recoveries/interceptions in their own half

I've written about Chivas a few times in recent weeks, focusing mostly on the midfield. Against the LA Galaxy, they got run over and never stood a chance. Against San Jose, they held their own and really made it a game (seeing the Quakes' struggles against Vancouver this weekend makes that seem like less of an accomplishment). Against the Dynamo on Sunday, it was back to getting run over. The five midfielders put together a total of 19 recoveries + interceptions in the first half, but 16 of them were in their own half and the other three were miles from the attacking goal. Basically, the Goats couldn't make up any ground and just got pushed around by the more talented Houston midfield. On the bright side: the second half started better, until another goalkeeper red card finished off any Chivas hopes at a comeback.