
Home
American Soccer Analysis
This is a site for the objective analysis of Major League Soccer and U.S. Soccer
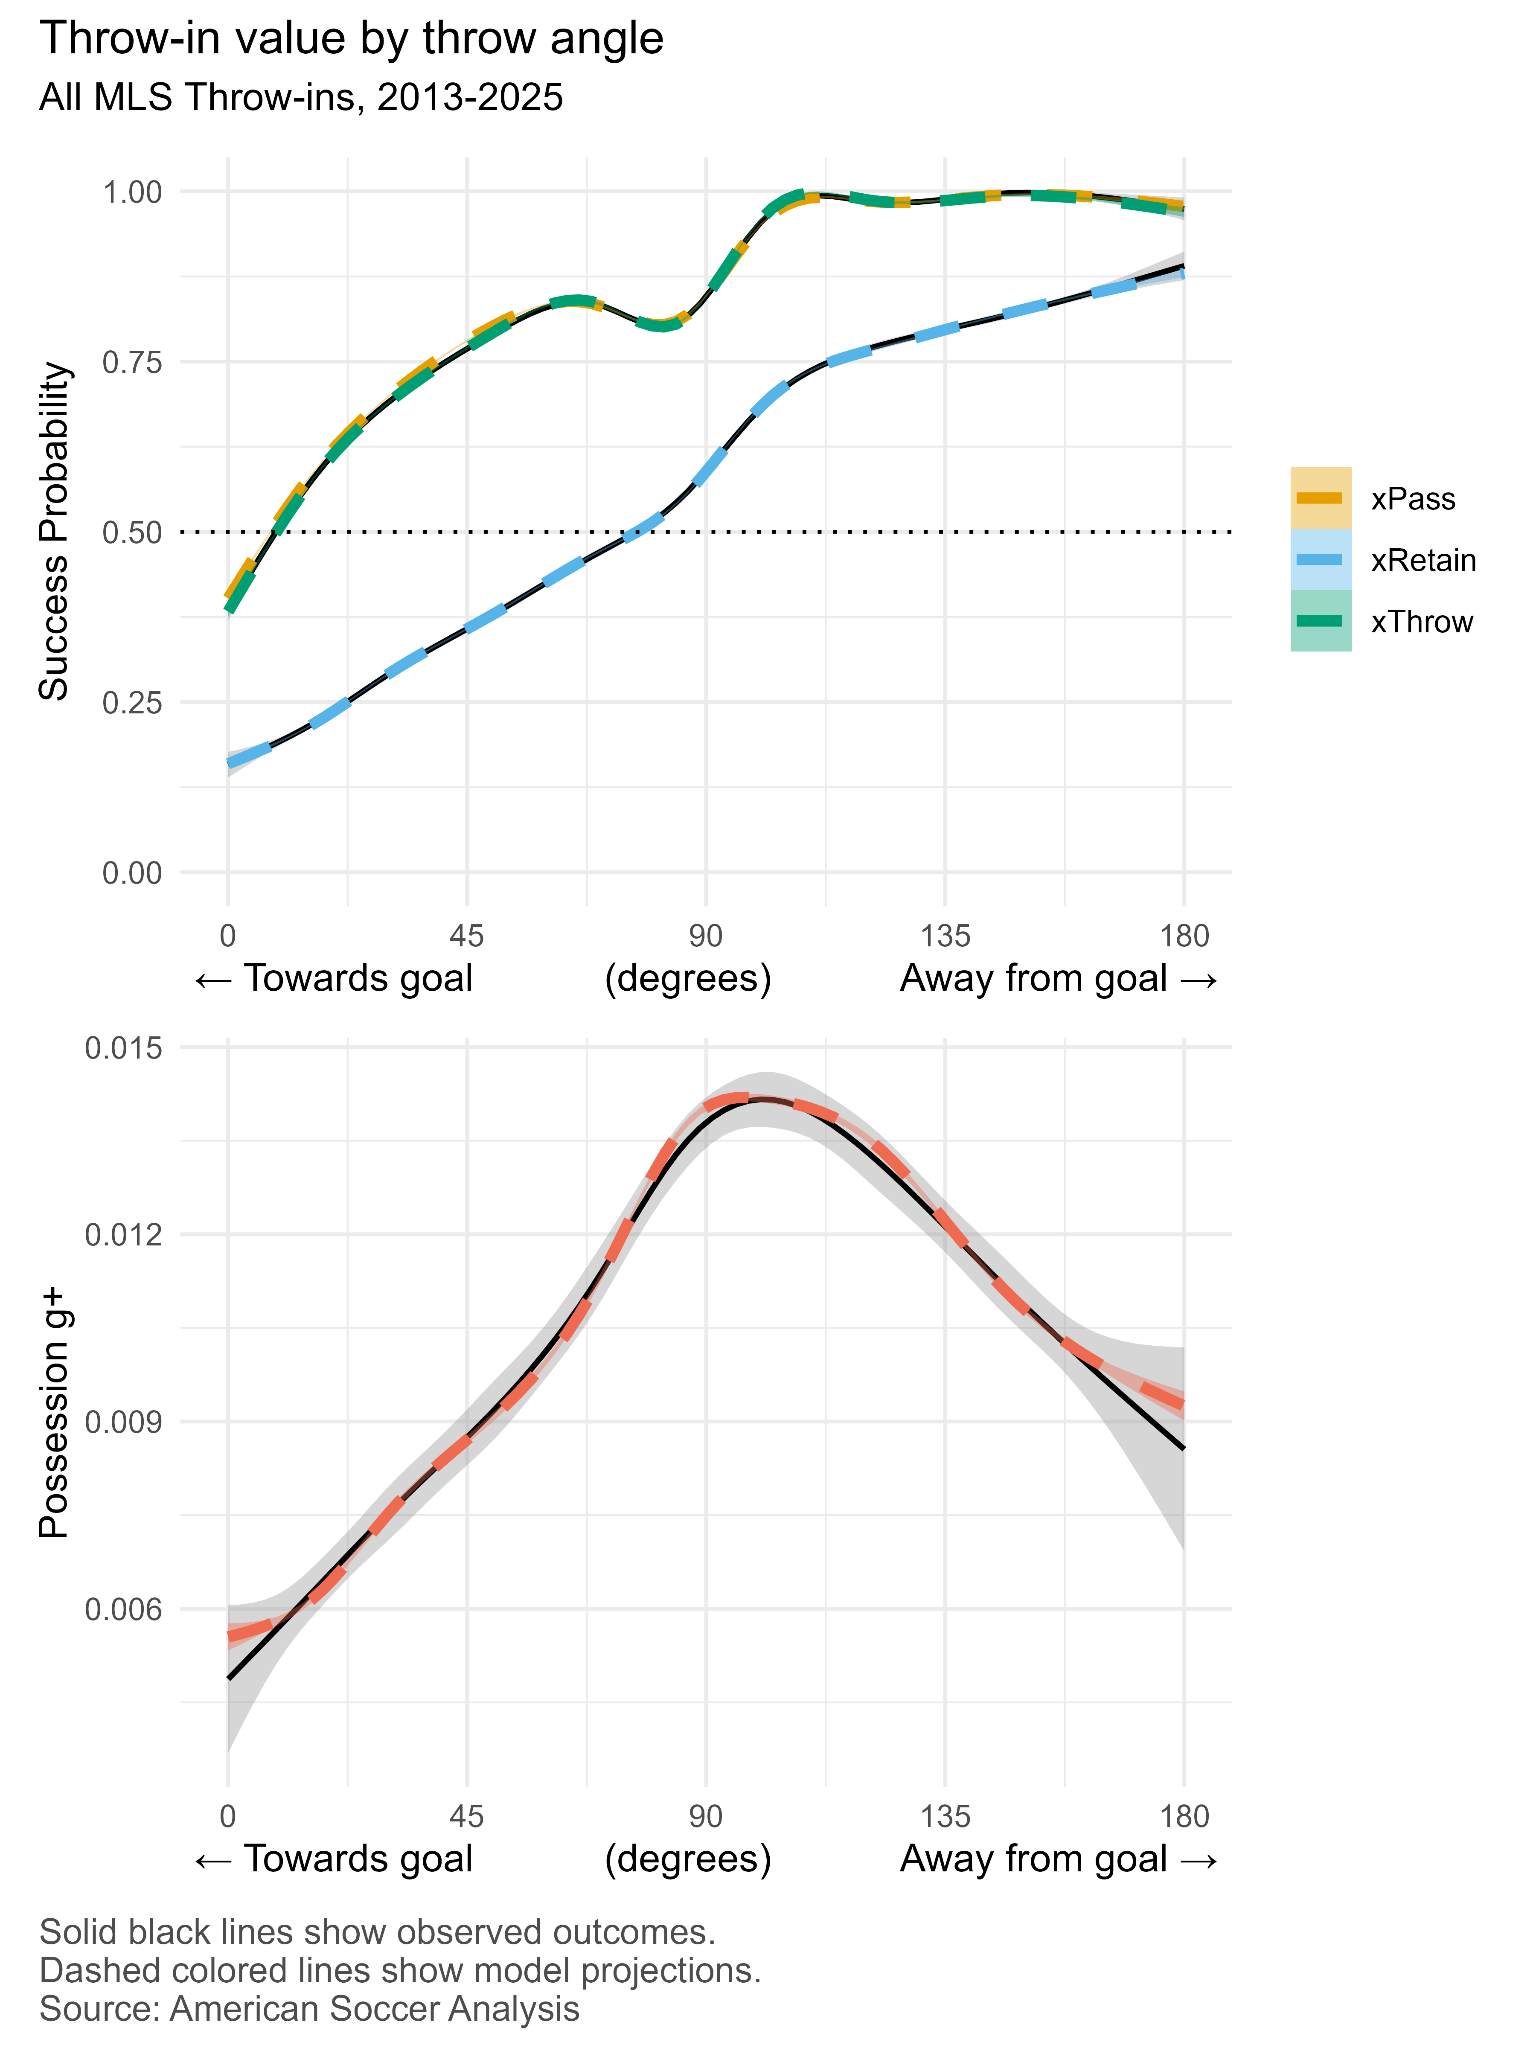
Whether you love long attacking throw-ins or hate them, there is no denying that they’ve become both a key feature and flashpoint in men’s soccer in the past year. John Muller likely sparked a renaissance of the tactic (and a soon-to-be Arsenal title) with his 2023 article for The Athletic, and Joe Lowery and I borrowed his method for Backheeled when Minnesota United started longthrowmaxxing in 2025 (Editor’s note: Minnesota work with Mike Imburgio through ASA’s firewalled consulting arm). But while each game has about 40 throw-ins on average, only about 10 of those throws happen close enough to reach the box. But apart from Formerly Called Twitter jokes about consultant Thomas Grønnemark, there hasn’t been much commentary about all the other ones in popular media or public analytics circles. The only exceptions I’m aware of are Eliot McKinley’s 2018 two-part opus on this very website, and some recent academic work on the top 5 European leagues that, if you like in-text citations and interpreting regressions, is an excellent spoiler for the rest of this article.
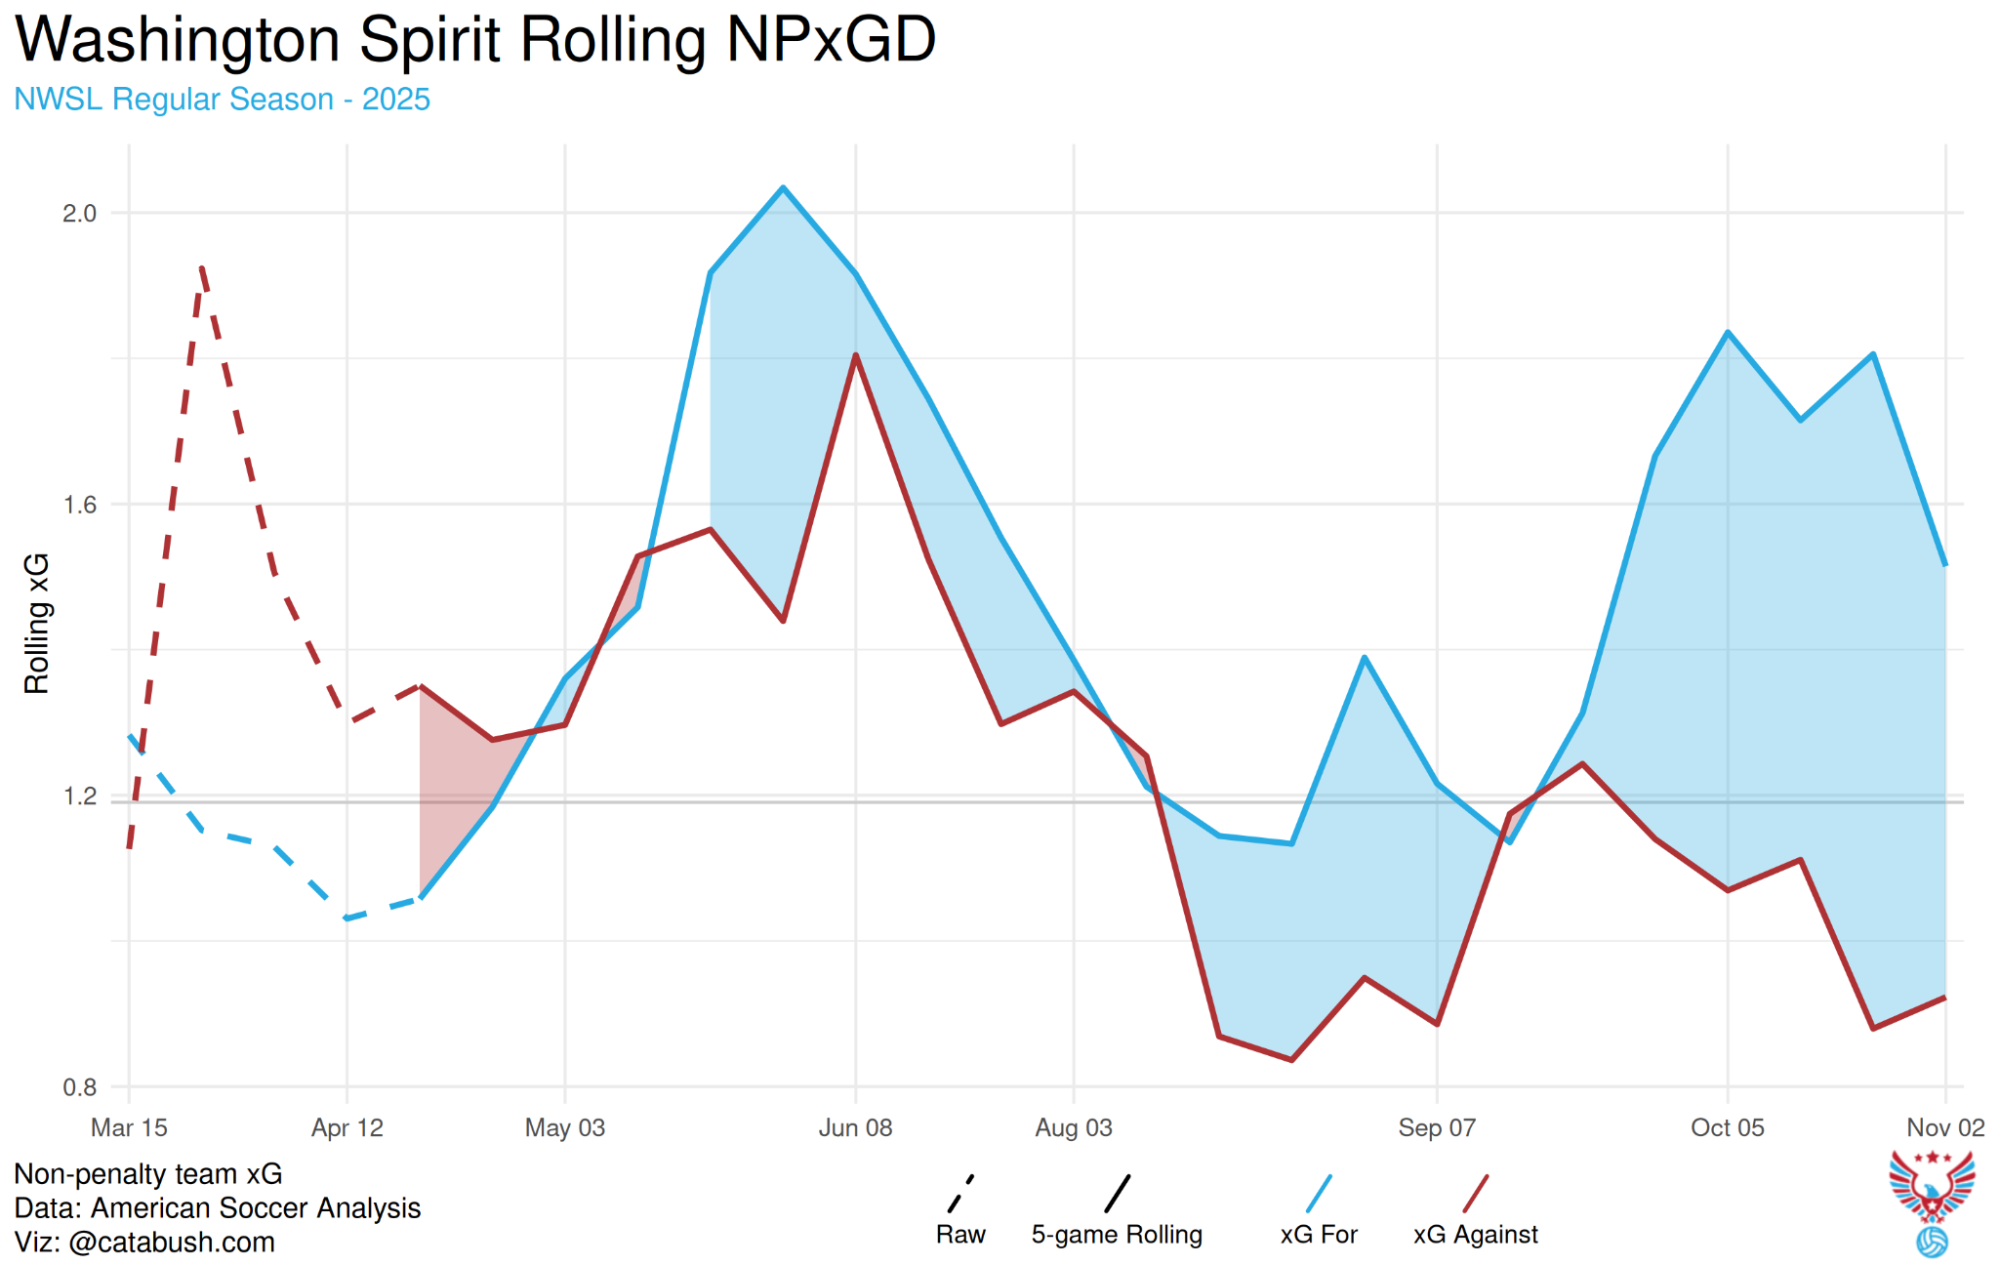
Our 2026 NWSL Season Previews have started and today we hit the Washington Spirit and NJ/NY Gotham. If you want to support this coverage of the league, you can head to our Patreon. For $5 a month you can get access to a lot of the data visualization tools we use to make these previews.
If you’re more of an audio person, our friends at Expected Own Goals spoke to Riss Willett of Shea Butter FC to talk Spirit, and Jenna Tonelli of Sports Illustrated on Gotham, available wherever you get your pods. If you want to support them, you can head to their Patreon.
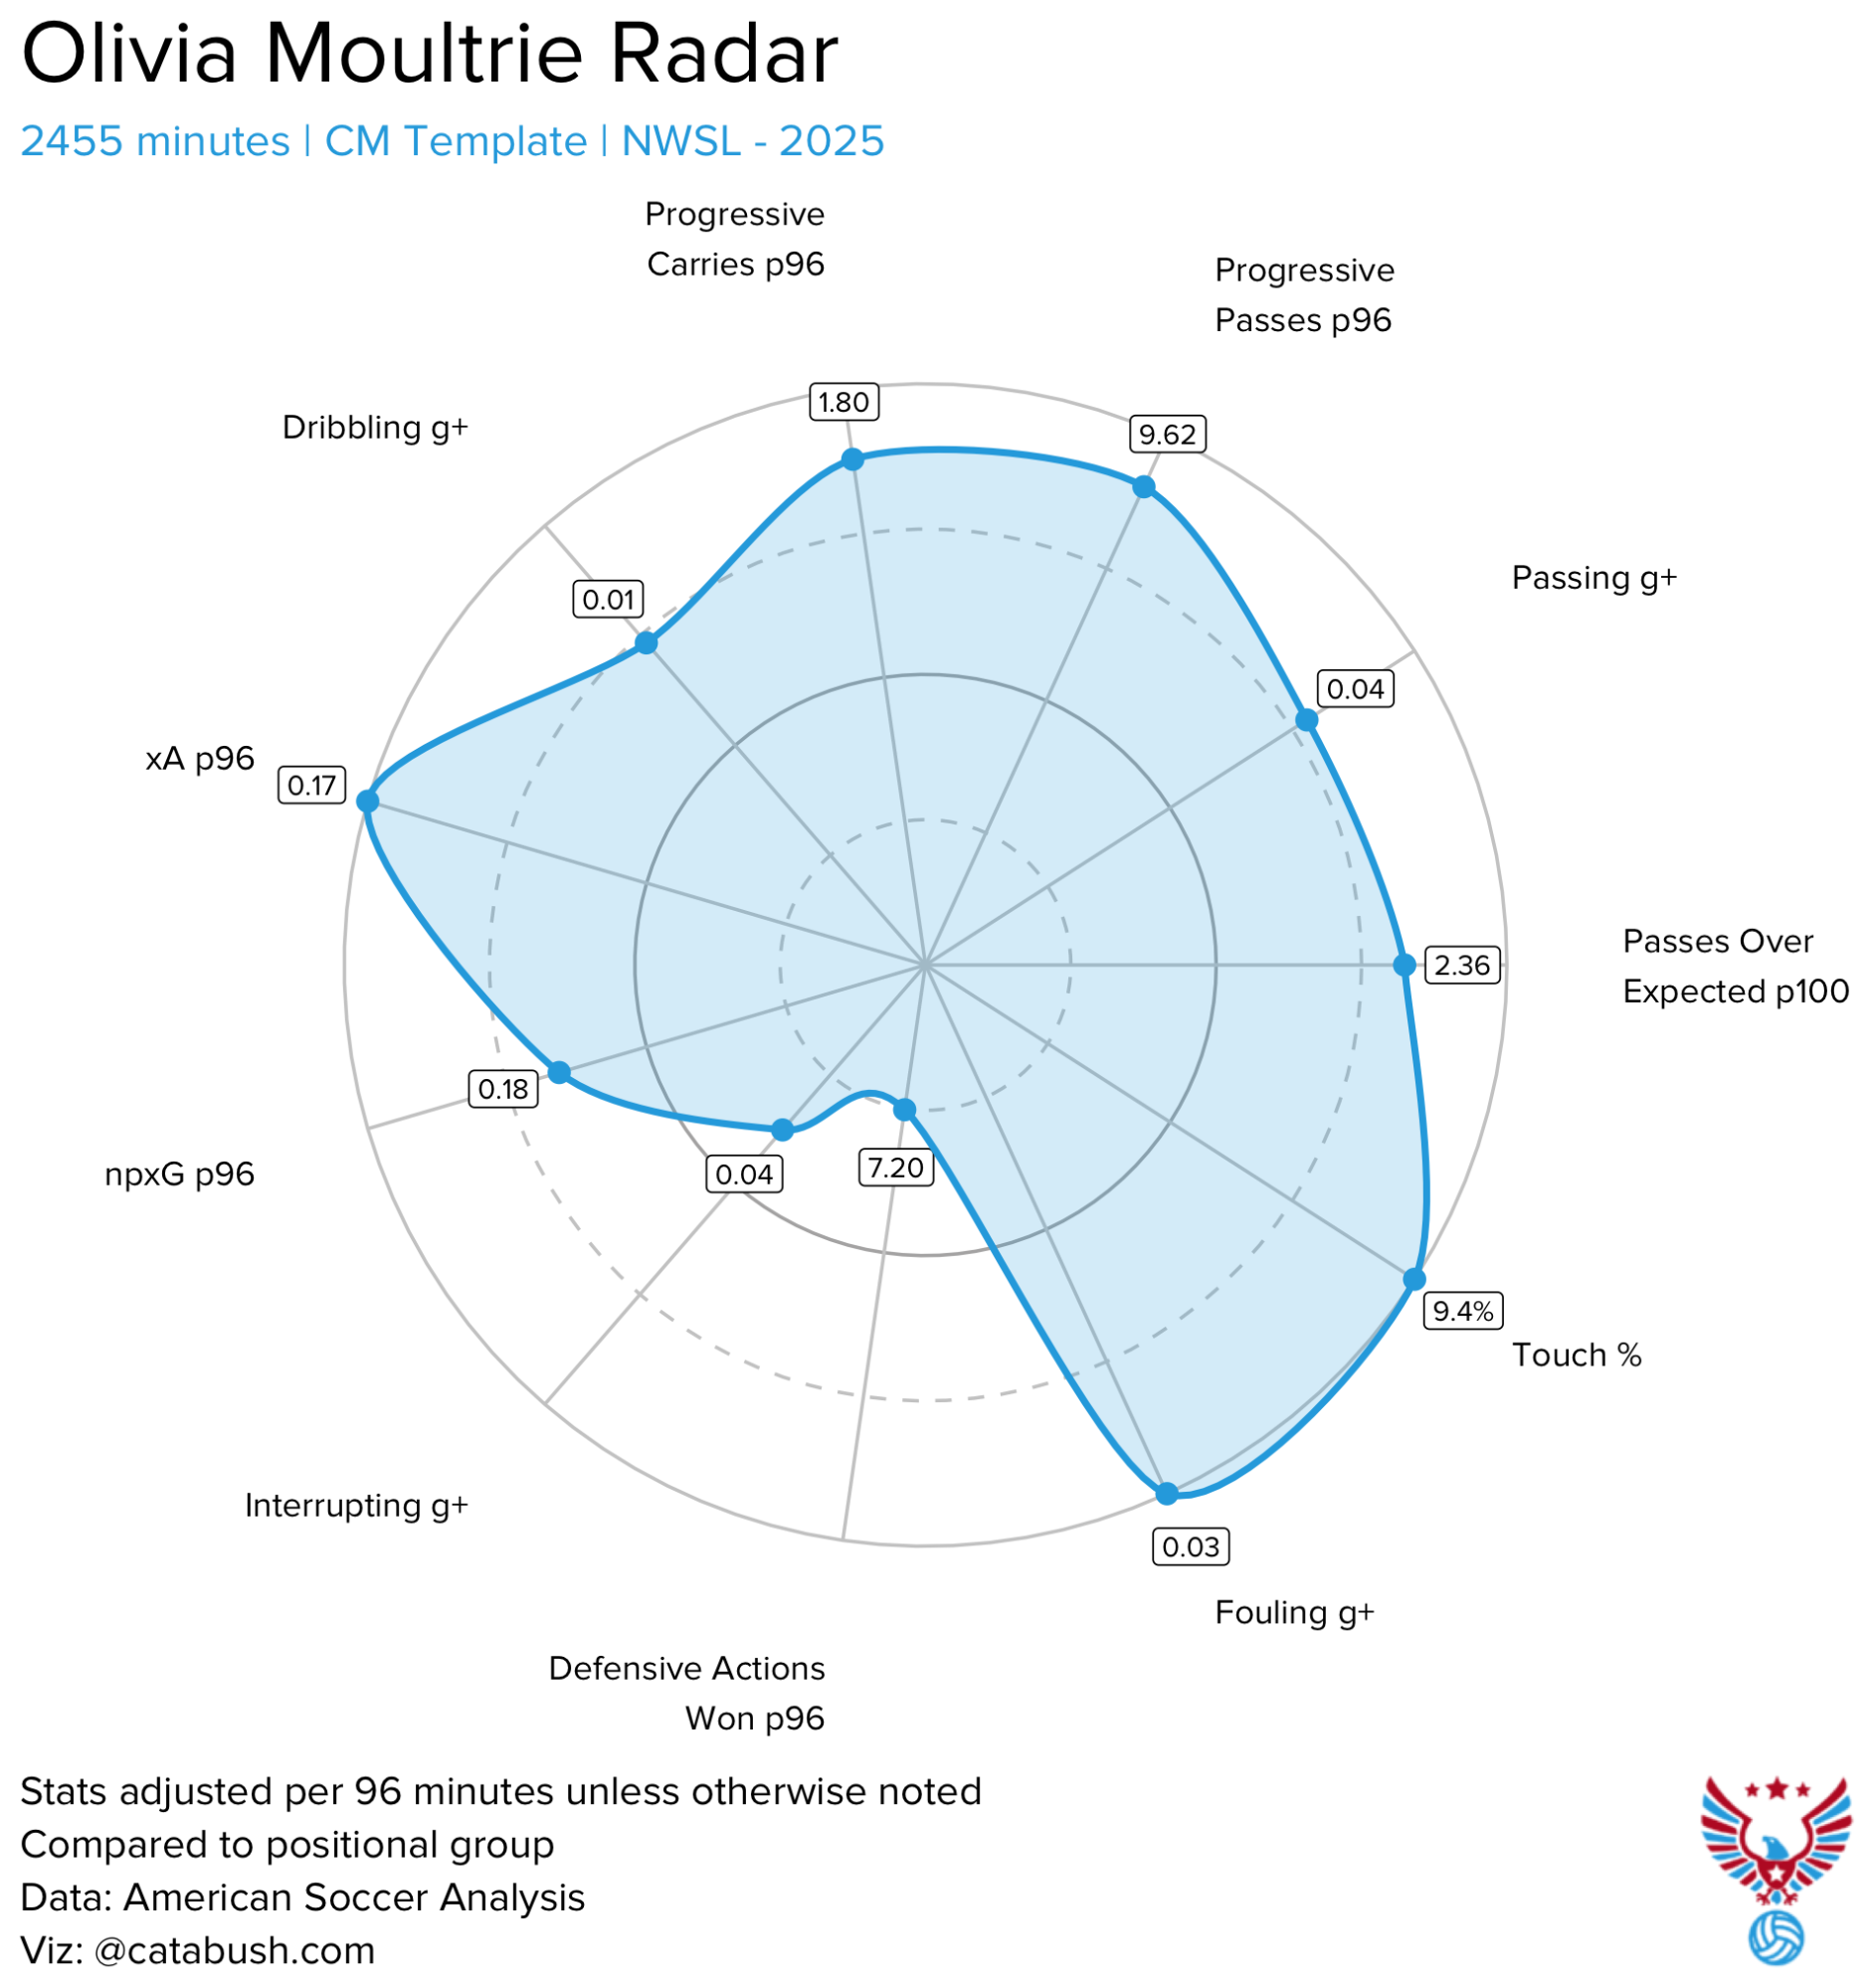
Our 2026 NWSL Season Previews have started and today we hit Portland and KC.. If you want to support this coverage of the league, you can head to our Patreon. For $5 a month you can get access to a lot of the data visualization tools we use to make these previews.
If you’re more of an audio person, our friends at Expected Own Goals spoke to Phuoc Nguyen from Stumptown Footy to talk Portland, and Cindy Lara from the KC Sports Journal on the Current, available wherever you get your pods. If you want to support them, you can head to their Patreon.
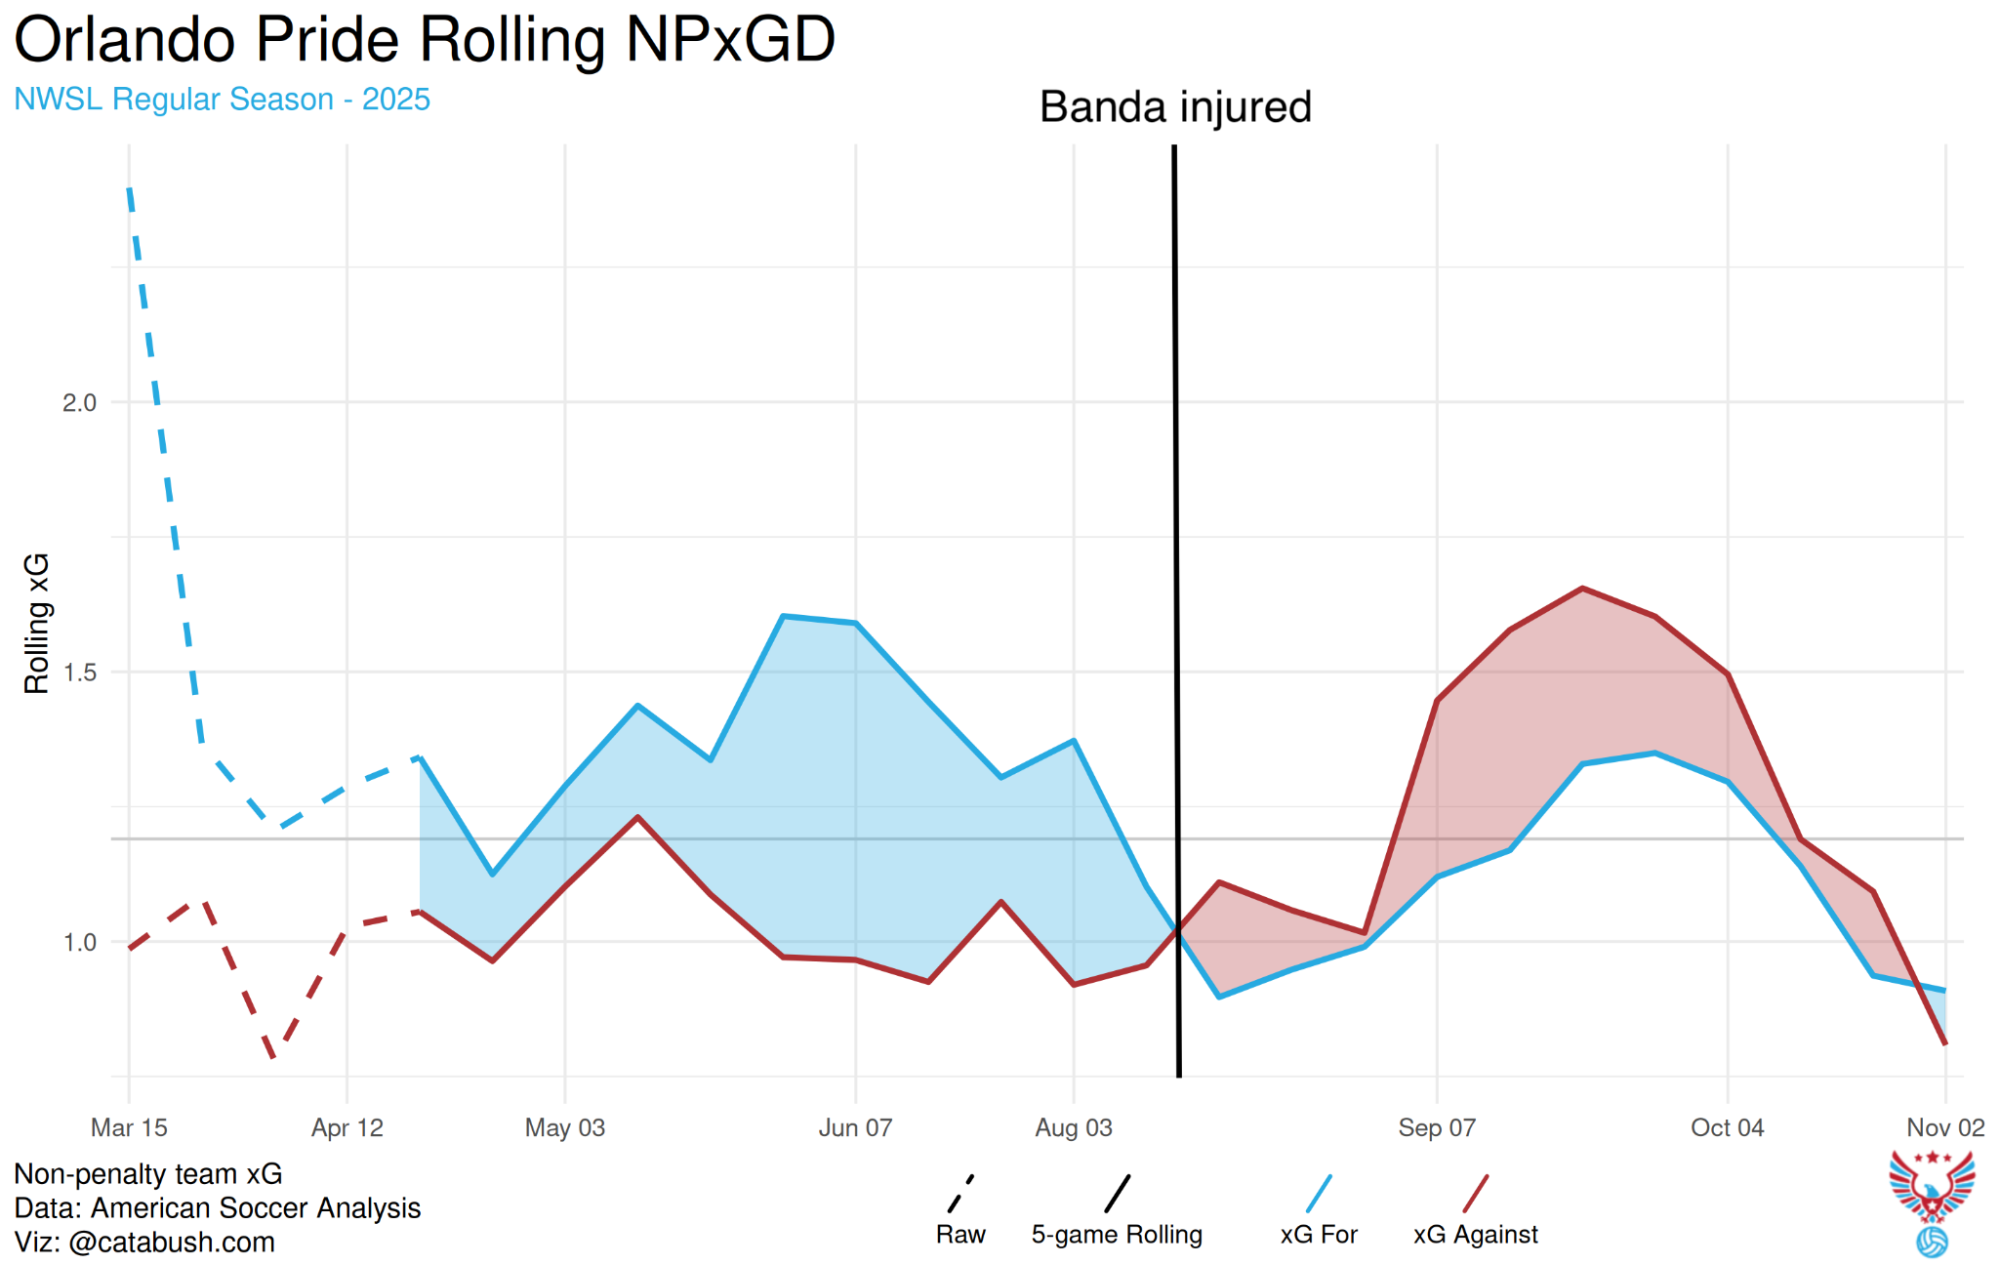
Our 2026 NWSL Season Previews have started and today we hit Seattle and Orlando. If you want to support this coverage of the league, you can head to our Patreon. For $5 a month you can get access to a lot of the data visualization tools we use to make these previews.
If you’re more of an audio person, our friends at Expected Own Goals spoke to Kari Anderson from Yahoo about the Reign, and Abigail Segel from The XI and Defector about Orlando, available wherever you get your pods. If you want to support them, you can head to their Patreon.
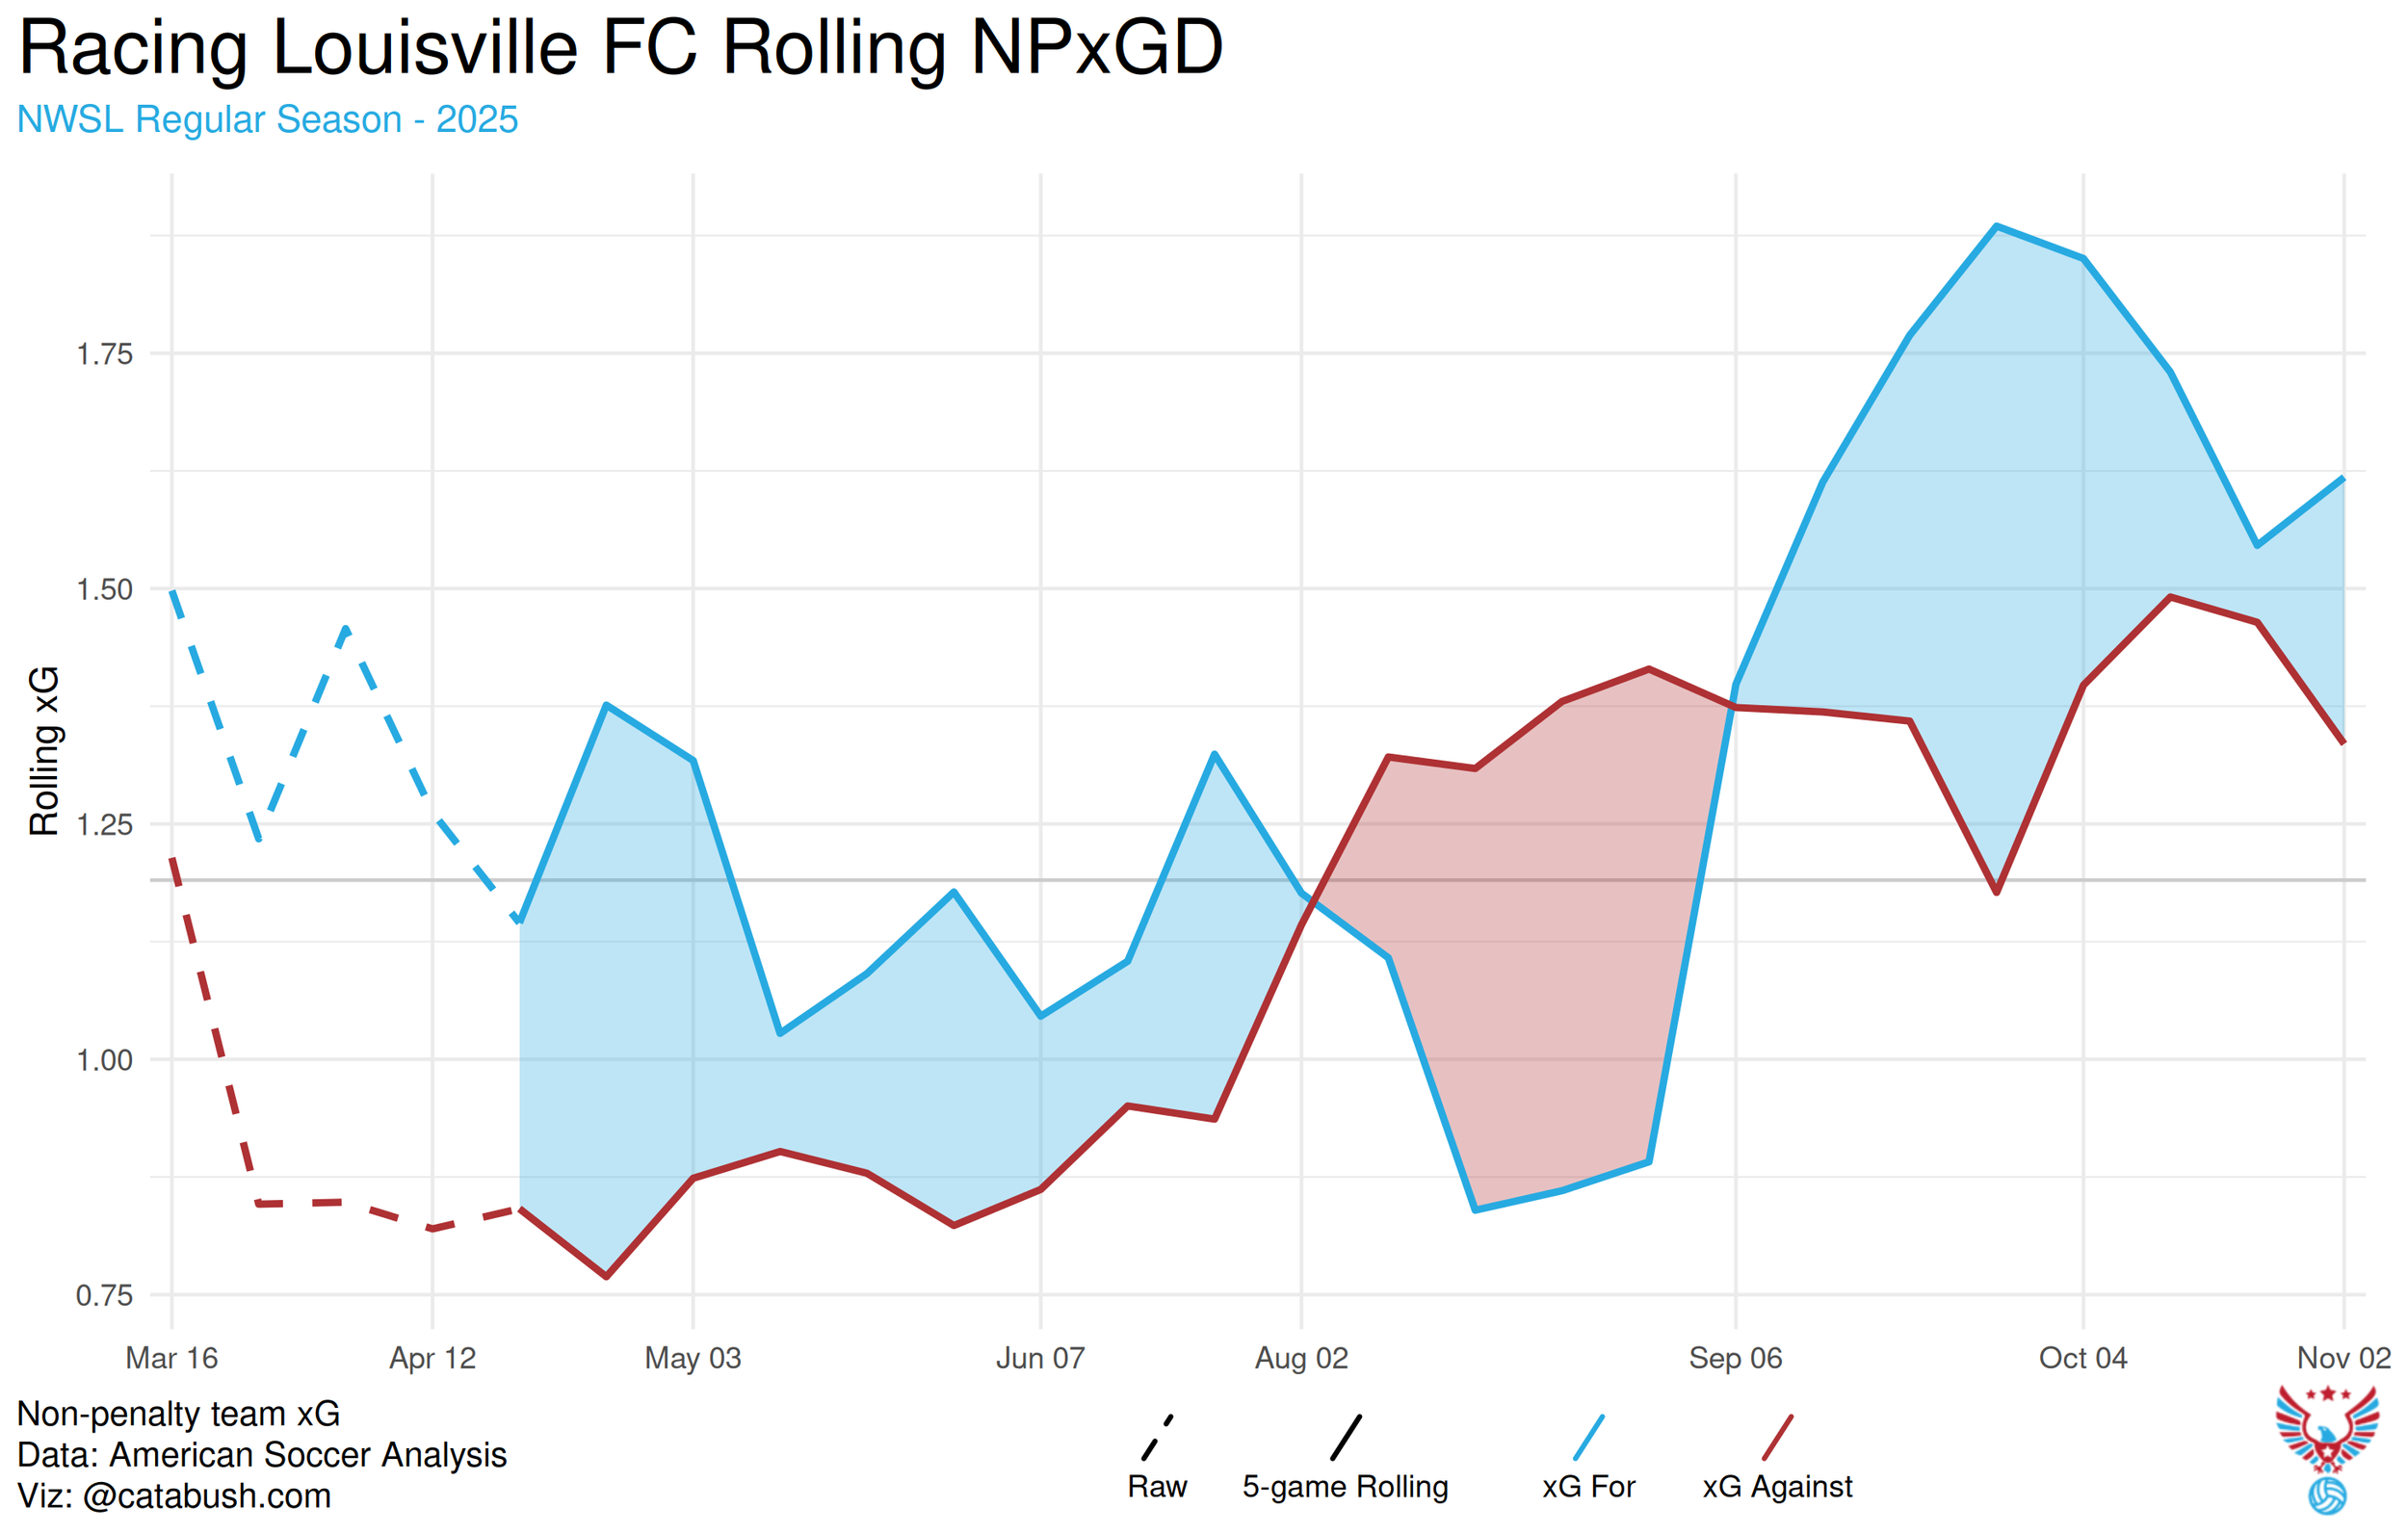
Our 2026 NWSL Season Previews have started and today we hit Racing Louisville and San Diego Wave. If you want to support this coverage of the league, you can head to our Patreon. For $5 a month you can get access to a lot of the data visualization tools we use to make these previews.
If you’re more of an audio person, our friends at Expected Own Goals podded about San Diego and Louisville, available wherever you get your pods. If you want to support them, you can head to their Patreon.
This is a site for the objective analysis of Major League Soccer and U.S. Soccer
