

Thomas Bayes? Meet Djordje Petrovic
/By Mike Imburgio and Kieran Doyle
MLS is no stranger to star goalkeepers turning the fortune of a team, carrying a bedraggled defense to respectability off the virtue of their shot stopping. From Tony Meola and Joe Cannon to Nick Rimando and Stefan Frei, that is MLS heritage. In recent years, the goalkeeping landscape has been dominated by two men in New England, first Matt “xGod” Turner and then a rather large Serbian fellow named Djordje Petrovic. Both shattered the limits of what we thought possible in terms of goalkeeping statistics.
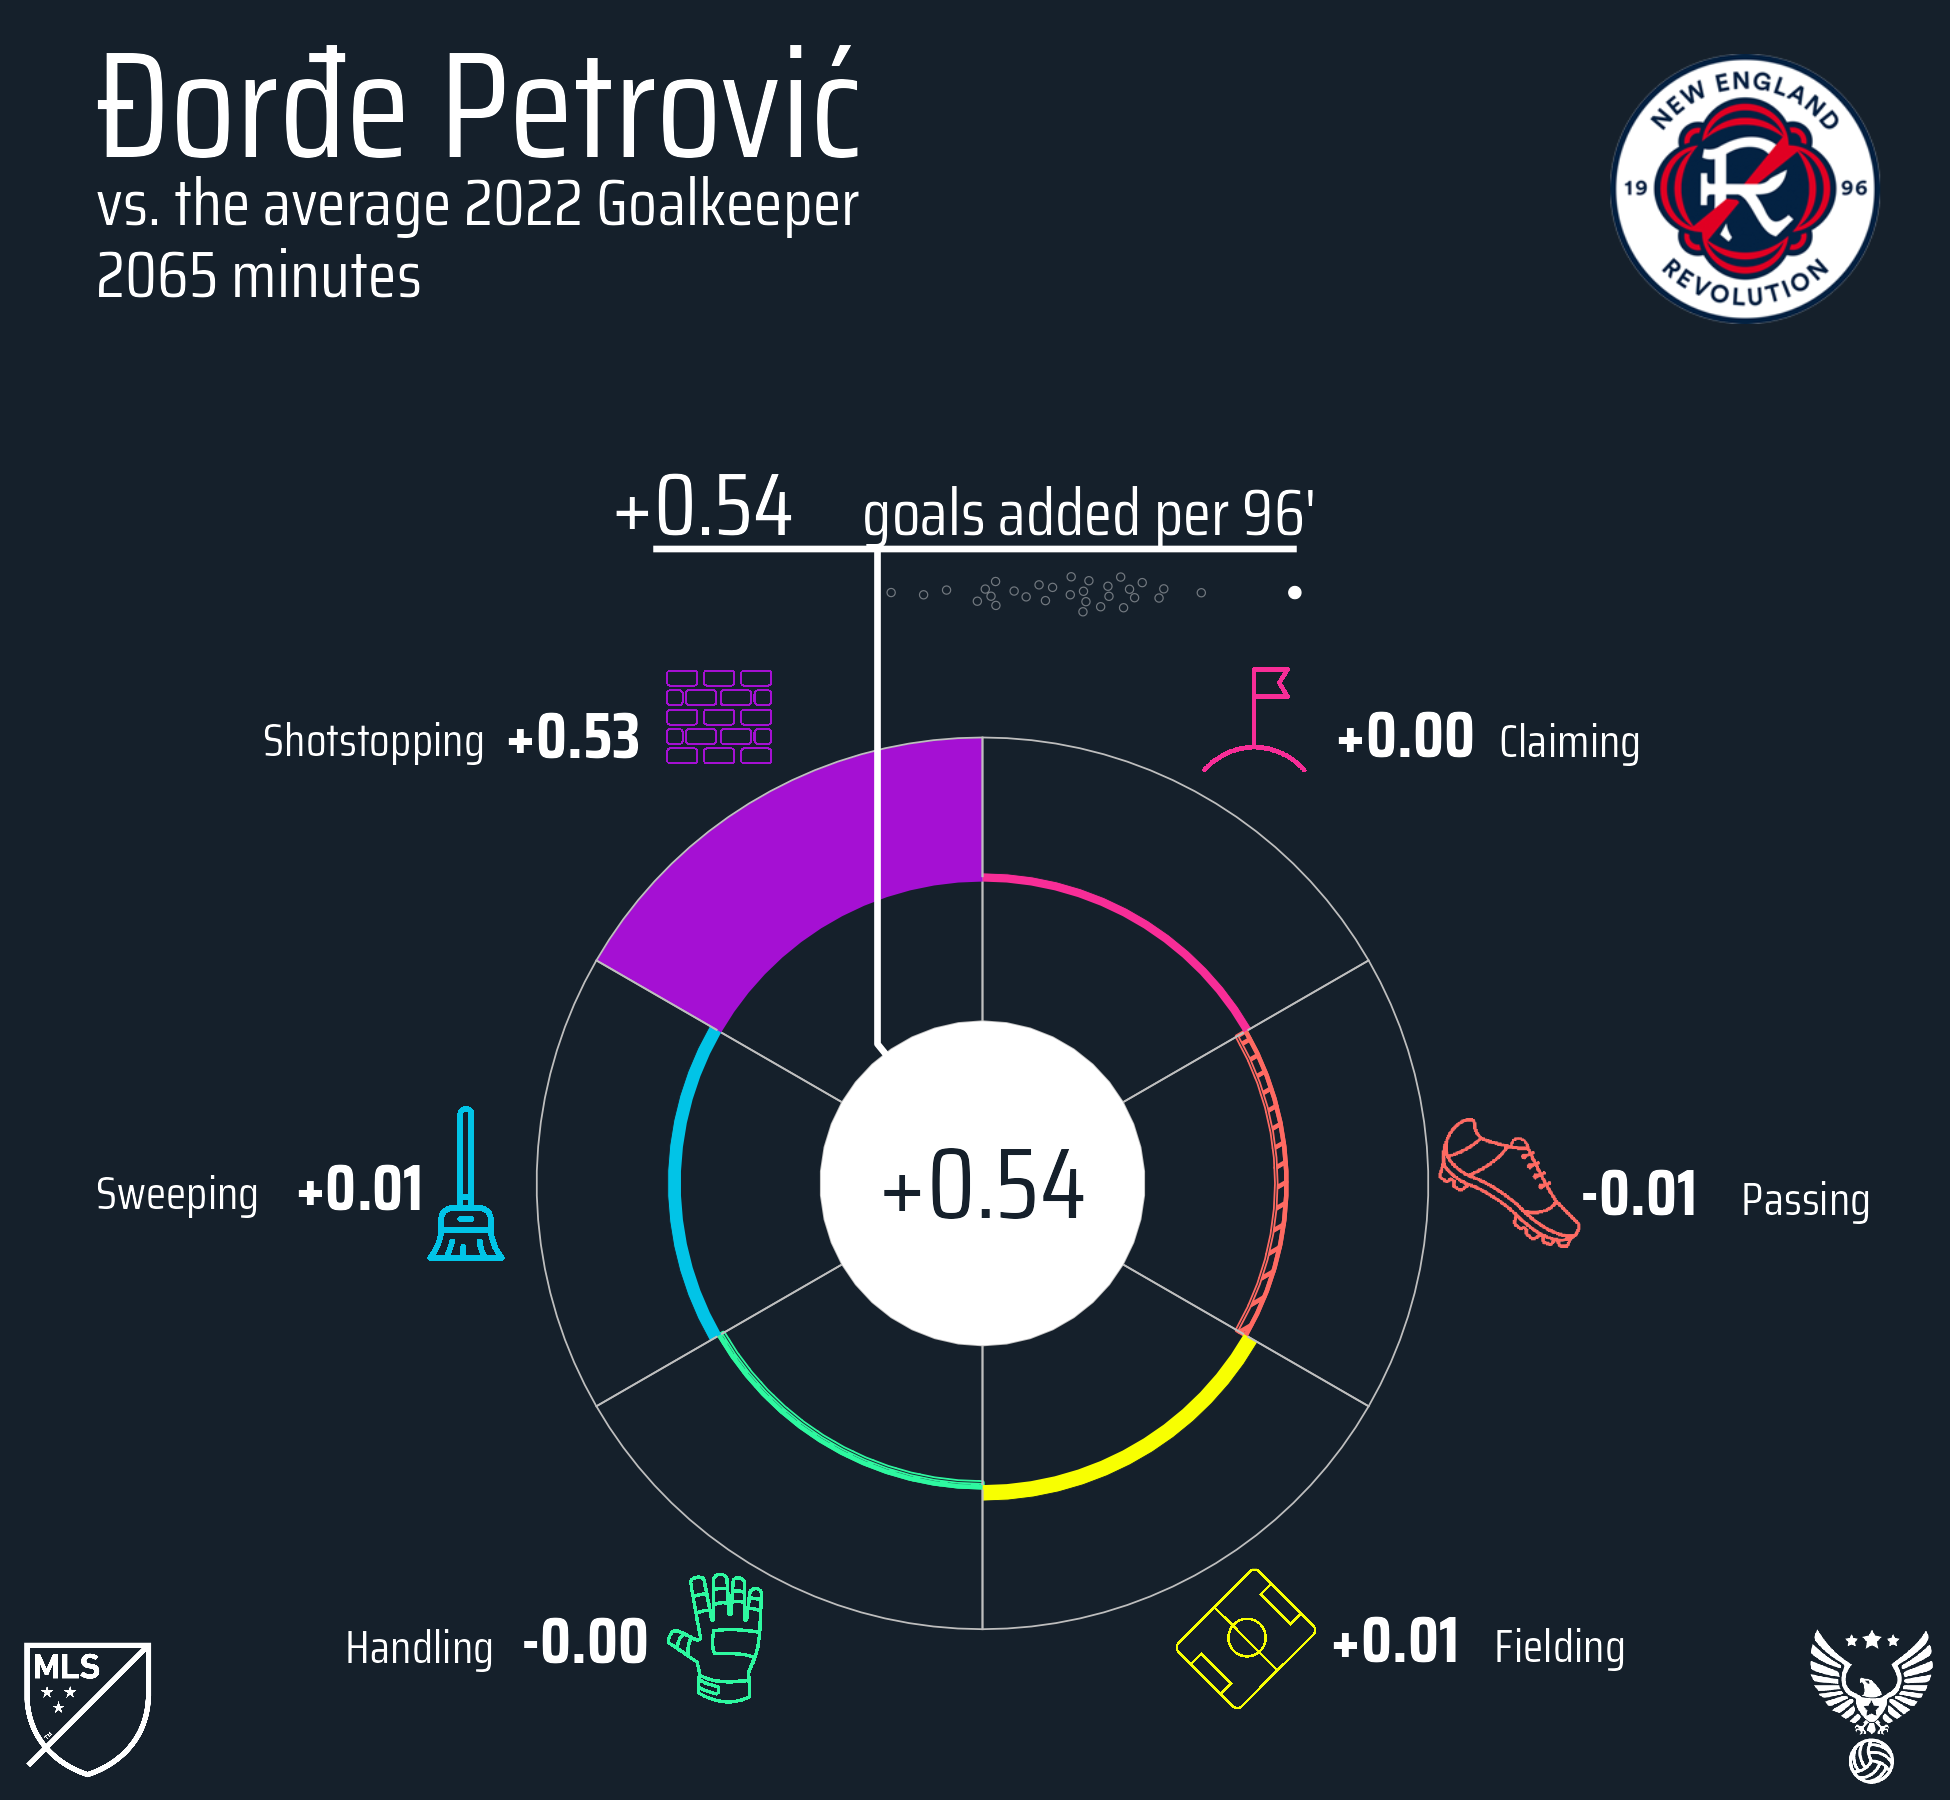
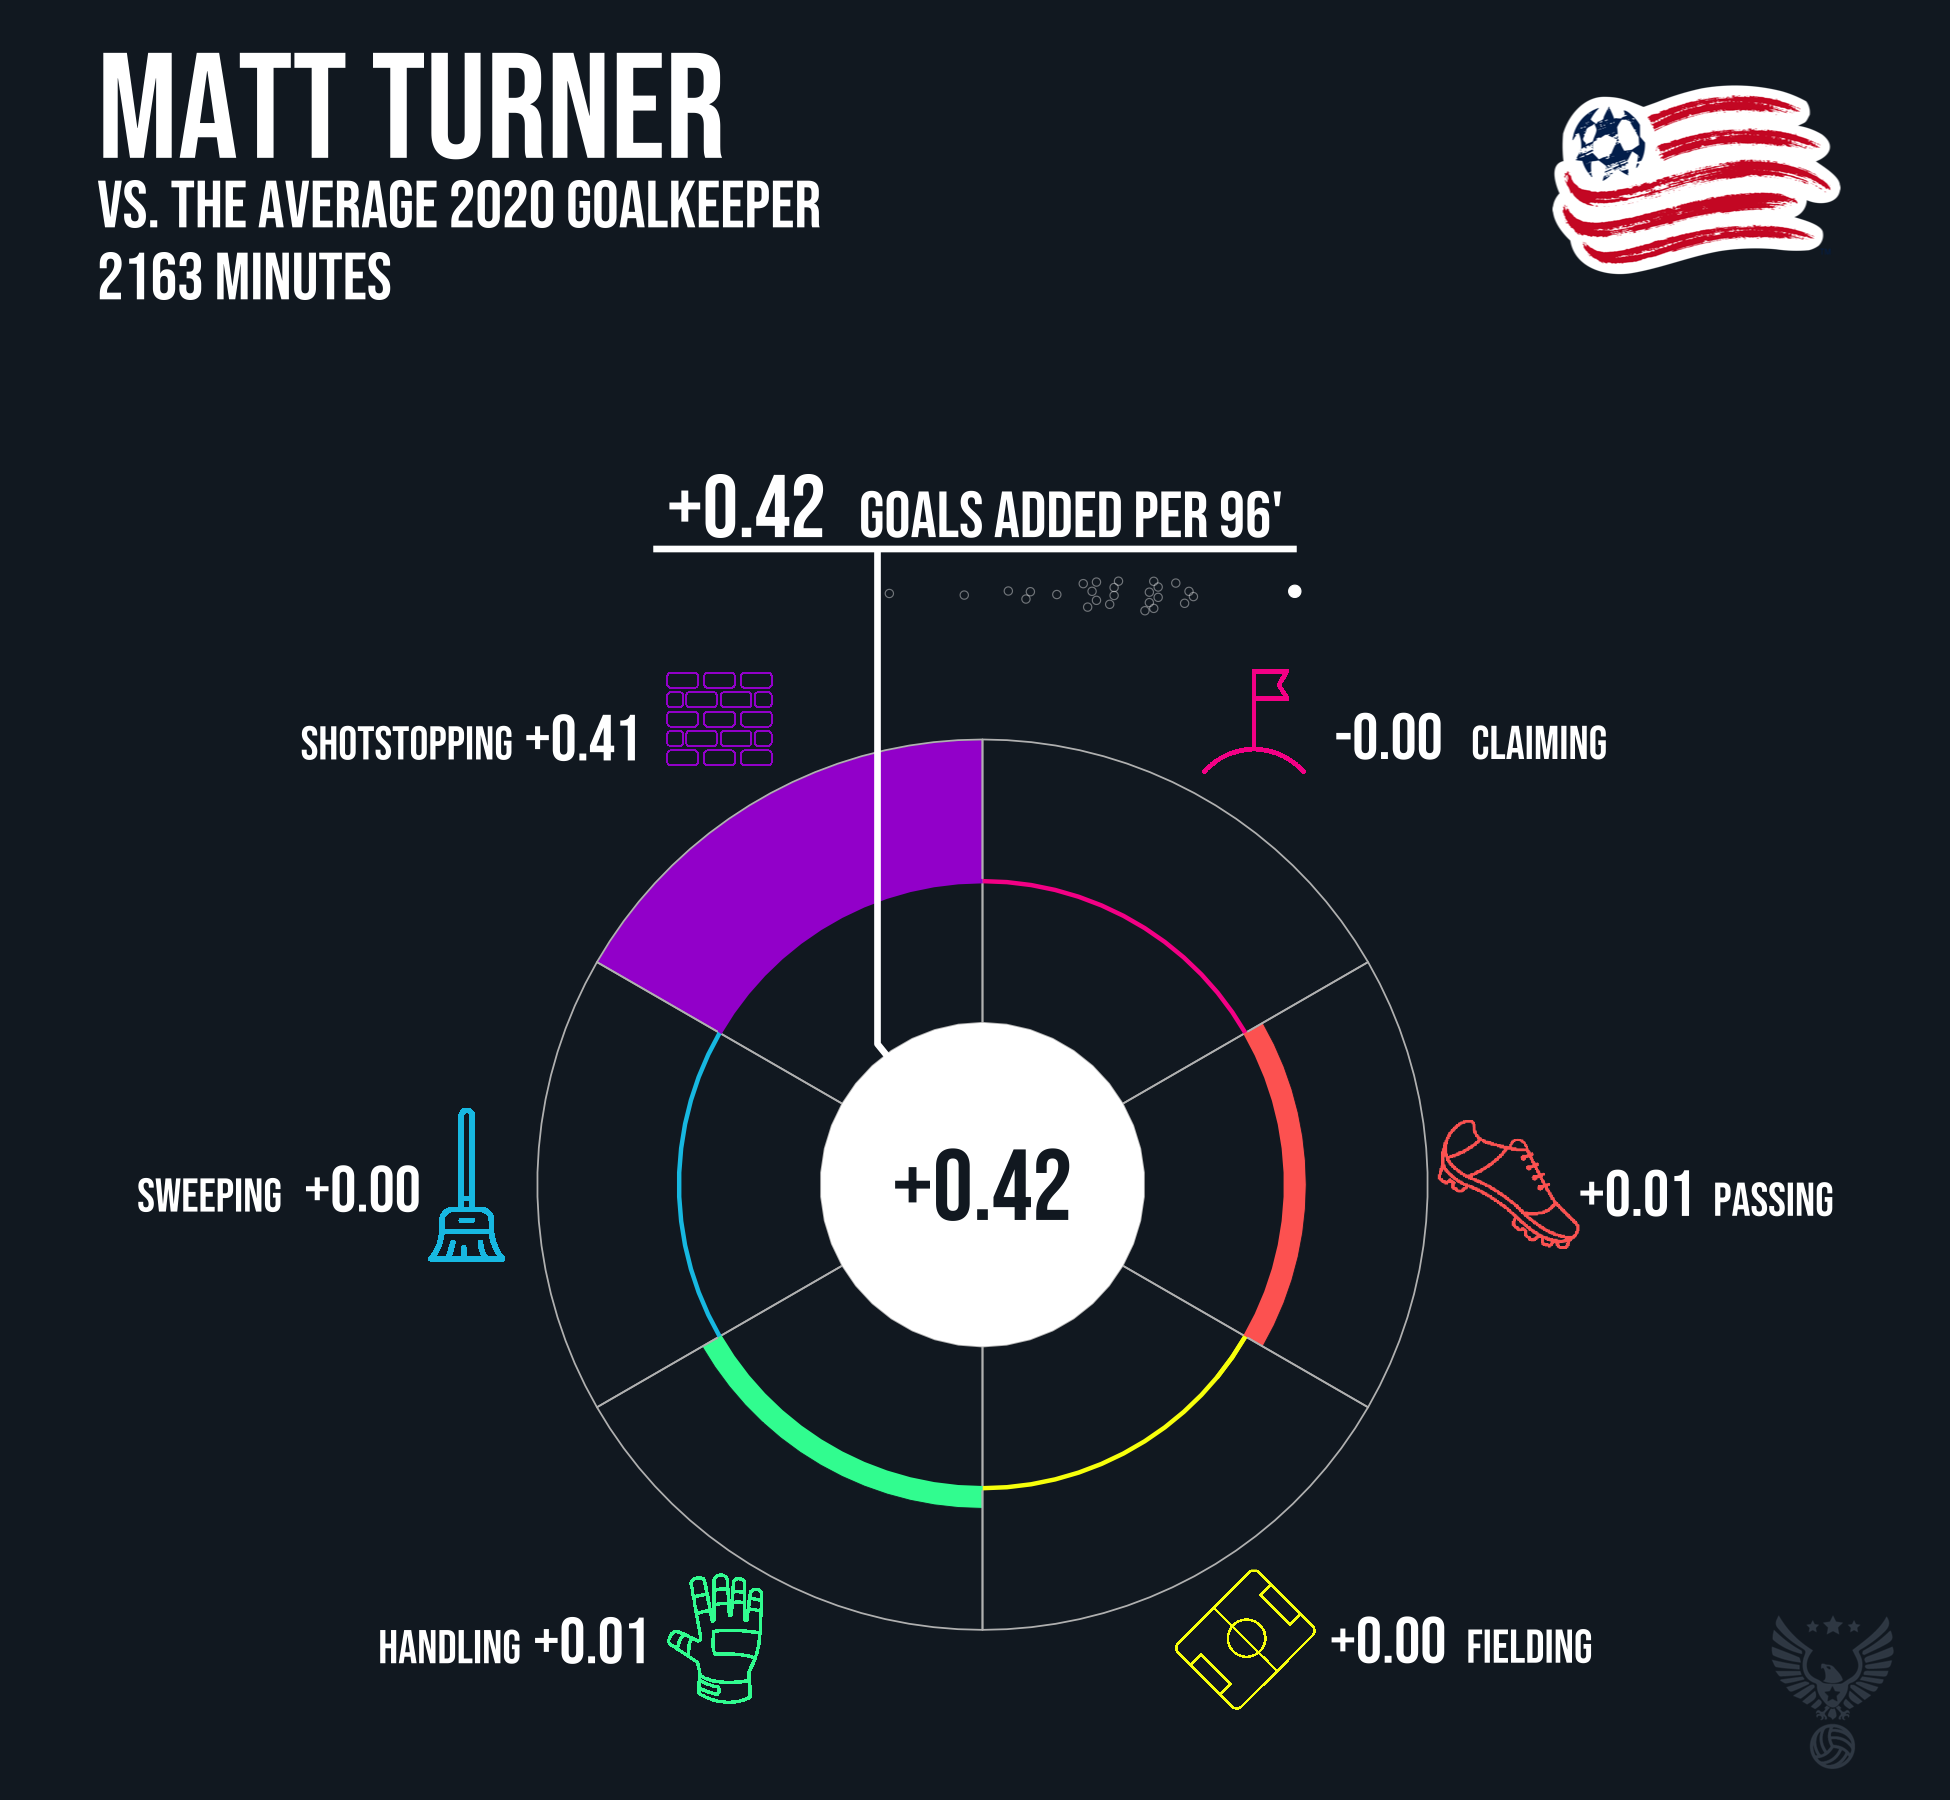
Unfortunately, both gentlemen’s time in MLS has come to a close as Turner moved first to Arsenal, and then Nottingham Forest, while Petrovic has made a big money move to Chelsea. With such noteworthy transfers comes an obvious question: How real are the numbers? The answer to that is easy, extremely real. Turner and Petrovic prevented goals in MLS to an extraordinary degree, we can see that in the number of goals conceded compared to both their pre and post shot xG. But what that question is really asking is “will those numbers continue?,” and that is more difficult to answer.
Empirical Bayes and the Nagging Feeling Your Goalie Stinks
To first answer that, we have to look at how sure we are that these goalkeepers are actually good. You’ll often see screenshots of FBRef bar charts and a goalkeepers PSxG +- (post-shot xG) flying around in the Twitterverse, but one factor these fail to take into account is the amount of shots (and xG) a goalkeeper actually faces. Is a goalkeeper who saves five goals above expectation on 100 xG better than a goalkeeper who saves four goals above expectation on 50 xG faced? So we start by breaking things down to their goals saved ratio, that is G/xG or G/PSxG. From there, we use empirical Bayes estimation. The short version of this is that we use the historical G/PSxG rates of MLS goalkeepers as the expectation for all goalkeeper performance, and the more sample size we get of their actual G/PSxG performance the further we move away from prior expectations. This technique has been used previously on ASA by Eliot McKinley looking at penalty kicks specifically, and by Tony ElHabr looking at shooters, replicating some earlier Laurie Shaw work but also in other sport applications. There is a useful stats explainer using baseball available here by David Robinson.
First, we calculate the prior expectation for each of the leagues in our dataset (NWSL, MLS, USL) in terms of G/xG and G/PSxG for all goalkeepers who have faced more than 50 on target shots, and the distribution of G/xG and G/PSxG ratios. This amounts to about 60% of the 1235 goalkeepers in the dataset. The mean ratios can be seen in the table here.

G/xG ratios might look a little funky because so many shots end up off target and adding all shots makes these data significantly noisier.
Then, we calculate the posterior mean (their actual G/xG or PSxG ratio) for all goalkeepers in the set, then adjust them towards the mean. Goalkeepers with large sample size are shrunk only a little, goalkeepers with a small sample size are shrunk a lot. Now with that, who has been good and how sure are we? Bring me the plots!
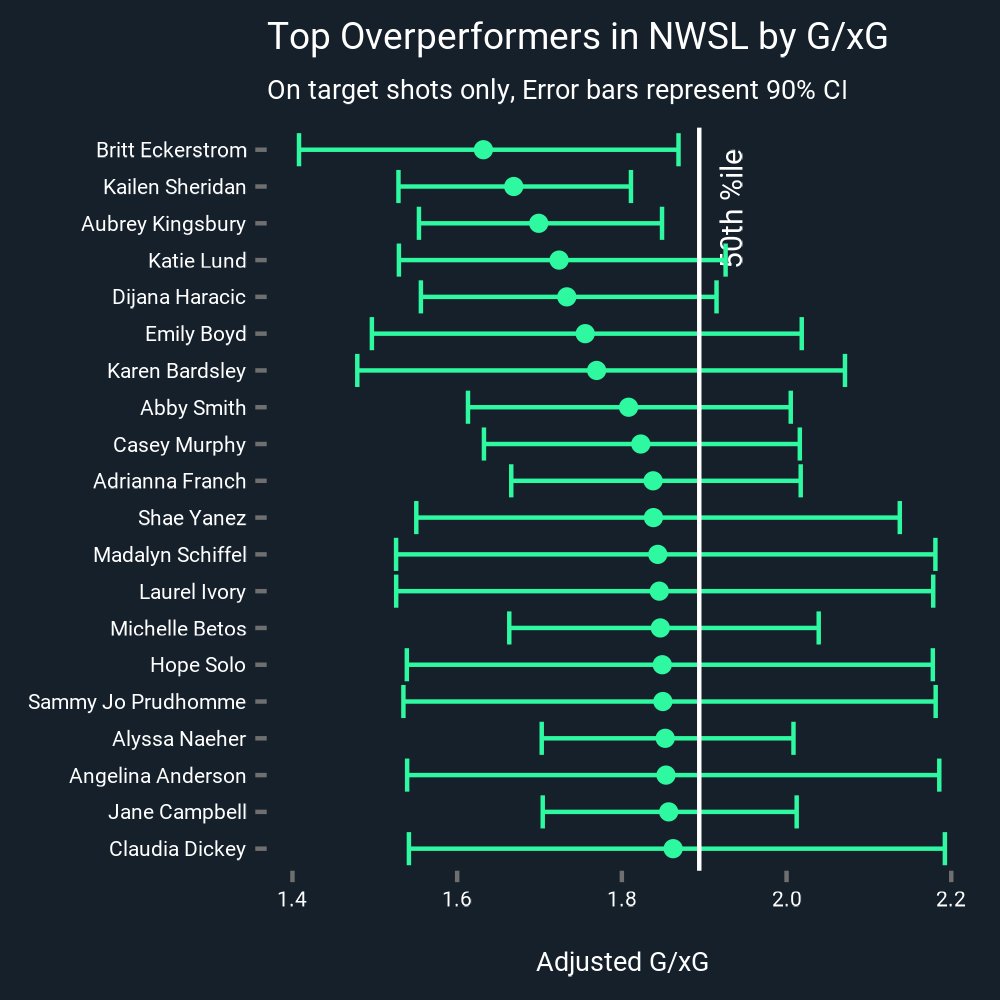
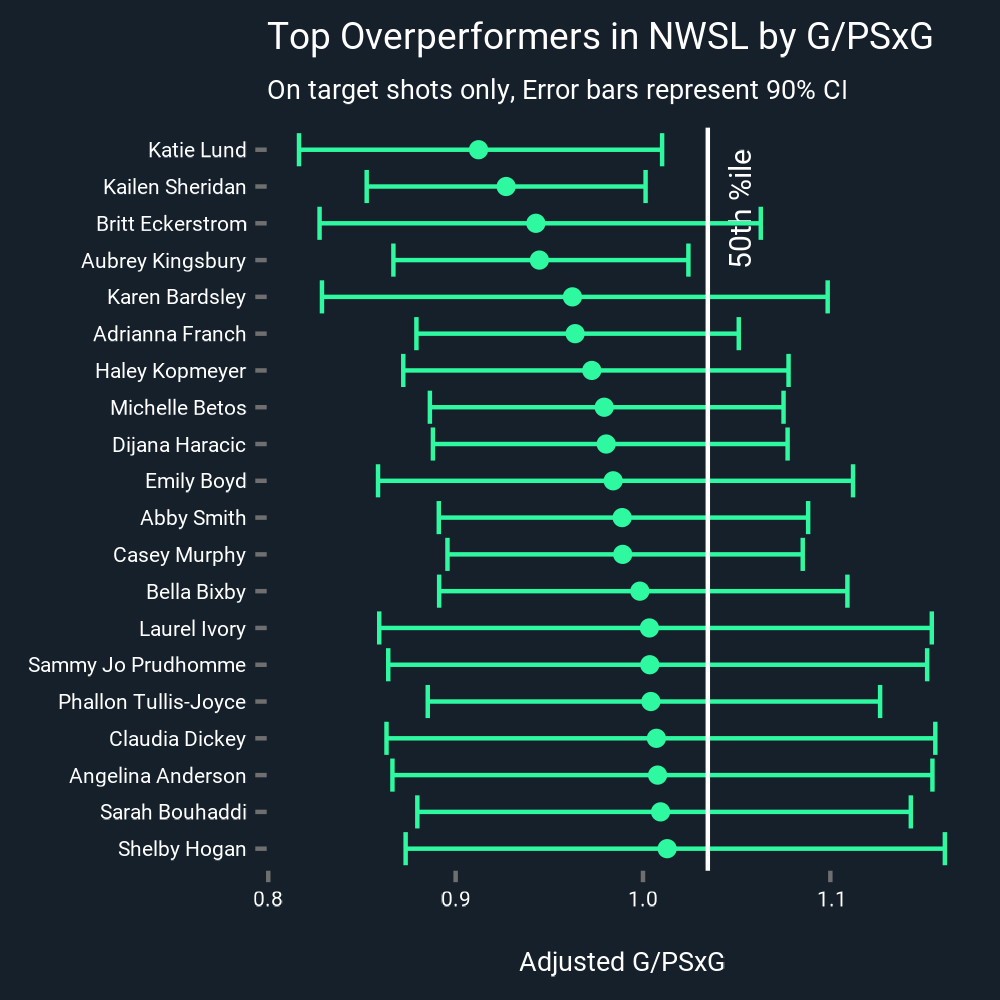
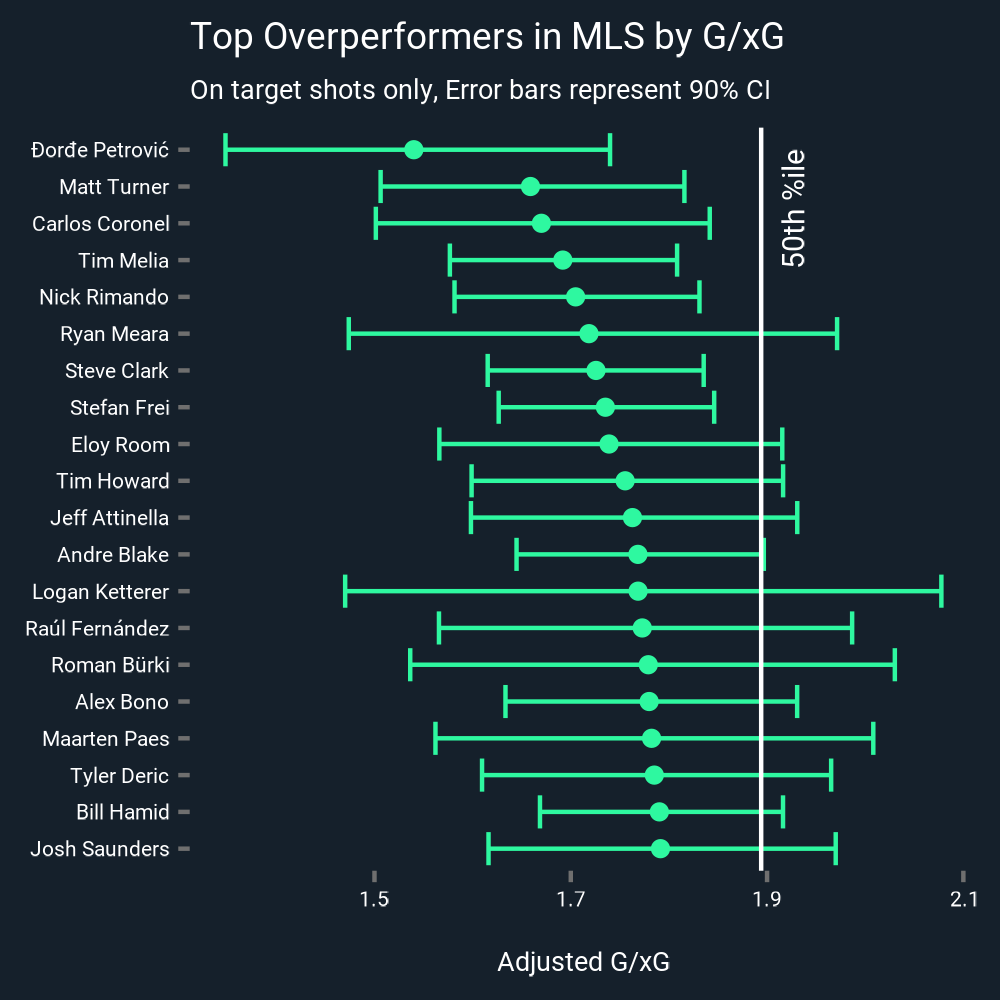
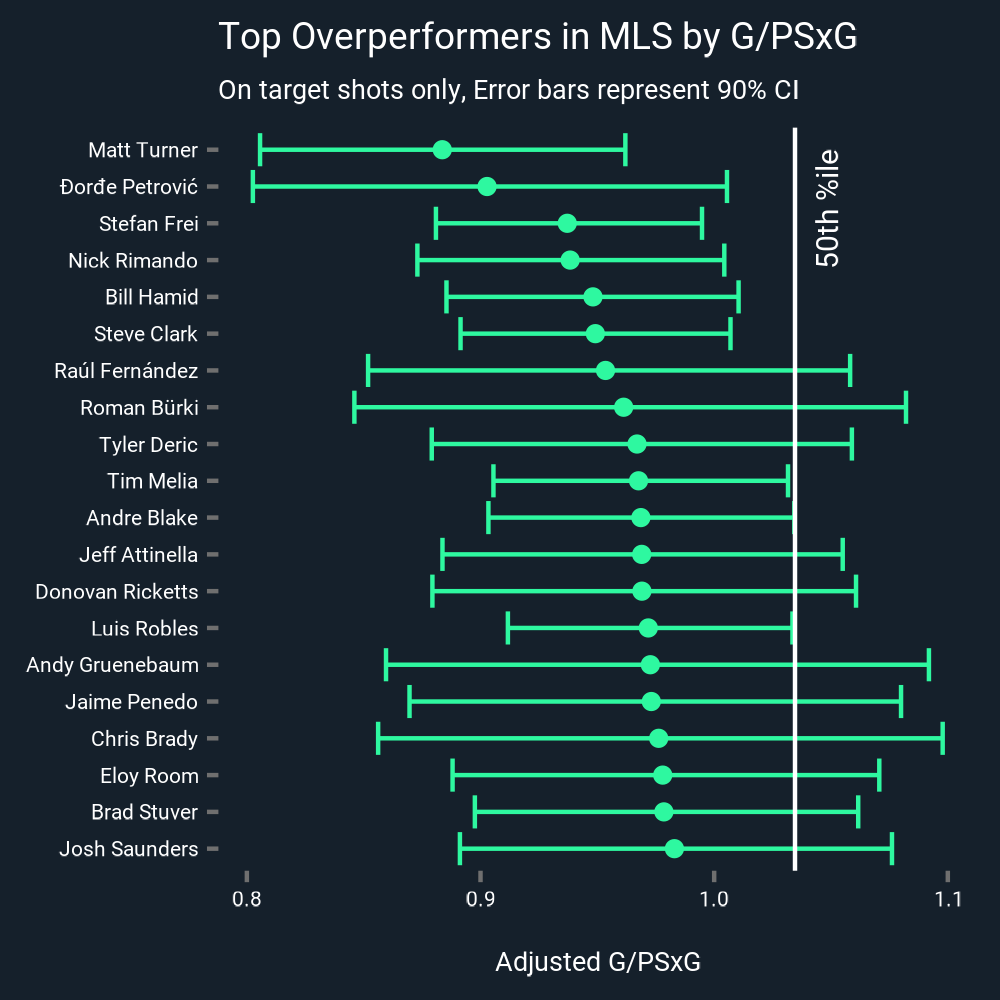
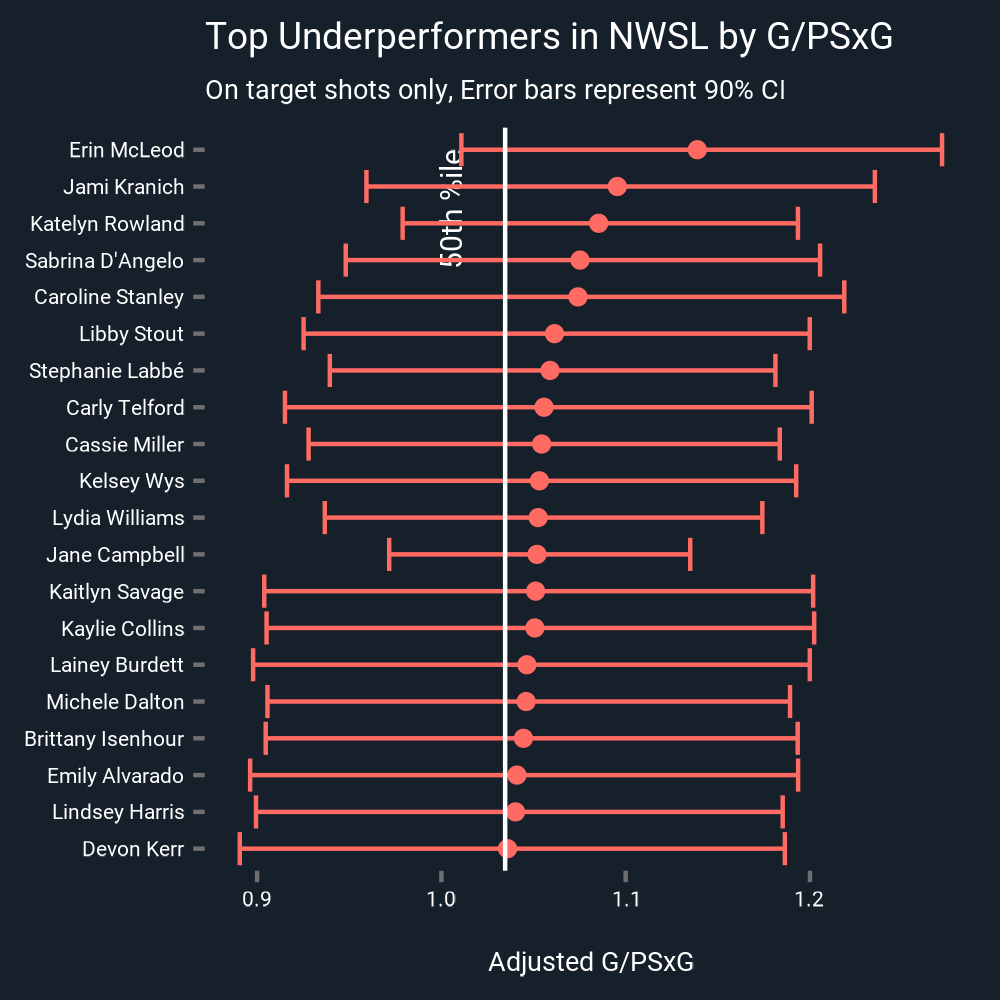
Looking at the adjusted goal to expected goal ratios, we see that Petrovic is far and away the historical leader in the ASA dataset from 2013 to present day. This list largely lines up with what we’ve seen historically: Rimando, Turner, Frei, Andre Blake. Names of top goalkeepers past. San Jose or Chicago fans might get giddy at an early appearance for Daniel and Chris Brady (if with very large error bars). On the NWSL side, nobody will be surprised to see ASA favourite Kailen Sheridan or Go Big Purp standout Katie Lund, but you might be surprised to not see USA starting goalkeeper Alyssa Naeher (and do see her backup, Emily Boyd, even in limited run).
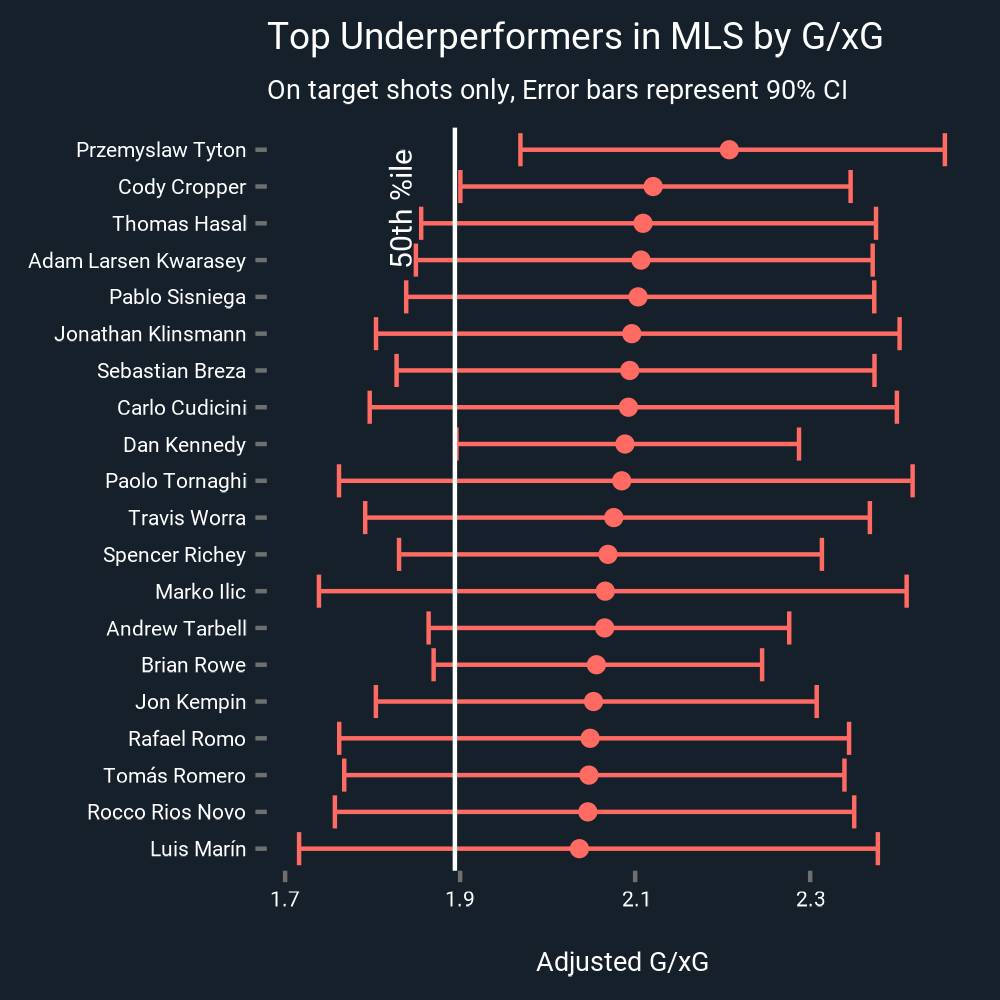
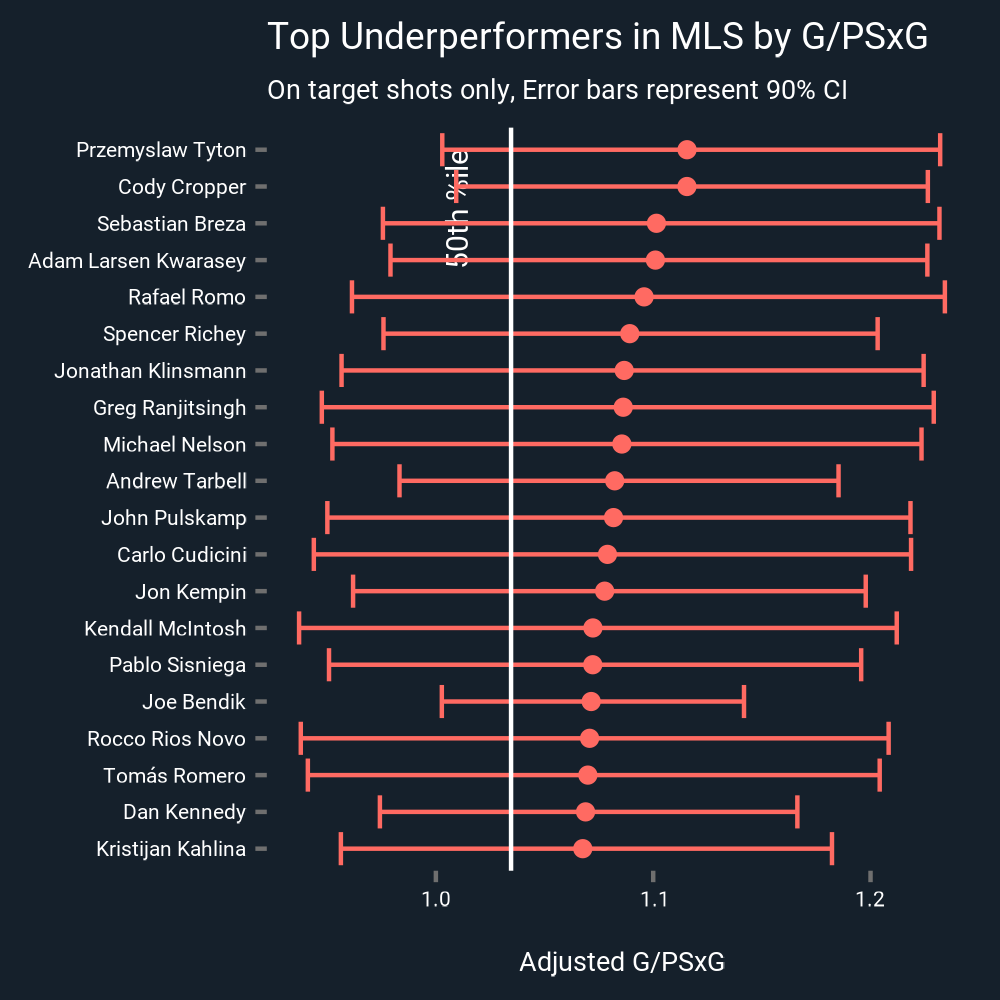
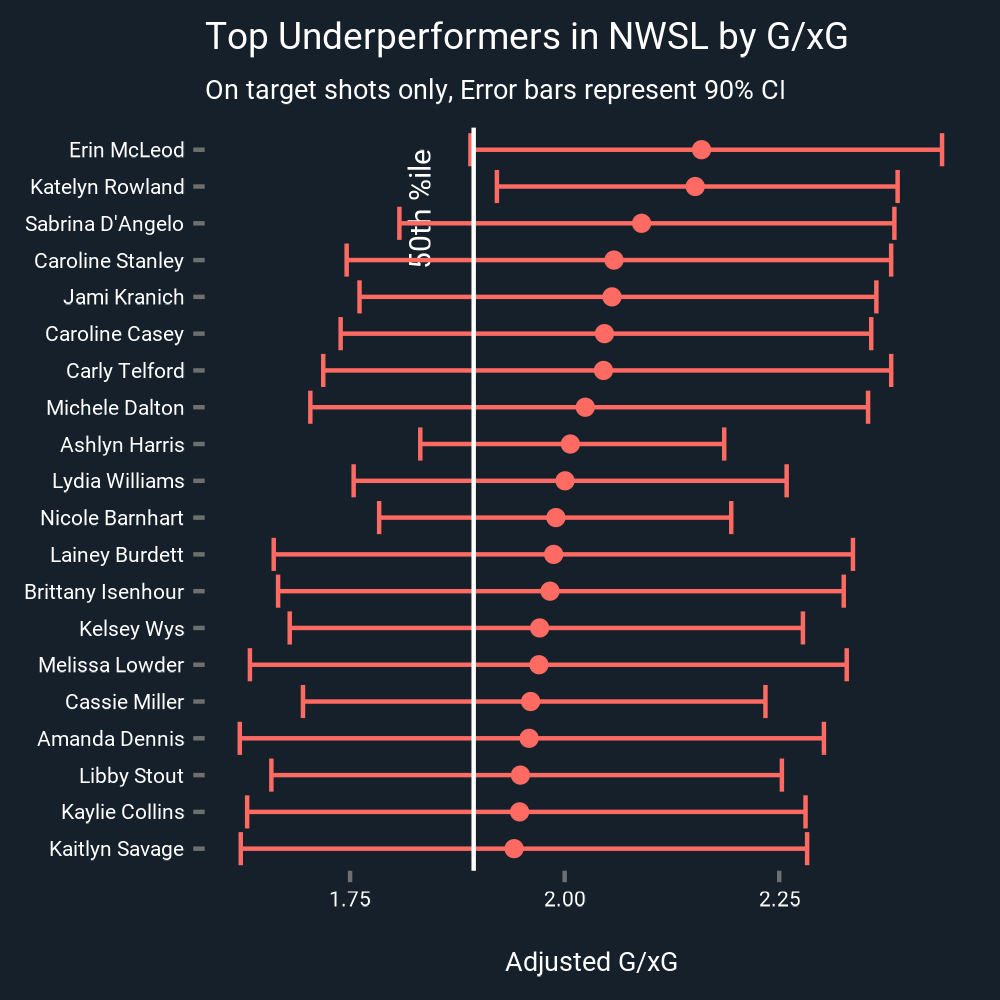
Of course, we all like to revel in others failures, here’s the list of the worst xG underperformers. Oh how happy I am to see such ardent Toronto FC and Canadian X/Women’s National Team representation.
Post Shot vs Pre Shot xG?
The careful observers might notice how different the pre and post shot expected goal ratios look here and wonder why we are even looking at pre shot xG for goalkeepers when we have this information about where the ball ends up. There are a few reasons for this: without tracking data, we don’t explicitly know how goalkeepers are impacting their own PSxG. Sure, that shot was as close to the post as humanly possible, but the goalkeeper was leaning against that post having a cigarette. Is that a high or low PSxG shot? Similarly, if a goalkeeper is so massively out of position that a simple pass into the middle of the goal will suffice, how does that impact things? Of course, these two totals are largely measuring the same thing.

Interestingly, though the differences are small, the adjusted G/xG ratio is slightly quicker to determine exceptional goalkeepers in terms of shots faced. Maybe we are seeing some skill from goalkeepers reducing their post shot xG compared to their pre shot xG getting picked up, think angles to close down 1v1’s or force shooters wider. Unfortunately, the average MLS goalkeeper faces approximately 150 shots on target a season, while the average NWSL goalkeeper only faces 100. The exact number of shots needed to detect an effect is somewhat dependent on the amount of data available for the statistical adjustment, but the general principle seems clear. Much like finishers, unless you are truly exceptional, we require a career's worth of data to really be sure about how good you are.

The Goalkeeper Coach’s Alamanac
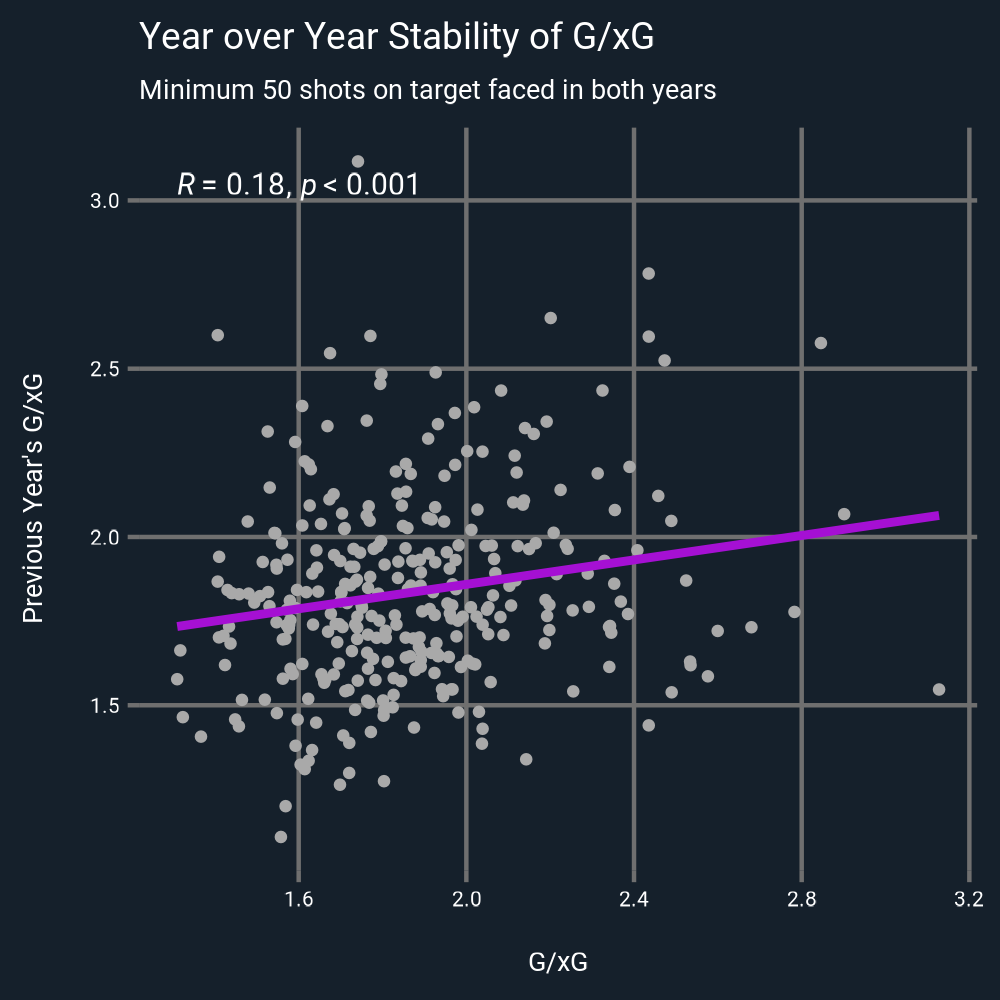
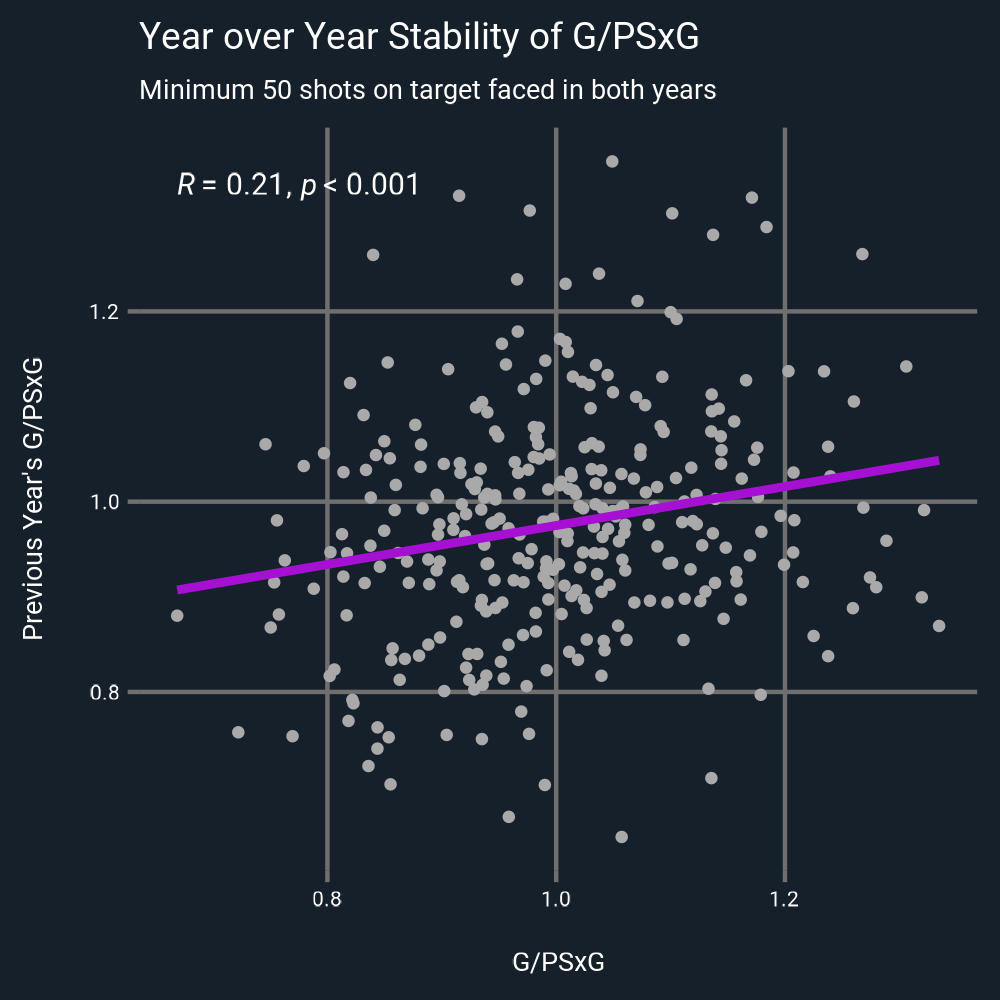
Now that we have a good handle on how sure we are goalkeepers are good or bad (not very unless you are truly exceptional), we can begin to answer the “will those numbers continue?” question. To do that, we can look at some year to year correlations. Comparing the G/xG and G/PSxG for goalkeepers who faced 50 shots on target in both seasons, we can see weak correlations of 0.18 and 0.21 respectively. As we have already seen in the spread of the 90% confidence interval bars for the empirical Bayes adjusted goal prevention ratios, an average goalkeeper could very realistically have an 8-10 goal swing in back to back seasons. Seasoned spreadsheet jockeys might remember MLS Goalkeeper of the Year Andre Blake swinging wildly between 10 extra goals allowed in 2019 to nine extra goals prevented in 2022. Nonetheless, the correlation year to year is statistically significant.
Final Thoughts
So what did we learn?
Empirical Bayes estimation can help us assess goalkeeper performance compared to the performance distribution of goalkeepers in the absence of career long data profiles.
We unfortunately still need a career’s worth of shot stopping data to evaluate how good goalkeepers outside of the 90th/10th percentile are, but we can identify a truly exceptional goalkeeper (>99th percentile) in one season of data.
G/xG is maybe quicker than G/PSxG to detect goalkeepers better/worse than the prior distribution.
Both G/xG and G/PSxG are weakly predictive of future G/xG and G/PSxG performance.
All this to say, Chelsea fans can probably feel pretty secure they got a good one in Djordje Petrovic.