

Net Goals Added: Combining Complementary Possession Value Metrics
/It’s been about three years since goals added (g+) was first introduced with the aim of measuring how much value a player adds to their team through on-ball actions. Since then, the g+ model has been refined and improved, and lots has been learned.
In fact, the creation of g+ has since spawned two related metrics, g- and g+ boost, which extended the g+ framework to answer questions that g+ itself doesn’t. Because these three metrics were designed to complement each other, bringing them together to form a total player value should provide a holistic system that accounts not just for what a player does on the ball, but what happens after they pass the ball and what happens when their opponent has the ball.
For loyal ASA readers that are already familiar with all of these metrics, I’ll cut to the chase - this article is a first attempt at combining them, and at the end of the article you’ll find the combined values along with each of the components for complete MLS regular seasons since 2013 and complete NWSL regular seasons since 2016 in a sortable, filterable, downloadable table. Getting more data in the hands of the public pushes analytics forward, so we’re very much looking forward to seeing how people make use of these metrics.
Defensive Net g+: Combining defensive g+ and g-
Defensive actions valued by g+ are things like tackles, interceptions, fouling opponents, and clearances. Valuing these types of actions is helpful and necessary for a full understanding of the game. Surely, a holistic value would allow for players that win the ball back from their opponents constantly to gain credit for it.
However, this also means that players that prevent those situations from ever entering their area of responsibility in the first place get no credit from doing so in g+. Even worse, players that consistently allow dangerous possessions in their zone before winning the ball back or clearing it will rack up g+ defending value. Luckily for us, g- does measure this by allocating g+ allowed to the opposition across a team (for a more detailed explanation, check out the explainers for open play and set piece g-). Without g- to tell us that the player consistently allows these dangerous situations to happen in their zone, this player might look like the best defender in the league. Combining defensive g+ and g- tells the whole story. And as it turns out, both sides are necessary to see the full story: players that rate highly on defensive g+ do not tend to rate highly on g-, or vice versa.

MLS Player Seasons only
So in combining these things, I opted to combine Interrupting g+ and the defensive actions in Fouling g+ (fouls conceded, but not fouls earned) to create a defensive g+ values. This is a little different than player g+ is normally broken down, which usually includes both fouls conceded and fouls earned in one ‘Fouling’ component - I thought this made sense with the eventual goal of separating offensive and defensive contribution. That defensive g+ then gets added to g- and normalized by position to create defensive net g+.
Offensive Net g+: Combining offensive g+ and g+ boost
Goals added has fewer gaps on the offensive side of the ball. A lot more of a team’s offense happens on the ball, and g+ does a pretty good job of telling us how much each of those things contributes to their team’s chances of scoring and conceding goals. By allocating some of the value of a pass action to a receiver based on the situation, g+ even accounts for some of the value players add off the ball with runs to receive passes.
But it still doesn’t account for all of the stuff that happens off the ball. Because it can’t see any of that, the model draws inferences about the value added by a pass based on what it can see in the situation. Some of what it misses is really important.
G+ boost was created to help account for what it can’t see during (and after) passes. When g+ boost was first introduced, John Muller highlighted a Darlington Nagbe game in which he consistently played the ball out of pressure using short, sideways passes that were able to release his teammates into space. In g+’s anthropomorphized eyes, it just sees a short sideways pass near midfield that doesn’t really achieve anything. But you, the astute soccer watcher, know that Nagbe has drawn pressure to himself, leaving the receiver free to impact the game from a place of additional time and space. As such, g+ boost measures what the receiver does with all of that extra time and space, compared to the average receiver of such a pass. Conversely, you may have a player who plays an underhit and bobbly pass that actually reduces the time and space available, negatively impacting the quality of the receivers next action, and g+ boost would penalize them accordingly. Because the model is built to measure this effect over and above what vanilla g+ accounts for, there’s very little relationship between a player’s g+ passing value and their g+ boost. This is important, as it means g+ boost doesn’t just give an opportunity for players who are already being rated as good at passing to double up on their score - the two metrics measure different skills.

mls player seasons only
So to sum up, g+ accounts for what happens on the ball, and g+ boost accounts for what happens after the ball is played to a teammate. Naturally, an offensive net g+ should combine the two. There are some complexities to the best ways to do this that I’ll cover later, but here I took the simple approach and just added offensive g+ (everything other than interrupting actions and fouls conceded) and g+ boost together.
Net g+: Bringing it all together
So to quickly summarize, we now have 4 sub-values: offensive g+, g+ boost, defensive g+, and g-. These four roll up into offensive net g+ and defensive net g+. Adding together the offensive net g+ and defensive net g+ gives us our net g+ value.

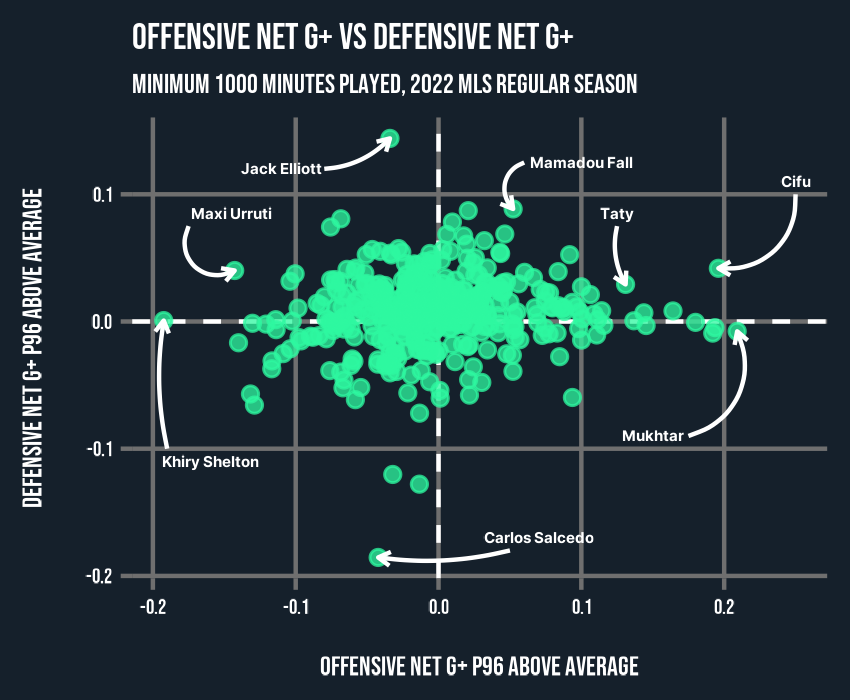
This system allows for an intuitive high-level comparison of players despite the complexity of the models themselves. For example, using net g+, Jose Cifuentes becomes the top player on a per minute basis during 2022 MLS regular season using a 1,000 minute minimum, narrowly edging out g+ leader and MVP winner Hany Mukhtar. Mukhtar is still the top offensive player in the league, but Cifu’s additional contributions on the defensive end - primarily from preventing dangerous situations from occurring in the first place, measured with g- - give him the slight edge in total.
The addition of g+ boost really helps some of the league’s best playmakers across the pitch climb the value rankings. Cristian Espinoza, not incredibly well liked by g+ in 2022, gets rated as an above average attacker in 2022 when g+ boost is taken into account. The appearance of 2014 Landon Donovan as one of the top g+ boost seasons of all time is fun, too. On the flipside, Ricky Puig’s 2022 value dropped a bit compared to g+; his negative g+ boost and g- meant the models saw him as being an incredible player on the ball, but that his passing didn’t consistently make his teammates better than the g+ model already accounted for and he was a below average defender for his position. To be clear, he’s still a top tier player by total value, but he makes for an interesting case study in how g+ and net g+ compare.
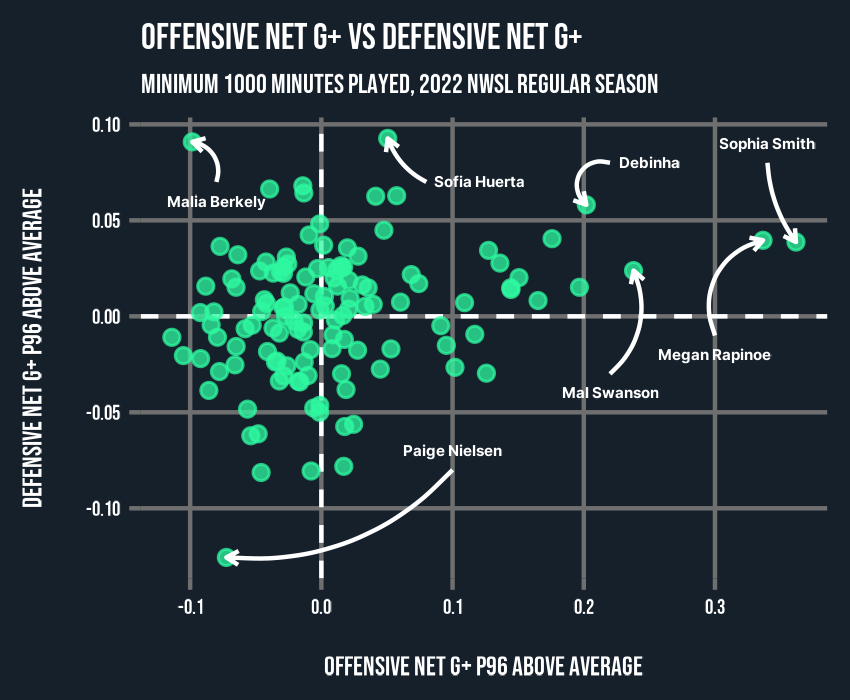
Bringing in additional defensive information is particularly useful for central defenders. While g+ mainly rated CBs who were good offensively very highly, the addition of g- allows their defensive contributions to be appropriately prioritized. Chiellini goes from a slightly above average CB to one of the top players in the league due to his ability to prevent dangerous situations in his area of responsibility as measured by g-. Abby Dahlkemper benefits similarly - she’s consistently rated as one of the best defenders in the league between 2016 to 2018 prior to her move to Manchester City, bringing her from an average player by g+ standards to a well above average player by net g+ standards. Jack Elliott and Sofia Huerta come out as 2022’s best regular season defenders in their respective leagues, for their ability to consistently prevent danger (g-) and clean it up when the situation calls for it (defensive g+).
The effect of the net g+ approach on defenders is really visible when you consider the spread of values by position. With offensive net g+ (and g+), offensive player values are much more spread out; compared to defenders, their impact according to offensive net g+ was larger in both the positive direction if they performed well and in the negative direction if they didn’t. Defensive net g+ values are similar for defenders, fittingly. Because they bear the brunt of the team’s defensive responsibility, being a better defender has a larger impact for nominal defenders. Bringing both together in net g+ equalizes this spread across positions quite a bit, giving players at all positions more opportunity to gain (or lose) value relative to their peers.
That said, offensive values are still spread more, meaning an excellent offensive player gains more value in this system than an excellent defensive player. This is immediately evident in the top rated NWSL players during the 2022 regular season - Sophia Smith adds so much value on the offensive end that there isn’t a single player in the history of the MLS or NWSL ASA datasets that comes close to matching that value from solely defensive work on a per minute basis with a reasonable amount of playtime. Incredibly, she also grades out as an above average defender for her position.

Limitations and Future Ideas
For a number of reasons, this should all be considered a first pass at combining the g+ family of metrics.
Each individual metric is likely to evolve for the better. For example, the allocation of defensive responsibility of each player could be greatly improved with tracking data or information about phase of play within open play, as outlined in the original g- articles. Jose Cifuentes coming out as the top rated player in net g+ p96 last year might be a good example here. It’s very possible that Cifuentes’ g- is benefitting a bit from LAFC’s solid defense as a whole - while g- is intended to parse out Cifu’s individual contribution to that, additional contextual information would improve our confidence that the metric is adequately separating individual contributions from team effects.
One thing to note here, too, is that g+ boost is estimated using action level values, but the current iteration of the model results in a season level value for each player. For this reason, positional averages in g+ boost don’t take into account multiple positions played by a player in a single season (which the other metrics usually do). Instead, for g+ boost above positional average, each player is just assigned the position at which they played the most minutes that season.
The process of bringing them together is likely to evolve, too. While adding g+ and g- is fairly straightforward, g+ boost is trickier. Consider the fact that Carles Gil ranks consistently toward the top of the league in g+ boost: his passes are very likely to put his teammates in a position to create more value than the vanilla g+ model expects. In plain terms, this means his teammates’ g+ values are getting juiced by some amount just because they get to play with him. Ideally, Gil’s teammates would lose some portion of the g+ they gain after receiving his passes to make up for this, with that portion instead going to Gil in the form of g+ boost. That would allow for Gil’s teammates’ g+ to better isolate their ability rather than their ability plus Gil’s playmaking. It would also alleviate some of the still-present, yet reduced, greater spread in net g+ for attackers by eliminating the currently doubled-up value. Instead, this system ignored the issue entirely by adding both together, but a better process would probably account for the tradeoff between g+ boost and g+.
While all of this is a work in progress, the ability to consider the entire g+ family of metrics is an improvement over looking solely at g+. Event-based possession value metrics like g+ are better than player value metrics that came before. Using those values as a basis of accounting to measure player contributions from multiple angles can improve data-based player evaluation even further.
And of course, there’s no better way to improve something than putting it onto the internet to let people tell you what’s wrong with it. Below, you can check out every value for every player in every complete MLS and NWSL regular season we have data for, adjusted for positional average.