Weekend Kickoff: Chicago... again? Plus Houston with Galactic Show Down.

It's Friday! FRIDAY! Gotta get up for Friday. (Yes, I was just singing a Rebbeca Black song. Let It Go... or I'll start singing Frozen). This isn't just any Friday either. It's the start of a long weekend for many, the first of four glorious days. Regardless of your work schedule, there's a great double header, so let's talk about all four teams this week.

Read More

Does travel distance affect results in MLS?

By Brendan Kent (@brendankent)

A key feature of Major League Soccer that differentiates it from European leagues is the physical distance between the teams. While the two-conference system reduces the average distance an away team travels for a match (teams play in-conference opponents three times per year and out-of-conference opponents once), MLS teams still spend some weeks traversing several time zones.

Back of the napkin rendering of MLS stadium locations. Obviously not perfectly to scale, but you get the drift: Western Conference teams travel farther.

Back of the napkin rendering of MLS stadium locations. Obviously not perfectly to scale, but you get the drift: Western Conference teams travel farther.

In the 2013/2014 MLS Season teams traveled an average of 1,058 miles to away matches‒by this I mean the distance between the two teams’ stadiums. Houston traveled the furthest on average, at 1,345 miles per away match. The average distance traveled to away matches by each team in the 2013/2014 season is shown below. Unsurprisingly, Western Conference teams tend to travel further.

This raises the question, does travel distance effect results? In other words, can we expect teams to perform better away from home when that away match is closer to home?

In answering this question, I used multivariate regression with data from the 2013/2014 MLS regular season. Away results were used as the dependent variable to control for the significant influence of general home advantage. To control for the relative strength of the two teams, I used end of season point differential with a minor adjustment: I removed the result of the game in question to prevent any bias. I also removed any matches between LA Galaxy and Chivas USA from the data because one team was technically playing an ‘away’ game at their home stadium when they went head-to-head.

I ran several variations of the regression, all of which used away results as the dependent variable and the adjusted point differential as one of the independent variables. First, I added distance between the two teams’ stadiums as a second independent variable. This proved to be insignificant, with a p-value of .31.

Next, I ran the regression replacing distance between stadiums with the difference in time zones between the stadiums. This again proved to be an insignificant variable, returning a p-value of .5.  

Finally, I replaced the time zone variable with an indicator variable for whether the teams were two or more time zones apart. Again, insignificant, this time with a p-value of .73.

This tells us that when we control for general home advantage and the relative strengths of two teams, the physical distance between two teams has no effect on results from a statistical standpoint. This is not to say that travel takes no toll on players, it probably does, but the difference between Vancouver traveling to Portland and Vancouver traveling to New York is statistically insignificant when we control for the strength of the two teams.

DC United: Model Breakers or Just Lucky?

By Kevin Minkus (@kevinminkus)

D.C. United's defense, according to advanced metrics, is not very good. As of this weekend, their Expected Goals Against (xGA) sit at 15.7, their Total Shot Ratio (TSR) is .415, and they've allowed 156 shots in 11 games. According to these stats, they should find themselves near the bottom of the Eastern Conference standings. But, miraculously, they're not. Instead, they're at the top of the standings, with 21 points through 11 games. They've allowed only nine goals, tied for fewest in the league.

Some consider this to mostly be a product of luck; after all, they've outperformed their xGA by nearly seven goals, and their PDO is at 1058. Given the quality of shots they've faced this season, the probability of them allowing nine goals or fewer is just three percent. These numbers suggest they are due for a regression sometime soon. But there's a problem. The numbers said the same thing last season, and that regression never happened. In 2014, D.C. United finished first in the East with 59 points, third most in the league. They had just a two percent chance of outperforming expected goals allowed by the margin that they did (about 12 goals). A question on many MLS analysts' minds is “How?”

At least part of this over-performance probably can be attributed to luck (and maybe unconscious biases in the data). You can't ever really rule it out entirely. But a much greater part of it has a simple, straightforward explanation: they actually do defend well, even though it doesn't show up in the stats in ways we might expect it to.

The chart below shows expected goals against minus goals against for 2014, as well as the probability of at least that level of over or under performance occurring. Teams with a highly positive xGA-GA are “lucky”, teams with a highly negative xGA-GA are “unlucky”. The right-most column is the percentage of shots against that are off target or blocked.

2014 Expected goals against minus goals against for 2014
Team xGA-GA Chances of Allowing at

Least that Many Goals
% of Shots Blocked

or Off Target
RSL 15.12 0.00564.16%
DCU 12.62 0.02263.97%
SJ 9.08 0.08562.64%
FCD 4.67 0.2866.06%
POR 4.44 0.25961.54%
CLB 3.90 0.24862.68%
NYRB 1.36 0.42562.42%
HOU 1.23 0.46462.50%
SKC 1.04 0.45960.17%
NE 0.43 0.52162.62%
VAN 0.13 0.52566.29%
PHI -0.21 0.53561.48%
CHI -0.84 0.59261.80%
LA -3.08 0.76461.25%
SEA -4.47 0.82163.86%
TOR -5.82 0.87363.89%
MTL -7.70 0.91758.08%
CHV -14.47 0.99360.64%
COL -14.92 0.99355.82%

The two teams that over-performed xGA the most, D.C. United and Real Salt Lake, also were in the top four for highest percentage of off target or blocked shots against. The correlation between these two variables is pretty high for 2014. For the years 2011 to 2014, it isn't quite as high, but is still significant. That is, the teams that over-perform expectations the most generally force higher than expected numbers of off target and blocked shots. This, of course, makes sense; shots that miss or get blocked can't become goals. United is once again forcing a lot of misses this season, as their percentage of shots that are off target or blocked stands at about 62 percent.

This, too, could merely be the product of luck. None of off target percentage, block percentage, or off target plus block percentage is, in general, particularly repeatable from season to season. However, off target plus block percentage is generally a good indicator of save percentage, at least for teams with the highest percentages (for whom it is less likely to be luck):

From these numbers, and from watching them play, the logical conclusion is that D.C. United pressures shooters on the ball, and gets defenders behind the ball, to the extent that they force opposing teams to shoot poorly, resulting in missed shots, blocked shots, and shots that are easy saves for the goalkeeper. Put another way, their defensive pressure causes teams to shoot at percentages below what expected goals models would predict. That D.C. United's defense leads to a high save percentage also means that their PDO will be a poor measure of how “lucky” they are.

As further evidence that this is not just luck, teams that consistently force a lot of blocked and missed shots also tend to be teams that allow a high proportion of shots from crosses. D.C. United and Real Salt Lake, 2014's two most over-performing teams, were also the two teams that faced the highest percentage of shots off crosses. This suggests those teams are making the conscious decision to pack the box and pressure shots, at the cost of allowing space out wide.

Most teams can be considered “good” defensively by the number of shots they give up. A low number of shots typically means a low number of expected goals, which in turn means a low number of goals. Other defenses are considered “good” because they only give up low percentage shots. They may give up a lot of shots, but, because those shots aren't likely to go in, they have low expected goals totals, and they don't allow many actual goals.

D.C. United's defense, as I've tried to show, takes a third way. They give up shots, from good positions, but because of their abnormally high defensive pressure,  those shots are more likely to miss the target or be blocked or saved, and therefore expected goals models overstate their chances of going in. Because of this, most metrics will systematically mis-evaluate the team's defense. This was the case last season, and it is once again the case at the start of this season. Presumably, expected goals models that incorporate defensive positioning would more accurately describe the team's defensive performance, but until the day comes when that data is made publicly available, we won't know for sure.

ASA Spring MLS Top-50 Rankings: Final Thoughts

by Harrison Crow (@Harrison_Crow)

If you haven't yet, check out the top 50 MLS player rankings that we released last week.

The initial conversation that took place when we entered the planning stages for this project had us talking about a top-100. Looking back, that maybe would have lead to a lot less scrutiny. What's the saying: "aim small, miss small?" Had we posted a top-20 more comments and frustration would be directed to those that were included than those left out. I think 50 has been a good mark and I think that's what we're going to stay with.

One the biggest things that has been hardest to discern in this endeavor is what type of value one position has in relation to others. I think we can all agree that attackers have most of our attention, the problem that most of us have is determining at what point does the value of an attack diminish that a defender or goalkeeper becomes just as valuable? Obviously that answer isn't necessarily spelled out in this project but it's something that each of us that had to consider with our vote.

Beyond the existential questions that come with this sort of thing there are some interesting correlations and general observances that come too. Let's talk about some of these things.

POSITIONAL REPRESENTATION

While we talked about strikers being highly valued (six of 14 finished in the top-10) there were more midfielders included in total. However, you have to consider there are twice as many midfielders on the pitch taking up minutes.

Looking on the defensive side you have Omar Gonzalez finishing 15th as the top defender in the pool and Bill Hamid finished with top honors at 16th overall for keepers.

However, an interesting note is that Chris Tierney made the list (barely) while ranking fourth overall in expected assists while teammate Kelyn Rowe who is having a big season thus far and siting 20th overall in xG+xA.

TEAMS REPRESENTATION

The biggest take away from this is that no longer can MLS teams have a player or the top 2-3 players and dominate. DC United, while agonizingly frustrating to understand,* exist as a cohesive and effective compilation of talent. Sporting has five players voted in the top-50 and yet sit mid table. In other words, having the best players doesn't translate to having the best team.

Teams need depth and more specifically quality depth. The chart above is another example of why managing your budget and not just counting on landing quality designated players is so very important.

* Check back here tomorrow for more on how DC United consistently "beat" the model.

Weekend Kick-off: Chicago Tries to Burn down City and the return of the Watchability Scale

by Harrison Crow (@Harrison_Crow)

Tonight our soccer weekend is treated to a special showcasing of New York City and Chicago Fire with two great American midfielders battling head-to-head. Yep, you guessed it; Dax McCarty v. Ned Grabavoy. Still a better and more pay-per-view worthy showcase than Mayweather vs Pacquiao. Still I will guess there will be at least two shoving altercations between the two in the match and that'll be something special.

Chicago went from being a team that you didn't know if they would win any games two months ago to questioning your sanity with if they could be contending for a playoff spot. I've said it once before and I'll say it again in a more cunning way; the Chicago Fire will go as far as their bleeding gunshot victim defense will allow them to go. It's not that they're bad so much as it's just that they're not good. They don't have one person on the defense that can stand up in the last few moments of a match and be the the difference maker. The whole time the Fire are leading you're not wondering if they can keep the lead but if they can score again to win the game... despite already leading. It's exciting and awful all at the same time, kind of like eating one of those 2,500 calorie burgers that you know are going to blow up your heart or clog your arteries. At least you'll enjoy the moments leading right before death.

New York City is kind of like that, only much worse. Much, much, worse. How much worse? They're a 2,500 calorie burger you're trying to eat in under five minute for a t-shirt" worse. A LOUSY T-SHIRT! Adam Richtman nearly died and we're still doing this. WAKE UP, SHEEPLE.

I suppose you could be a nihilist and point to the fact that NYC keeps possession of the ball. Heck, they rank second for possession. But as you might have figured out possession means squat. Oh, don't come at me with this whole Manchester United and Barcelona are good teams playing attractive soccer argument; for every one of those teams there is an equally beautiful team losing.

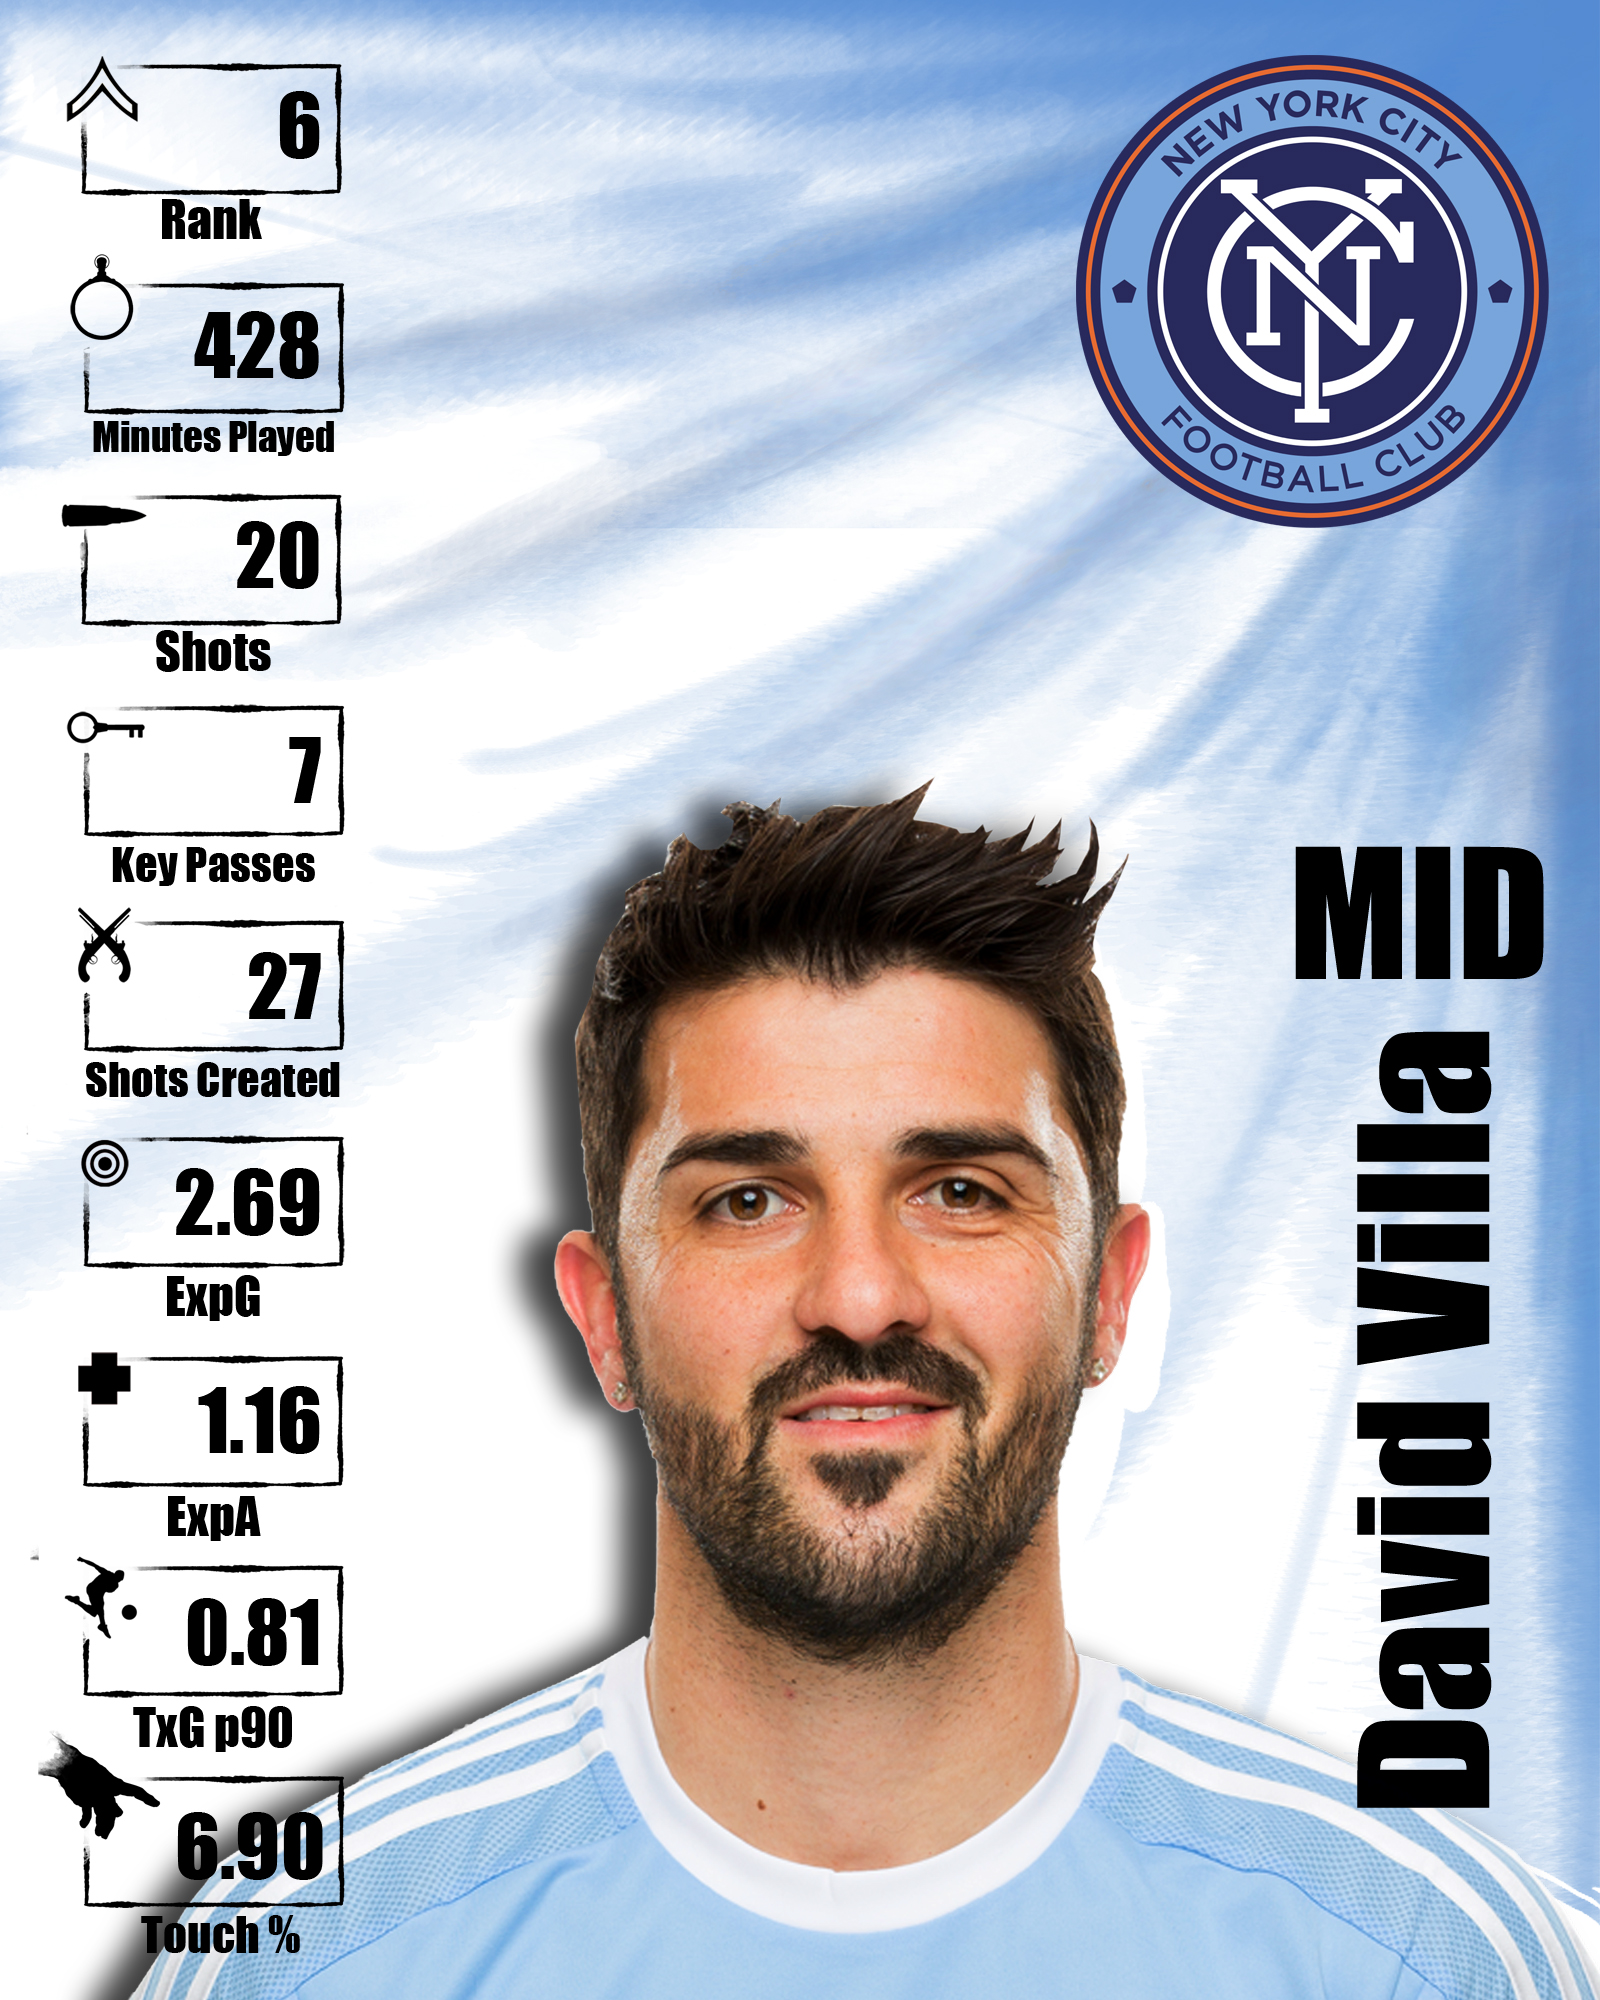
New York City attempts to play entertaining soccer, but they don't do it well. Whether that fault lies with Mix Diskerud, David Villa or someone else, on the pitch the bottom line lands just south of "it hasn't all clicked". I have a very rough guess of where things stem from but I don't think it'll be very welcomed. (This is where I share them regardless of if they are welcomed or not) I personally believe that some of this has to be laid at the feet of Diskerud. Not because of who he is or what he was supposed to be to this team, but the fact that his team holds the majority of it's possession in the midfield and he leads his club in touch% with 12.4%.

NYC hasn't used a lot of long passes (14th in MLS), thriving instead on short passes connecting the defense to the attack through a type of tiki-taka style possession intended to open up and expose their opponent's defensive shortcomings. Unfortunately for them, this has led to the most turnovers in MLS, most often occurring in the midfield, explaining why they have one of the highest expected goal differentials in MLS, sitting in the negative (because teams counter attack them to death). Yes, Chicago aren't a team that is traditionally going to punish you quick on the counter, but they have some pieces that could do it. Please wave high, David Accam. *David waves hello*

FANTASY PERSPECTIVE

CHICAGO FIRE

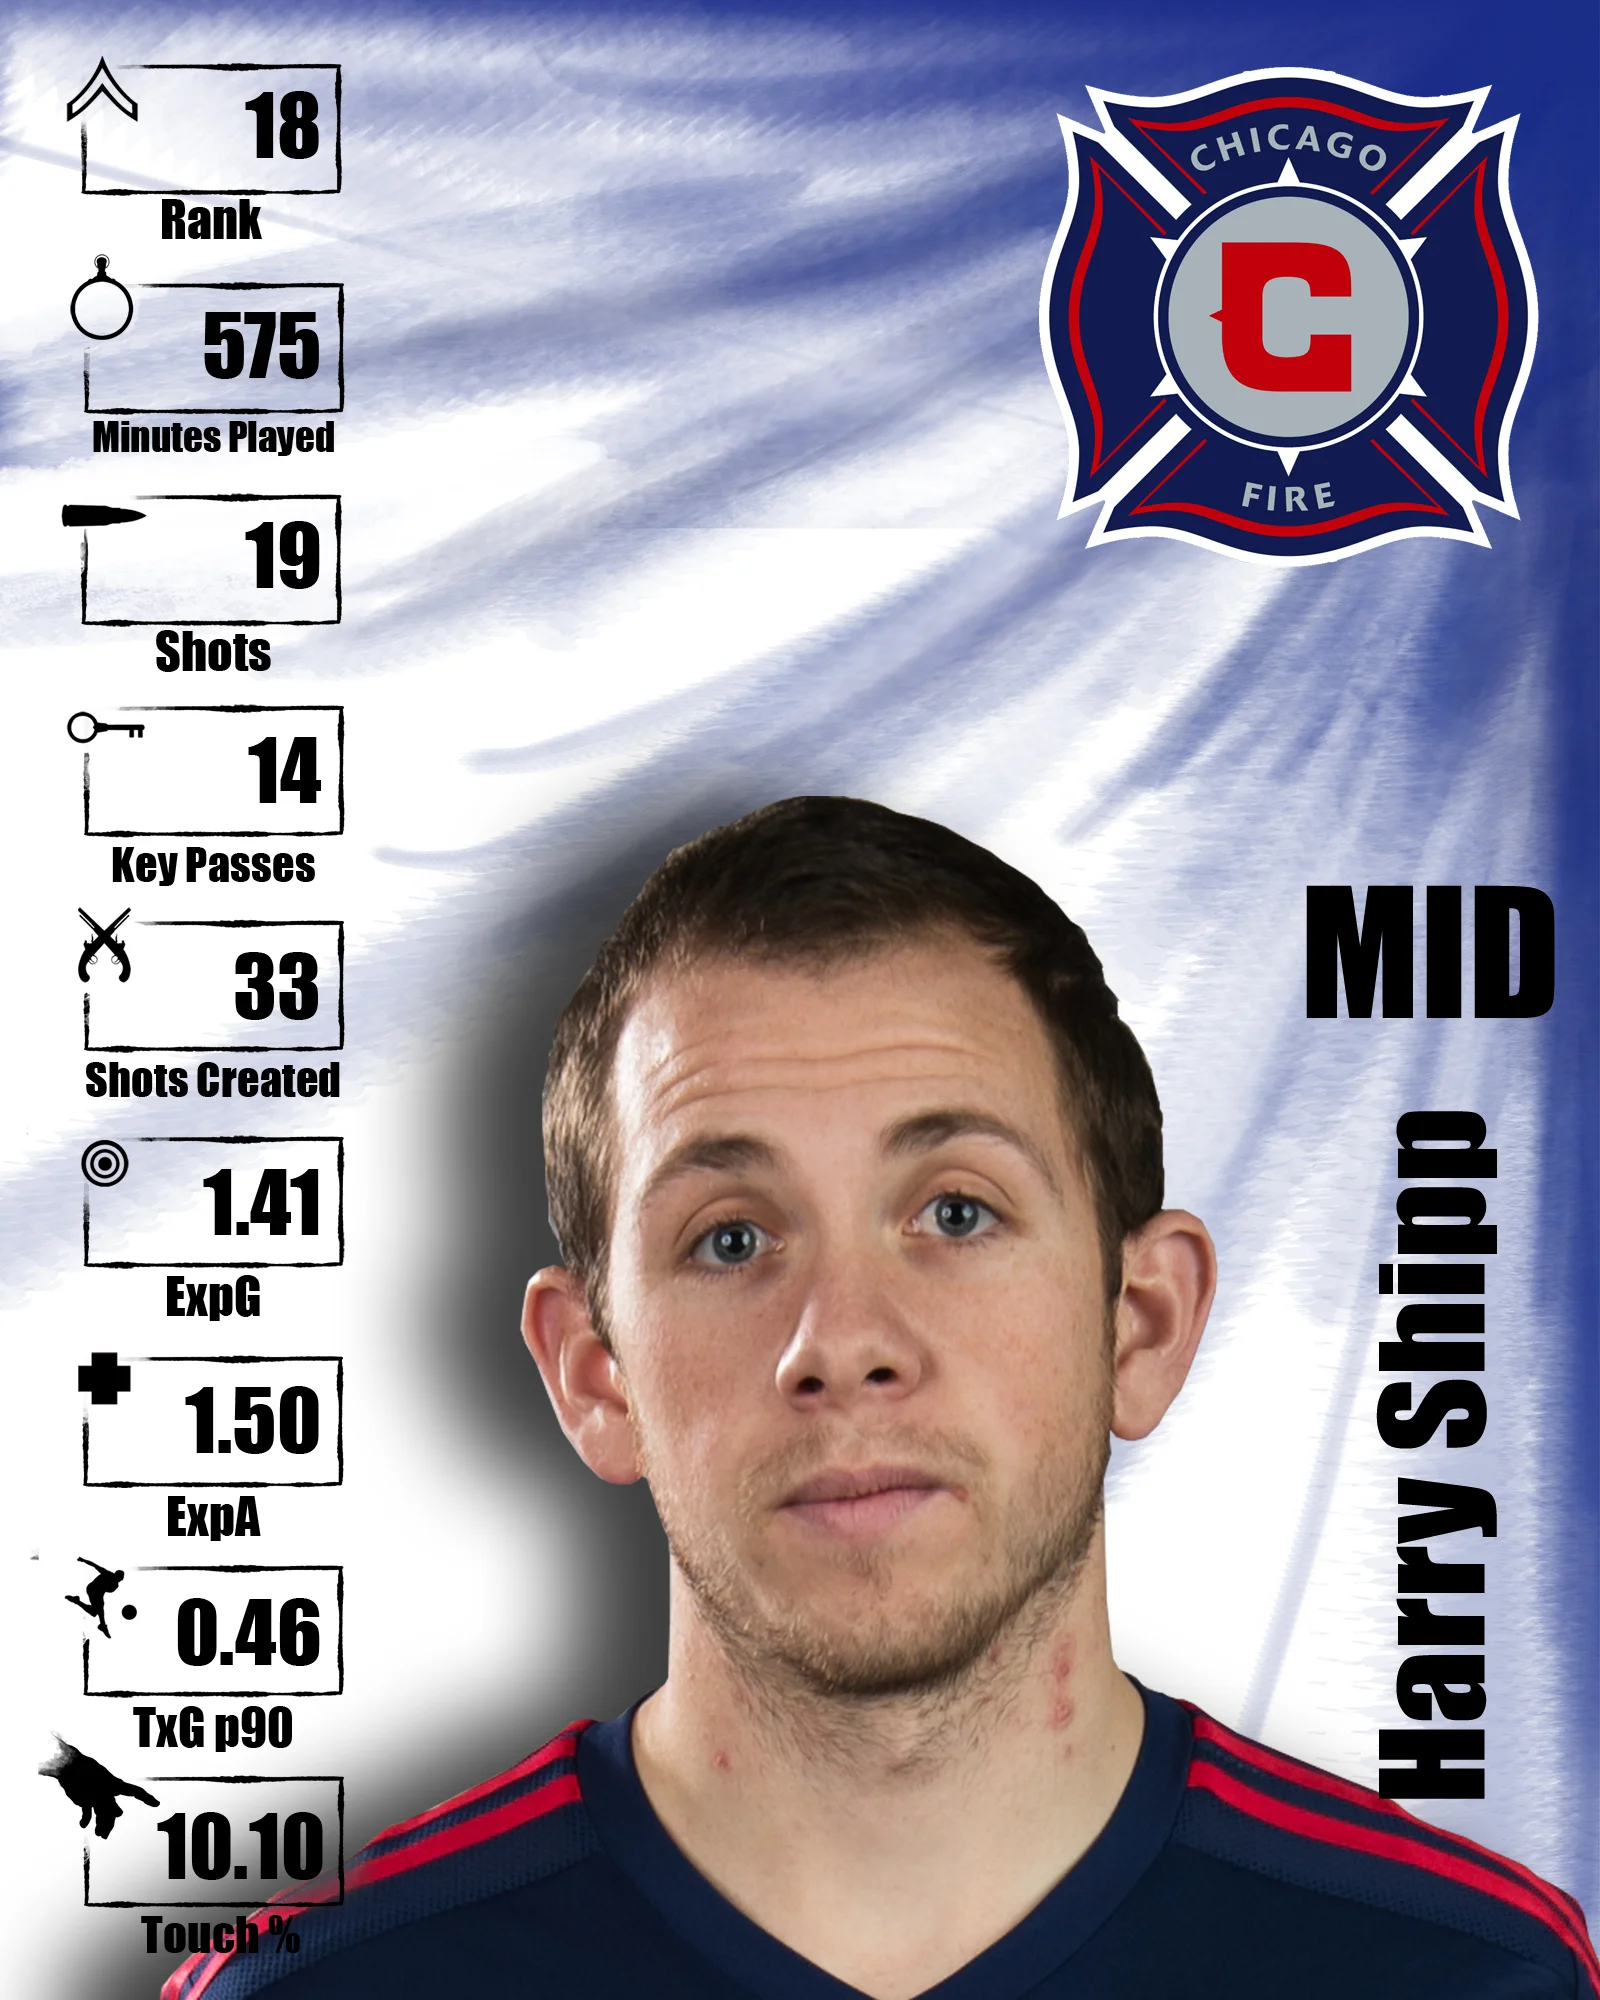
Harry Shipp (24.3% Selected, $7.9 Cost)

Shipp is possibly the most exciting player to emerge from MLS into the US pool in the past few years. It's not just that he plays a position that has some questions surrounding it in the coming future. He's unique in his approach and shows creativity, a skill that is specifically lacking within the depth.

Lovel Palmer (11.1% Selected, $5.8 Cost)

Make all the jokes you want about Palmer and his propensity for launching shots from 30-40 yards out like he was Morten 'Great Dane' Andersen running around with one bar on a football helmet.  But he doesn't cost much and his return on investment from is actually pretty good because... well, Chicago has no full back depth.

NEW YORK CITY

David Villa (12.1% Selected, $10.3 Cost)

If we've learned much to this point about New York City it's that the attack begins and ends with David Villa. The cost is steep but if he plays the payoff should be worth it. The question most will have to consider is the how Villa's health will continue to hold up.

Mix Diskerud (8.8% Selected, $9.1 Cost)

A good amount of people keep spending the money on Disk and I don't know why. Look, Mix is a good soccer player--he even came in 21st in our MLS Top-50 this week--but he's not a great fantasy player because what he is good at doesn't translates to most numbers that are of value in MLS fantasy. He's 39th overall in total points for MIDFIELDERS. Just not what I'd call a good buy.

THE WATCHABILITY SCORE
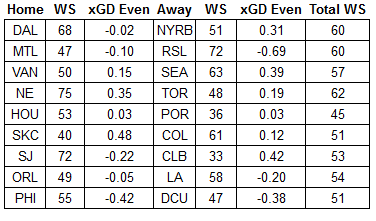
The Watchability score is back, get excited!

We're back at it and just right off the top you'll see the score really likes NYC-CHI Friday night. This is largely due to NYC being considered the most watchable team in MLS right now. It's also to do with the fact that both teams create shots, don't turn the ball over too often, and don't often foul or get fouled.

WS = Watchability Score, xGD Even = Expected goal differential in even game states

WS = Watchability Score, xGD Even = Expected goal differential in even game states

Looking ahead to Saturday, Houston and Portland looks to be a good game likely due to the amount of pretty ball handling and x`the likelihood for a close score line. Sporting and Colorado could be fun too (which is interesting considering one team takes tons of shots and another team prevents very few shots) and Sunday's Philadelphia and DC game might surprise you too because MLS!

Interestingly enough, the model isn't keen on two top of the standings teams facing off in Frisco with Dallas and Red Bull prepared to exchange blows. The model surprisingly projects this match to be one of the least interesting match-ups this weekend. This could be to the overwhelming amount of fouls that Dallas is apt to provide while also being apt to allow their opponent the lions share of possession against a team from Harrison, New Jersey that wants all the possession. This model might actually be onto something. The other is followed the next day by two bottom of the table teams in Montreal and Real Salt Lake.

THE WEEKEND MATCH-UPS

(expected goal differential in even game-states)

FRIDAY

New York City (-0.62) AT Chicago Fire (0.11)
Prediction: I'll take Chicago

New York Red Bulls (-0.02) AT FC Dallas (0.31)
Prediction: Surprisingly enough, I'll take Red Bulls. I'll admit that's because of BWP and my blossoming man-crush.

SATURDAY

Real Salt Lake (-0.69) AT Montreal Impact (-0.10)
Prediction: Montreal, I guess.

Seattle Sounders (0.39) AT Vancouver Whitecaps (0.15)
Prediction: I call a Draw. Bring it on Canada. I'm prepared to be wrong and considered bias. I just think Vancouver is falling back to earth.

Toronto FC (0.19) AT New England Revolution (0.35)
Prediction: Draw. Leave TFC alone!

Portland Timbers (0.03) AT Houston Dynamo (0.03)
Prediction: Draw...because somewhere there is a joke. Yes?

Columbus Crew SC (0.42) AT San Jose (-0.22)
Prediction: I'll say Columbus here but I'm 100% prepared for San Jose to do something ridiculous.

SUNDAY

LA Galaxy (-0.20) AT Orlando City (-0.05)
Prediction: Orlando City, if only because we'll get more stories about Steven Gerrard retiring to MLS and LA being in trouble.

DC United (-0.38) AT Philadelphia Union (-0.42)
Prediction: Philly, because you know what--they deserve something special damn it. I love you Jared, have a good weekend!


NERD IMAGERY


Because New York City is basically the sports embodiment of Britta Perry. It's true. Sad, but still true. Call me when Jason Kries gets desperate enough to start Patrick Mullins every match.


ASA Spring MLS Top-50 Rankings: 10-1

By Harrison Crow (@harrison_crow)

Monday, I introduced the who, what, where and why of this ranking, which was culled from the ballots of team front office personnel, MLS players, journalists, league analysts and other MLS experts. I'm sure there are going to be some disagreements, so hit us up on twitter or leave a comment below.

Check back later in the week for the rest of the rankings:
Monday: 50 through 41
Tuesday: 40 through 31
Wednesday: 30 through 21
Thursday: 20 through 11
Friday: 10 through 1

----------------------

ExpG: Expected Goals according to our player rankings
ExpA: Expected Assists
ExpSaves: Expected Goals Against minus Actual Goals Against according to our goalkeeper rankings.
Touch%: Percent of team's touches while on the field
TxGp90: Total Expected Goals per 90 minutes
Shots Created: Shots plus Key Passes

10. Fabian Castillo - Midfielder, FC Dallas
Total Score: 631

9. Michael Bradley - Midfielder, Toronto FC
Total Score: 632

8. Jozy Altidore - Forward, Toronto FC
Total Score: 640

7. Octavio Rivero - Forward, Vancouver Whitecaps
Total Score: 648

6. David Villa - Forward, New York City
Total Score: 703

5. Robbie Keane - Forward, LA Galaxy
Total Score: 719

4. Sebastian Giovinco - Forward, Toronto FC
Total Score: 848

3. Clint Dempsey - Forward, Seattle Sounders FC
Total Score: 907

2. Obafemi Martins - Forward, Seattle Sounders FC
Total Score: 918

1. Kaka - Forward, Orlando City SC
Total Score: 925

ASA Spring MLS Top-50 Ranking: 20-11

By Harrison Crow (@harrison_crow)

Monday, I introduced the who, what, where and why of this ranking, which was culled from the ballots of team front office personnel, MLS players, journalists, league analysts and other MLS experts. I'm sure there are going to be some disagreements, so hit us up on twitter or leave a comment below.

Check back later in the week for the rest of the rankings:
Monday: 50 through 41
Tuesday: 40 through 31
Wednesday: 30 through 21
Thursday: 20 through 11
Friday: 10 through 1

----------------------

ExpG: Expected Goals according to our player rankings
ExpA: Expected Assists
ExpSaves: Expected Goals Against minus Actual Goals Against according to our goalkeeper rankings.
Touch%: Percent of team's touches while on the field
TxGp90: Total Expected Goals per 90 minutes
Shots Created: Shots plus Key Passes

20. Dom Dwyer - Forward, Sporting KC
Total Score: 438

19. Kei Kamara - Forward, Columbus Crew
Total Score: 493

18. Harry Shipp - Midfielder, Chicago Fire
Total Score: 525

17. Darlington Nagbe - Midfielder, Portland Timbers
Total Score: 583

16. Bill Hamid - Goalkeeper, DC United
Total Score: 589

15. Omar Gonzalez - Defender, LA Galaxy
Total Score: 594

14. Pedro Morales - Midfielder, Vancouver Whitecaps
Total Score: 594

13. Federico Higuian - Midfielder, Columbus Crew
Total Score: 602

12. Bradley Wright-Phillips - Forward, New York Red Bulls
Total Score: 606

11. Benny Feilhaber - Midfielder, Sporting KC
Total Score: 624


ASA Spring MLS Top-50 Ranking: 30-21

By Harrison Crow (@harrison_crow)

Monday, I introduced the who, what, where and why of this ranking, which was culled from the ballots of team front office personnel, MLS players, journalists, league analysts and other MLS experts. I'm sure there are going to be some disagreements, so hit us up on twitter or leave a comment below.

Check back later in the week for the rest of the rankings:
Monday: 50 through 41
Tuesday: 40 through 31
Wednesday: 30 through 21
Thursday: 20 through 11
Friday: 10 through 1

----------------------

ExpG: Expected Goals according to our player rankings
ExpA: Expected Assists
ExpSaves: Expected Goals Against minus Actual Goals Against according to our goalkeeper rankings.
Touch%: Percent of team's touches while on the field
TxGp90: Total Expected Goals per 90 minutes
Shots Created: Shots plus Key Passes

30. Sascha Kljestan - Midfielder, New York Red Bulls
Total Score: 332

29. Juan Agudelo - Forward, New England Revolution
Total Score: 353

28. Kyle Beckerman - Midfielder, Real Salt Lake
Total Score: 356

27. Dax McCarty - Midfielder, New York Red Bulls
Total Score: 356

26. Nick Rimando - Goalkeeper, Real Salt Lake
Total Score: 390

25. Lloyd Sam - Midfielder, New York Red Bulls
Total Score: 395

24. Mix Diskerud - Midfielder, New York City FC
Total Score: 397

23. Matt Besler - Defender, Sporting Kansas City
Total Score: 402

22. Lee Nguyen - Midfielder, New England Revolution
Total Score: 413

21. Javier Morales - Midfielder, Real Salt Lake
Total Score: 416

21.jpg


ASA Spring MLS Top-50 Ranking: 40-31

By Harrison Crow (@harrison_crow)

Yesterday, I introduced the who, what, where and why of this ranking, which was culled from the ballots of team front office personnel, MLS players, journalists, league analysts and other MLS experts. I'm sure there are going to be some disagreements, so hit us up on twitter or leave a comment below.

Check back later in the week for the rest of the rankings:
Monday: 50 through 41
Tuesday: 40 through 31
Wednesday: 30 through 21
Thursday: 20 through 11
Friday: 10 through 1

----------------------

ExpG: Expected Goals according to our player rankings
ExpA: Expected Assists
ExpSaves: Expected Goals Against minus Actual Goals Against according to our goalkeeper rankings.
Touch%: Percent of team's touches while on the field
TxGp90: Total Expected Goals per 90 minutes
Shots Created: Shots + Key Passes

40. Wil Trapp - Midfielder, Columbus Crew
Total Score: 228

39. Ignacio Piatti - Midfielder, Montreal Impact
Total Score: 243

39.png

38. Perry Kitchen - Midfielder, DC United
Total Score: 250

38.png


37. Graham Zusi - Midfielder, Sporting KC
Total Score: 253

37.png

36. Blas Perez - Forward, FC Dallas
Total Score: 279

36.jpg

35. Dillon Powers - Midfielder, Colorado Rapids
Total Score: 285

35.jpg

34. Matias Laba - Midfielder, Vancouver Whitecaps
Total Score: 293

34.jpg

33. Chad Marshall - Defender, Seattle Sounders
Total Score: 312

32.  Osvaldo Alonso - Midfielder, Seattle Sounders
Total Score: 316

31. Ike Opara - Defender, Sporting KC
Total Score: 327


ASA Spring MLS Top-50 Ranking: 50-41

By Harrison Crow (@harrison_crow)

Earlier today, I introduced the who, what, where and why of this ranking, which was culled from the ballots of team front office personnel, MLS players, journalists, league analysts and other MLS experts. I'm sure there are going to be some disagreements, so hit us up on twitter or leave a comment below.

Check back later in the week for the rest of the rankings:
Monday: 50 through 41
Tuesday: 40 through 31
Wednesday: 30 through 21
Thursday: 20 through 11
Friday: 10 through 1

----------------------

ExpG: Expected Goals according to our player rankings
ExpA: Expected Assists
ExpSaves: Expected Goals Against minus actual Goals Against according to our goalkeeper rankings.
Touch%: Percent of team's touches while on the field
TxGp90: Total Expected Goals per 90 minutes
Shots Created: Shots plus Key Passes

50. Tyler Deric - Goalkeeper, Houston Dynamo TOTAL SCORE: 160

49. Ethan Finlay - Right Midfielder, Columbus Crew
Total Score: 161

48. Juninho - Central Midfielder, LA Galaxy
Total Score: 169

47. Felipe Martins - Attacking Midfielder, New York Red Bulls
Total Score: 171

46. Chris Tierney - Left Fullback, New England Revolution
Total Score: 172

45. Justin Meram - Left Midfielder, Columbus Crew
Total Score: 174

44. Matt Hedges - CentERback, FC Dallas
Total Score: 184

43. Kendall Waston - Centerback, Vancouver Whitecaps
Total Score: 188

42. Gyasi Zardes - Forward, LA Galaxy
Total Score: 189

41. Chris Wondolowski - Forward, San Jose Earthquakes
Total Score: 223