

The effect of shot limiting in MLS: Part One
/By Sean Steffen (@seansteffen)
This is part one of a two part series. Click here if you're looking for part two.
Thanks to their effectiveness at measuring and predicting aspects of an offense, we’ve seen shot based models, such as the expected goals model (xG) here at American Soccer Analysis, become increasingly popular. On the defensive side however, things are proving a lot harder to quantify.
Given the nature of the expected goals (xG) model, one technique is to look at a defense’s ability to limit certain factors important to xG output. One such factor is shot volume. As you can see below, there is a high correlation between shots against and expected goals against, with an R² = 0.5547.

In other words, a team’s ability to limit shots seems to be heavily tied to its ability to limit xG against. This is both extremely helpful because it gives us an evaluative tool to judge defenses with and not helpful at all because, to my knowledge, not a lot of people have explored the factors that go into shot limiting. Without knowing how teams like SKC and LA manage to keep shots to a minimum, we really can’t use this tool to its fullest.
Possession
The first thing I looked at was possession. It stands to reason that keeping the ball away from an opponent will limit shots. Here are the r-squared values for possession vs. shots against over our 4 years of possession data.
| Year | Possession vs Shots Against R-Squared |
|---|---|
| 2011 | 0.33 |
| 2012 | 0.37 |
| 2013 | 0.38 |
| 2014 | 0.13 |
| 2011-2014 | 0.28 |
Here it is plotted out.

From 2011 to 2013, there seems to be a consistent and somewhat strong correlation between possession and shots against, however, 2014 saw a remarkable plunge. While it’s possible that 2014 is just an outlier, if you add 2015 (as of 6/23) to the data pool, the R²plummets further to 0.1651.
This suggests one of two things; the first is that we are just seeing some screwy stat anomalies since that 0.1651 falls very close to the margin of error over five years of data. The other possibility is that the league playing style has shifted in a manner that has caused the plummet in correlation over the past year and a half. Perhaps this is because 2014 saw a number of elite possession teams such as RSL and NYRB give up so many shots, while a handful of non possession teams like Philadelphia, Chicago, and Colorado were among the best shot limiters. Take a look.
| 2014 team | PossPct | ShotsA |
|---|---|---|
| SKC | 0.565 | 10.2 |
| RSL | 0.558 | 13.7 |
| LA | 0.552 | 10.2 |
| CLB | 0.539 | 12.3 |
| NYRB | 0.527 | 13.6 |
| POR | 0.518 | 13.8 |
| SEA | 0.509 | 12.9 |
| COL | 0.507 | 11.1 |
| NE | 0.49 | 12.6 |
| HOU | 0.49 | 14.1 |
| VAN | 0.488 | 13 |
| SJ | 0.488 | 16.1 |
| TOR | 0.486 | 12.7 |
| DCU | 0.482 | 13.5 |
| PHI | 0.48 | 11.9 |
| FCD | 0.47 | 14.4 |
| MTL | 0.467 | 13.4 |
| CHI | 0.459 | 12.1 |
| CHV | 0.424 | 12.9 |

Is MLS seeing a resurgence of an effective bunker? Are some of the higher possession teams now more defensively flawed than their counterparts three years ago? Before we explore this further, there are a few more correlations I would like to explore, and, suffice it to say, regardless of the 2014 numbers, a 0.2825 r-squared over four years of data is still relatively significant and suggests possession is indeed somewhat important to shot limiting, but not nearly as much as you would expect.
Possession against in the final 3rd
I next decided to look at what parts of the field the opposing teams were possessing the ball. It stands to reason that possession in the final third will correlate to shots, therefore limiting said possession would limit shots. Unfortunately, we only have data for possession against in the final 3rd for 2014 and 2015, so the data size is not nearly as rich. This was ultimately much to my chagrin because the data we have is promising.
| Year | Possession vs Shots Against R-Squared |
|---|---|
| 2014 | 0.33 |
| 2015 (6/23) | 0.45 |
| 2014-2015 | 0.37 |
Interestingly, this not only yielded our highest r-squared yet of 0.4544 for 2015’s data, but we also saw a high correlation in 2014, a year that was an outlier in terms of possession to shots against. And when you compare the two scatter plots, you can see that a number of the lower possession outliers get reigned in.

This seems to suggest that a higher than normal number of teams successfully sat back in 2014 looking to deny their opponents final third possession. Since this tactic comes at the expense of allowing more possession to the opponent in the first and middle third, this would explain why the possession correlations were so off in 2014 and continue to be in 2015.
Ultimately the correlation between shots and possession against in the final third shows great promise, but, with a margin of error at 0.3202 over such a small data range, it’s hard to tell just how important of a factor it is when it comes to limiting shots.
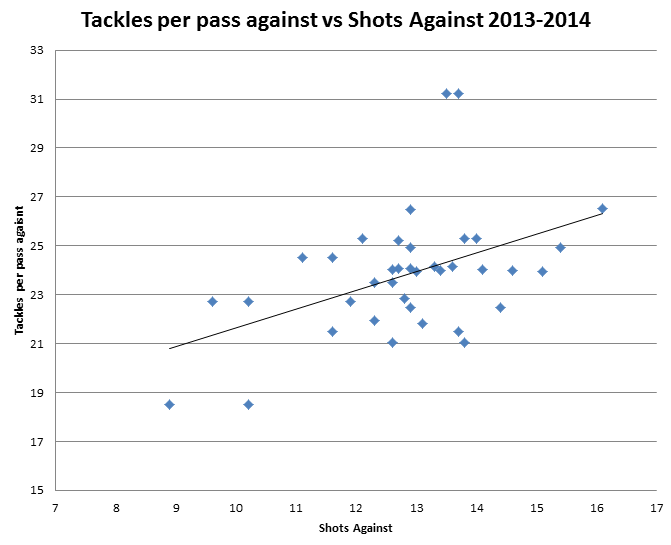
Tackles per pass against
Next I looked at possession adjusted defensive metrics to see how well they correlated. I looked at Passes Allowed per Pressing Action, Passes Allowed per Interception and Passes Allowed per Tackle and the latter yielded the highest correlation however the r-squared over two years fell comfortably within our large margin of error over this period 0.3244. Once again, more data is needed but preliminarily, at least, its surprising how little possession adjusted defensive metrics correlate to shots against, as one would expect tackles to correlate to fewer shots.
| Year | Tackles per pass against
vs Shots Against |
|---|---|
| 2013 | 0.29 |
| 2014 | 0.14 |
| 2013-2014 | 0.15 |
Miscellaneous
I examined a lot more than these but have excluded many which exhibited little to no sign of correlation at all in the interest of (relative) brevity. Among the most logical assumptions and thus surprising lack of correlation include percentage of set piece shots against, shot leverage and shots for.
As you can see, shot limiting is an incredibly complex aspect of the game and it appears there are multiple ways of doing it, which explains why no single metric gives us a good correlation. The correlation between possession and shot limiting seems to be our most concrete, thanks to a more complete data set. Still, 2014 and 2015 have seen a major decline in this correlation. While 2014 and 2015 completely tank our possession correlations, they happen to be the only years we have possession allowed in final third data and both years show a strong correlation.
And although possession is merely an inverse of possession allowed, the correlation between possession and possession allowed in the final 3rd is not as strong as you would think over the last year and a half of data. In fact, the Rsquared is merely 0.1772
This suggests the obvious. Not all possession teams are alike and not all “bunker” teams are alike and there are teams representing both camps that are very good at limiting shots and teams that are very bad.
For example: LA, SKC, RSL and Columbus are all high possession teams and also happened to allow the fewest amount of passes in the final third per 90, however, NYRB was also a high possession team and allowed significantly more passes in the final third. The 5th best team, Colorado, is a near even possession team and also managed to be the 3rd best shot limiters in the league last year, easily besting the shots against totals of Columbus and RSL.
| 2014 teams | Final 3rd Passes Allowed p90 |
|---|---|
| SKC | 22.49 |
| RSL | 29.74 |
| CLB | 31.19 |
| LA | 32.5 |
| COL | 35.23 |
| POR | 36.94 |
| HOU | 37.53 |
| NYRB | 38.01 |
| PHI | 39.5 |
| NE | 40.2 |
| VAN | 41.25 |
| CHV | 41.32 |
| TOR | 41.76 |
| CHI | 42.05 |
| SJ | 43.02 |
| MTL | 45.67 |
| FCD | 48.78 |
| DCU | 50.21 |
| SEA | 52.66 |
While possession teams allow the opponent fewer passes overall, many of them in 2014 were prone to defensive breakdowns as indicated by their low passes allowed in final third per shot against figures.
| 2014 Team | Passes allowed in final 3rd per shot against |
|---|---|
| RSL | 2.17 |
| SKC | 2.2 |
| CLB | 2.54 |
| HOU | 2.66 |
| SJ | 2.67 |
| POR | 2.68 |
| NYRB | 2.79 |
| VAN | 3.17 |
| COL | 3.17 |
| LA | 3.19 |
| NE | 3.19 |
| SEA | 3.2 |
| TOR | 3.29 |
| PHI | 3.32 |
| FCD | 3.39 |
| MTL | 3.41 |
| CHI | 3.48 |
| DCU | 3.72 |
| CHV | 4.08 |
Here we see LA pull away from the possession pack showing that they are simply harder to break down in the final third than most possession teams. Surprisingly, SKC is not all that good in this department, however, when you consider the degree to which they stand above the rest of the league in terms of final third pass limiting (RSL is closest and is still a whopping 7.3 passes per 90 away), they probably didn’t have to be.
Perhaps this is the result of their high press defense. By defensively engaging the ball higher up the field, they make it hard for the opposition to get into the final third. When the opposition does, however, perhaps there is far more space for attackers in the final third than you would see against your average MLS team, precisely because SKC’s high press has pulled players out of position. In other words, there is lots of space to be had if you can survive the initial pressure.
Expanding on this idea, possession generally comes at the expense of position as possession soccer tends to pull players out of positions advantageous to team shape. If certain possession teams are struggling defensively, this could explain why. But this also raises the question, why is LA and SKC’s brand of possession soccer not giving up as many shots as RSL’s or Columbus’? The same can be asked about teams that sit back. How can a team like Chicago who allows just as many final third passes as San Jose give up an average of 4 fewer shots per 90?
The answer, I suspect, lies in the tactics of each individual team. That will be the focus of part two of this article. Click here for part two, where I dig further into this question.