

The effect of shot limiting in MLS: Part Two
/By Sean Steffen (@seansteffen)
This is part two of a two part series. Click here for part one.
In part one of this study I demonstrated that from a shot limiting standpoint, there is a right way and a wrong way to play possession soccer, and there is right way and a wrong way to sit back. But what distinguishes the efficient from the inefficient? Ultimately I believe it to be a matter of tactics and team spacing.
The tactics of defending revolve around the concept of lines and line spacing. Where you set your line of confrontation and the amount of space between all subsequent lines has a major impact on the way the game is played. This is something I hinted at in part one in order to explain why SKC managed to be so successful at shot limiting despite their high number of final third passes allowed per shot against.
By engaging the ball higher up the field, SKC limited their opponent’s ability to get into the final third, but did so at the expense of shape. This is why, when teams were able to break through the initial pressure and enter the final third, they were able to create a shot within a relatively small number of passes. In the case of SKC in 2014, this tradeoff paid off and they managed to finish the season tied with LA for the fewest number of shots given up per game.
This is but one example of how defensive lines can alter a game, however, it’s ultimately an extreme one within the confines of MLS where such aggressive pressing tactics are rare. In MLS at least, the line of confrontation seems less important than the number and spacing of subsequent lines.
To measure this, I looked at how defensive actions were divided amongst players within each team. Usually it’s common practice to define defensive actions as tackles, interceptions and blocks, but since this paper is on shot limiting, I thought measuring blocks would be counter intuitive so I decided to replace it with clearances.
Borrowing a page from Benjamin Harrison’s book, I plotted each player’s defensive actions per 90 against their passes per 90 in order to get a sense of the field positioning of each action. While the method is hardly full proof, it has proven to extremely effective at mimicking shape by proxy.
More importantly, it can give us a sense of which players aren’t pulling their weight defensively when compared to similar players on the team.
The results were interesting and could offer a clue as to why LA and SKC were such elite shot limiting teams. At the top of each chart is the team name, how many shots against they averaged in 2014, and how many percentage points they were above or below the leagues possession average.


As you can see, both teams are extremely linear in their load sharing and even more interestingly, both teams are grouped in such a way that there are no huge gaps between lines, and each line is manned by multiple people.
The next most impressive shot limiting team is Colorado. Granted, Colorado didn’t really have a consistent preferred 11 last year so this is a tad more difficult than most teams, but as you can see; they are as well spaced and disciplined as LA.

Their significantly lower possession numbers than SKC and LA may point to the difference between their shots against numbers. In other words, LA and SKC show ideal spacing and their extra possession is the cherry on top that makes them fall below the trendline of what’s expected of teams which give up similar levels of possession against in the final third.
Colorado, on the other hand, whose spacing is just as good as LA and SKC and thus are equally good at limiting possession in the final third, is an average possession team, which may be why they fall closer to the trend line. Colorado also has five players with between 2-6 defensive actions per 90, which suggest s a high line.
The theory of grouped line spacing is rather simple and can be thought of this way. The best defensive midfielder in the world, left alone to man a significant amount of field from sideline to sideline, effectively constituting a line unto himself, can’t be nearly as effective as two less talented players manning that same space. For this reason, inherently balanced formations such as the 4-4-2 and 4-3-3, which make it easier for players to stick to their lines, have enjoyed a tremendous amount of longevity over the years.
But formations are not rigid constants and ultimately it often comes down to how well individual players are able to track back or close down space. This can be seen in a few of our possession oriented outliers and can help explain why they weren’t better shot limiters.

Columbus had excellent possession numbers and had the 3rd lowest possession against numbers in the final 3rd. Columbus was one of the better shot limiting teams in 2014 but their Achilles heel, it seems, was defensive breakdowns as they have the 3rd lowest final third passes to shots against total.
Our chart suggests that shape might have played a factor. LA had four players who had between two and six defensive actions. SKC had five. Columbus had two. Finlay’s lack of defensive contribution essentially leaves Meram alone between two defensive lines where as LA and SKC’s charts are well spaced and players are grouped in twos.
Next, let’s look at RSL:

The gap between Saborio and Mulholland/Grabavoy is quite large and Morales is the only one filling it. Like Columbus, RSL is not confronting the ball high enough up the field, with only two players with 2 – 6 defensive actions. It’s also possible that the diamond works against RSL as it inherently staggers their lines. They also don’t shoot a lot relative to their own possession, and spend a tremendous amount of time at an even game state.
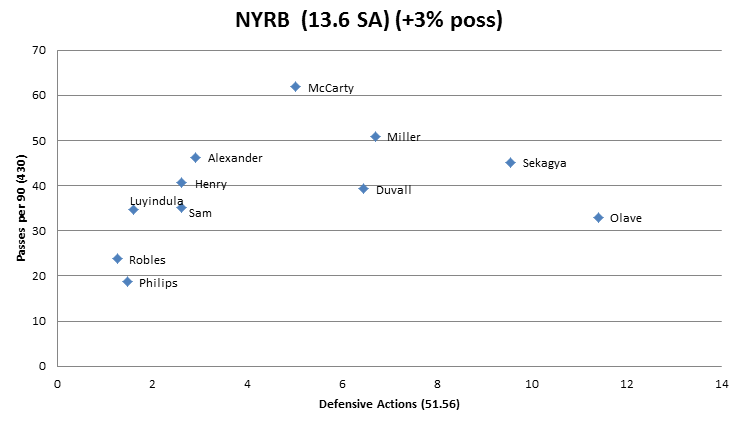
New York is another example where you have a huge gap with only a single man – McCarty - filling it. They also suffered from sending an insane amount of people forward with little backstop to compensate.
But as I said before, there also seems to be a right way and a wrong way to bunker. The right way seems to be exhibited by the success of the Philadelphia Union and Chicago Fire.

Inconsistent minutes made this a hard team to chart but Philadelphia seems exceptional in two regards. For one, the defensive actions of their outside backs were on par with many center backs in the league. They also had the 9th fewest passes allowed in the final third in the league which is quite remarkable considering their own lack of possession and can only be contributed to winning the ball in the middle third more than most.
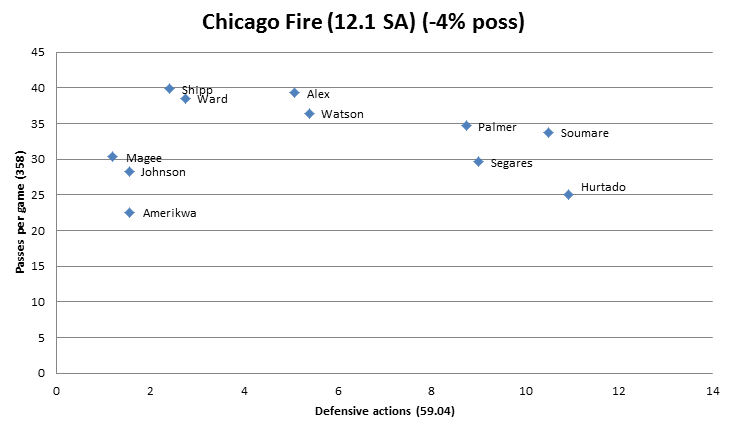
Chicago may not have been able to hold the ball to save their life, but their grouping is just plain eerie and it is quite possible they practiced with electric dog collars. As we’ve already explored, even grouping is a trait shared by the best shot limiting teams in the league, presumably because it helps teams keep the ball in front of them as it prevents lines from being bypassed as easily.
Now let’s take a look at the two worst shot limiting teams in the league as an example of how not to defend without majority possession.
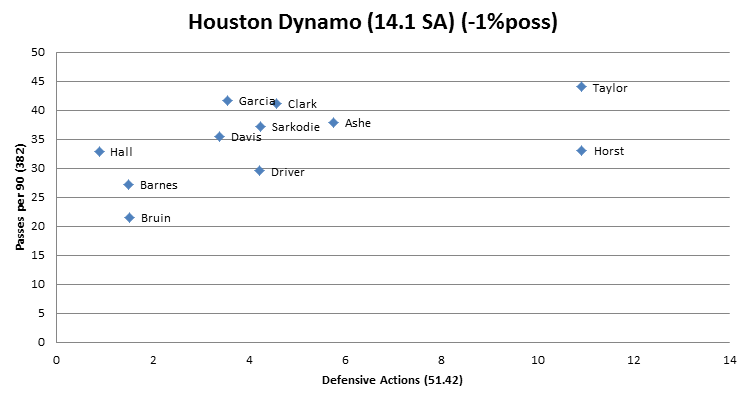
I had to check my numbers multiple times because this chart is just plain cartoonish. Is Ricardo Clark really that bad? What in the world is going on with their outside backs? Suffice to say, Houston was a freaking mess and it’s completely understandable that someone got fired over this.

San Jose allowed the 5th highest amount of passes in the final third and also the 5th lowest amount of passes in the final third per shot, which helps to explain why they allowed the most shots against as a team over our four years of data.
The isolation of Francis and Harris and the relatively low defensive work rate of Salinas seems to point to structural problems. The gap Francis sits in is quite large, and it’s not like San Jose was running a high press.
Spacing conclusions
Overall, without actual zonal defensive usage data, my observations are hard to confirm, but these charts have proven to be a pretty good proxy for positioning in the past and they certainly seem to suggest that grouping and spacing are important to shot limiting. As you can see, of the top four teams, three have four lines of two or more and the one that doesn’t runs a high press and keeps actions off the backline.

Possession
To review, shot limiting is a complex issue and in reviewing the data there doesn’t seem to be any silver bullets. We are also have crippled by a limited data set on the perhaps the most promising lead, possession allowed in the final third. To review, here are our totals:
| Year | Shots for vs Against R-Squared | Possession vs Shots Against R-Squared | PossessionA 3rd vs Shots Against R-Squared | Tackles per pass against vs Shots Against |
|---|---|---|---|---|
| 2011 | 0.017 | 0.33 | ||
| 2012 | 0.072 | 0.371 | ||
| 2013 | 0.323 | 0.379 | 0.287 | |
| 2014 | 0.305 | 0.13 | 0.388 | 0.138 |
| 2015 | 0 | 0 | 0.454 | |
| All data | 0.167 | 0.283 (0.165 when adding 2015) | 0.367 | 0.153 |
I think it’s safe to say that possession does indeed play a role in shot limiting. Final third possession also seems important, however organization in the back seems to have the ability to negate this and there is certainly something to be said for being hard to break down. In a similar vein, spacing also seems significant, with an emphasis on grouping. If you’ve managed to stick with me through nearly three thousand words, sorry there isn’t anything more conclusive to report, but that’s science for you.