

Chris Armas’ transformation of the New York Red Bulls
/By Cheuk Hei Ho (@tacticsplatform)
Coaching the New York Red Bulls must be a dream for most managers in North America's soccer circle, but Chris Armas also has had one of the toughest tasks in MLS. A mid-season takeover is never easy, let alone the takeover of a contender from the legendary Jesse Marsch. The Red Bulls organization may have boasted that they focus on the same pressing style starting from the academy, but everyone has their own unique ideas they want to implement. Armas is treading a fine line: he is introducing new elements while also keeping what was working for Marsch. The Red Bulls are still playing a similar style of soccer, so it appears Armas has been making quantitative, rather than qualitative, changes. Deciphering those changes will require some analytics techniques.
I first look at how New York has fared under the two managers using different variants of Expected Possession Goal (xPG). I recommend you read that full article, but in short it’s a score that measures the risks a team bears vs the rewards it creates. In short, Negative xPG measures the risks a team bears, while Mistake xPG measures the amount of turnovers a team commits from those risks.
For all four variants, both Negative and Mistake xPG show significant differences between Marsch's and Armas' teams:
The comparison of Positive xPG, Negative xPG, Successful xPG, Mistake xPG, number of touches, and number of touches per possession (pp) under Marsch vs Armas. The Negative xPG, Mistake xPG, and the number of touches decrease under Armas.
Both Negative xPG and Mistake xPG show about a 14% decrease in Armas' teams. This result shows that Armas' team is taking fewer risks and committing fewer turnovers. Since the decrease of both parameters is almost the same (~14%), the result also suggests that Armas' team is taking care of the ball to a similar extent. The pass success data are consistent with that suggestion: Marsch's team made roughtly 70% of its passes while Armas' is making about 66% of them.
Since we calculate xPGs by adding all the Non-shot zonal xGs (a score to measure the risk and reward of individual action) together, the number of activities a team carries will impact xPG values. Armas' team may be taking 14% fewer risks and turnovers than Marsch's because it is using fewer touches. The data is consistent with this suggestion: the Red Bulls average about 400 touches per game under Armas, which is 60 fewer than they did under Marsch.
But the decrease in touches alone can't fully explain Armas' changes; although the decrease amounts to about 13% and seemingly explains the drop in risks and turnovers for Armas' team, it doesn't explain the unchanged Positive and Successful xPGs. Both variants measure the potential and materialized actions a team creates. If the Red Bulls decrease their risk by merely reducing the number of touches they make, they should also be generating fewer rewards under Armas. They don't. They average similar Positive and Successful xPGs under both managers. Therefore, not only the number of touches has changed under Armas, the locations of the touches must have changed too.
In other words, the total value of actions under both managers has been essentially identical, though under Armas the team is getting fewer touches on the ball. Thus, the average quality of each touch has increased.
Armas must have made significant tactical changes to the Red Bulls if both the quantity and the distribution of touches have changed:
The changes in distribution of the Red Bulls’ touches from Marsch to Armas.
This heat map shows the changes in the numbers of touches in different zones between Marsch and Armas. Orange means there are fewer touches in that area under Armas than there were under Marsch, and purple means there are more touches there.
Just like the xPG variants and the passes' data suggest, Armas' Red Bulls have a made significant adjustment in how and where they control the ball. New York not only decreases their touches in their own half, but it also increases them closer to the goal. The decrease in touches in their own half explains their drop of Negative and Mistake xPG. Because they’re not touching the ball there, they’re exposing themselves to less risk. The increase of touches closer to the opponent goal compensates for the 13% decrease in total passes, and which is how they’ve maintained a similar level of Positive and Successful xPG. Armas has made changes so that his team can maintain Marsch's attacking prowess while also taking fewer risks.
Let’s go deeper. Next we can take a look at the changes in behavior by individual players.
The contour density distribution of player’s touches under Marsch. Only players with more than three starts at one position are shown.
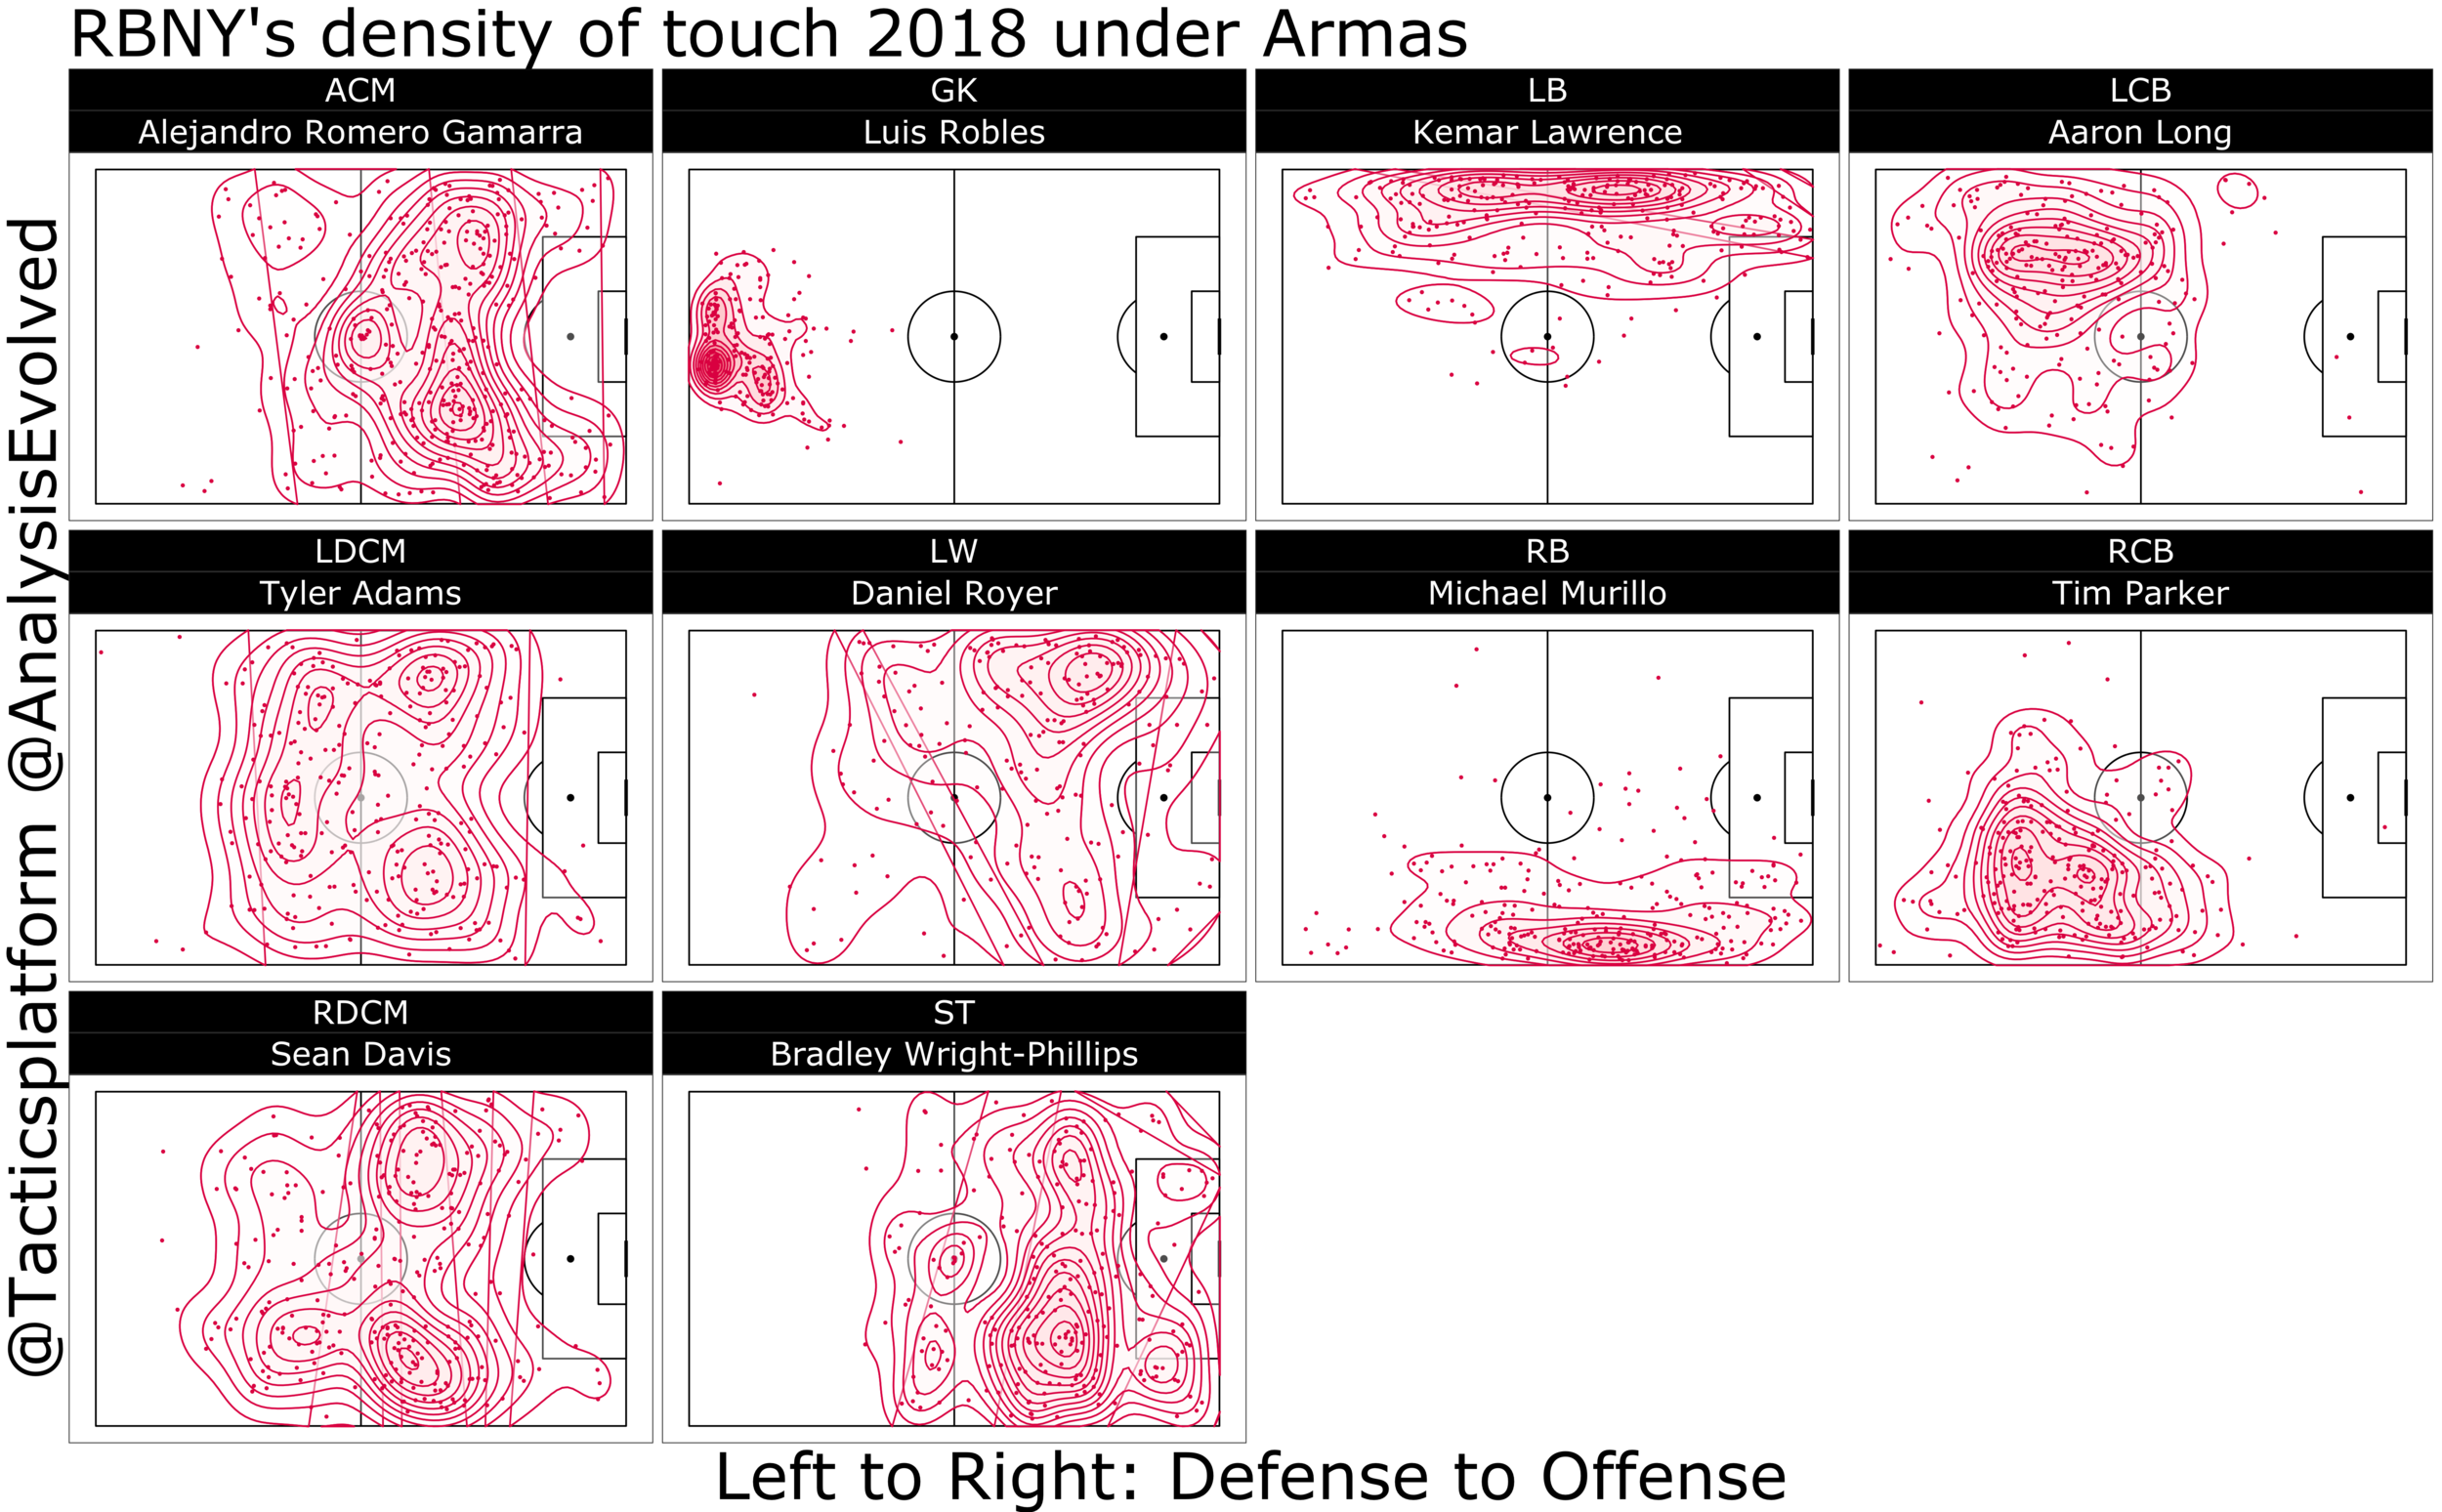
The contour density distribution of player’s touches under Armas. Only player with more than three starts at one position are shown.
We can see how Armas has instructed his players to achieve that goal; the fullbacks are not only more aggressive but also more direct under Armas. Kemar Lawrence spends most of his time in the attacking half. Michael Amir Murillo under Marsch is a primary offensive focus. He is still critical in Armas' attacking scheme, but he is doing things more directly. For example, while Murillo attempts three fewer touches per game, he averages two touches in the penalty box under Armas, a 100% increase over what he did under Marsch.
But those changes are minor compared to the transformation of Tyler Adams.
Armas has spoken in length about how talented Adams is and how much he wants the young midfielder to achieve. The data shows exactly that; Adams is one of the two players who has increased the number of touches under Armas (the other player is Bradley Wright-Phillips). He is now averaging 55 touches per game, a 41% from what he did under Marsch. He leads the team in number of touches per game. Adams is the critical piece in Armas' version of the Red Bulls.
Adams’ midfield partner Sean Davis has also changed the way he plays. Under Marsch, both midfielders played most of their touches on the right side. Since the takeover, Armas has instructed them to spend their time evenly on both sides. In particular, Adams now uses most of his extra touches on the left side. Together with Davis, they spread most of their activities in the two half-spaces past the half-line, presumably to direct Red Bulls’ offense evenly on both flanks.
Armas wants to strike a balance in the offense. We can grasp the different philosophies between him and Marsch. Murillo is probably one of the most, if not the most, skillful right backs in MLS. He can skate past defenders with his dribble and pace. Lawrence is excellent too, but he doesn't have the same skill as Murillo. Marsch gave his players freedom, and naturally, Murillo's side became the focus of Red Bulls’ attack since he dominated the touches with his dribble while Lawrence would find most of his touches behind the midfield. Armas wants to change that imbalance. He wants both of them to overlap all the way to the byline and run into the box. Let the most skillful players - Adams, Davis, and Kaku - to direct the attacks. Armas is more instrumental. He wants more discipline from his players and more structure from his team.
The fundamental change that Armas has installed is because the Red Bulls can play higher so that they can reduce the risk. How did he achieve that?
If the Red Bulls reduce the number of touches in their half during the offensive phase, they must have either increased the distance the pass travels, or the distance player travels with the ball up the field. Neither has happened team-wise: Armas' team's pass travels 23 yards on average, as compared to 25 yards under Marsch. The Red Bulls also average similar carries under the two managers (about 5 yards in both eras).
The change has come from one specific player, goalkeeper Luis Robles:

The bar chart shows the ratio of long passes and the total number of passes for each player under Marsch and Armas.
Robles attempts 20% more long ball under Armas than he did under Marsch and his pass distance has increased by 6.1 yards. The increase in pass distance from the goalkeeper is accompanied by the changes in the pass behavior from the center backs: Tim Parker and Aaron Long average 18% and 31% fewer touches under Armas. The bypass of the high-risk zones using the long ball and the decrease of touches from the two center backs can explain the forward shift of touches under Armas.
Armas also adjusts New York's defensive scheme to decrease the risks.

This heatmap shows the Red Bulls' defensive pressure under Armas and Marsch. The defensive pressure is calculated by 1 - opponent's touch (dribble, pass, shot) normalized by the league's average defensive pressure for each zone.
This heatmap shows where the Red Bulls distribute their defensive pressure. Marsch maintained more intensive pressure than his successor overall, but Armas also consolidates New York's main confrontation line outside of the opponent's box. New York's defensive pressure is now more evenly distributed in the midfield, instead of fluctuating between zones. The dive of the pressure outside of their own box explains how Armas decreases his team's risks: the more times you force the opponent to lose the ball, the more often you initiate your possession. The shift of pressure closer to the opponent's half means the Red Bulls are initiating their possession farther away from their own goal. It also suggests that the player initiating the possession from a defensive action is the midfielder instead of the center back.
But the question remains: do these changes improve the Red Bulls?

Table shows average points, xPoints (point.prob), goal differential (gd) and xG differential (xgd) for the Red Bulls at home under Marsch and Armas.

Table show average points, xPoints (point.prob), goal differential (gd) and xG differential (xgd) for the Red Bulls on the road under Marsch and Armas.
Eliot's xPoint article shows that while they did slightly better at home under Marsch, the Red Bulls have been excellent on the road under Armas. Moreover, I calculated the xG differential per game normalized by opponent's season average xG. In that case, Red Bulls’ average normalized xG differential jumps from 0.3 (1 is the maximum) under Marsch to 0.44 under Armas, an almost 50% increase. Armas’ Red Bulls are likely to perform better than Marsch's.
But all those numbers may not matter unless Armas can deliver the ultimate MLS title at the end. Things aren't fair to him, since we will never know what Marsch would have done if he had stayed. The data do tell us that Armas is on the right track. The Red Bulls fans can take comfort from the fact that they have an articulate manager that isn’t afraid to change things when he sees fit.