

2015 Final PScore: What happens when both teams high press?
/By Jared Young (@jaredeyoung)
The end of season numbers have been tabulated and there are some final observations about how MLS teams played tactically this season. In case you’re new to PScore, the goal is to describe numerically how a team plays tactically. There are two numbers that make up the score; one that assess how directly or indirectly a team passes the ball and another that measures where a team sets up their defensive line of pressure. Looking at the team offensively and defensively we can observe their tactical tendencies and ultimately determine which style of play is most effective for each team.
Here is the final chart plotting both numbers.
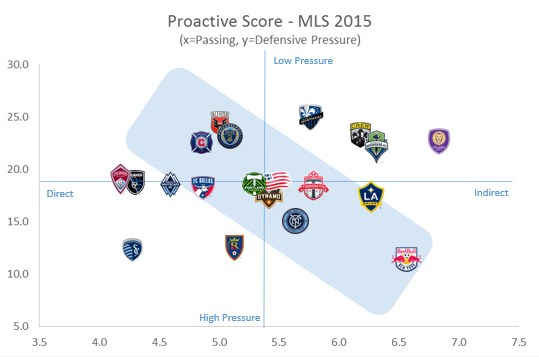
Here we can see that The New York Red Bulls were the team that played the strongest combination of high pressure defense and indirect, possession oriented passing. It’s no surprise then that they led the league in possession with 55.5% and were second in the league in shots attempted. Orlando City SC was the league’s most indirect passing team, leading that metric from wire to wire in 2015. However, unlike the Red Bulls, Orlando City sits their defense fairly deep. The Colorado Rapids were the league’s most indirect passing team, which explains their league low 74% pass completion percentage. Their passing woes can somewhat be attributed to attempting riskier passes. The team with the strongest combination of direct passing and low pressure defense was D.C. United, although it’s a close call with the Chicago Fire. D.C. United could win in a variety of ways but their tactical advantage was an extremely well anchored and deep defense. Sporting Kansas City stands alone as the team that presses high defensively but also plays directly once in possession.
For the deep dive this month I decided to look at what happens when teams employ the same defensive pressure line. For example, what does a game look like when both teams high press? How is that different from when both teams decide to sit their defense deep? I also looked at medium pressure defenses and the most common situation, where the home team plays high pressure while the away team sits their defense deep. That last situation happened in 19% of MLS games in 2015. Here is the distribution of the games to be analyzed.

The four defensive game types in this analysis make up 55% of all games played. The other games are where two teams played different defensive pressure lines other than the most common. For instance, a home team played the high press and the away team played their defense at a medium level. I removed those games just for the sake of simplicity.
First let’s look at how these different tactical styles influence shots attempted in a game.

It appears there isn’t much influence at all. The only departure is the game where the home team high presses and the away team sits low. Here the shot differential is at its greatest, which isn’t a surprise. But finishing is another story.

Here we see that two high pressing teams results in poor finishing rates for both teams. We also see that away teams have the best finishing rate advantage when they sit deep and the home team high presses. This is not a surprise. This is what we’d expect to see in a game where the away team plays bunker and counter. This is why that style of play can be effective. You can see that the goal differential is most advantageous for the away team when they play bunker and counter. Interestingly it looks like the home team should respond to that tactic by playing bunker and counter soccer themselves. It only happens 10% of the time but a home team’s expected goal differential is 0.6 goals higher.
Some of that advantage could be due to game state. Perhaps in those matches the home team took a lead and then decided to sit deep. That could skew the results. But the same thing could be said of the dual high press games. Those games could be the result of the home team going up a goal and the away team pushing higher to get the equalizer. However, the numbers don’t back up that story as the home goal differential is fairly close at 0.4. Still, adding game state to the PScore method would likely contribute to the insight of the metrics.
Let’s look at how pressure influences passing in a game.

Home and away passes are measured on the left side of the y-axis and in blue and orange. Home passes minus away passes are measured on the right side of the y-axis in white.
Here we see that game that have dueling low pressure teams have the most passes attempted. In fact 19% more passes are attempted in those games compared to when both teams high press. We’ll see why this is the case momentarily. Notice the dramatic difference in passes attempted in the home high press, away low press games. Home teams enjoy 59% of the passing possession but as we’ve already seen this is the best situation for the away team of all the tactical options we’re analyzing. This is why possession can be a meaningless statistic, because it can be completely influenced by the tactics that both teams are employing.
Let’s look at PScore through this lens.

A PScore of 1 indicates extremely direct passing while a PScore of 10 indicates indirect passing. Interestingly, the high pressure brings out the direct passing in people. To beat the pressure teams need to send more long passes up the pitch. This also takes advantage of any space left by the defense that is pushing higher. Not surprisingly, low pressure defense leads to teams indirectly passing the ball up the pitch. We’ve all seen those teams methodically take their time working the ball into the final third. Its indirect passing brought about by a team that is keeping their form and waiting to pressure only when the offensive team takes a risk going forward.

Looking at long passes (passes greater than 25 yards) by game type there are really no surprises. When both teams high press there are a much greater amount of long passes. It is interesting to see in the home high press, away low press game that the away team makes a long pass every five passes and the home team attempts one every seven.
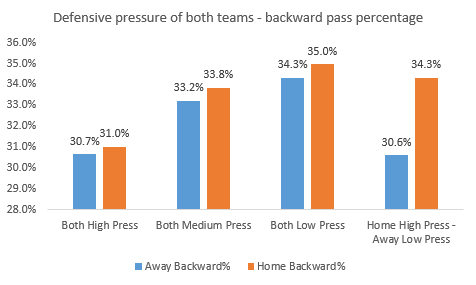
No surprises when looking at backwards passes as well. Dual high press games have the highest percentage of forward passes. You can see as teams sit their defense deeper, the offensive team sends a higher percentage of their passes backward. This is to move the ball from side to side in a hope to find space in the defense as it shifts as well as the fact that there is more space behind the offensive team for outlet passes.
2015 in summary
How much can a team dictate a tactical approach through their passing style and how much is a function of the opposing team’s defensive pressure line? Clearly we see that certain teams prefer different tactical approaches, yet we also observe that how the defense plays them has an impact on how they will respond. The PScore is just scratching the surface in revealing how different tactical approaches influence the shape of a game statistically. How many passes are attempted, the direction and length of those passes, and the percent of shots finished are all strongly influence by where defenses set up shop.