Where the Ball Was Won: Using Passing Data as an Indicator of Defensive Pressure Points

By Jamon Moore (@jmoorequakes)

I’m a die-hard San Jose Earthquakes fan. Please don’t leave yet. In case you aren’t paying attention to MLS much this year, the Quakes have been…underperforming, even by their less-than-lofty standards. I was preparing data for an article about the Quakes troubles with defending the opposition Zone 14 (or are you #TeamZone5?) discussing why they have given up a league-high six goals from there so far this season, when – as you may be aware – Matt Doyle and Bobby Warshaw publicly blasted the Quakes for the very same issue on May 27.

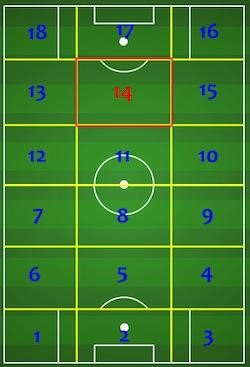
If you aren’t familiar with the 18 zones of the soccer pitch, the image to the right may help.

Zone 14 is, for the attacking team, the most dangerous spot on the pitch: a player can pass, dribble, or shoot out of it and have options in front of them -- as well as to their right and left. If you’re defending, you want to keep the ball out of your opponent’s Zone 14, where a lot of bad things can happen. San Jose had not been able to do that as of yet, but they tried something new on Saturday.

It seems the Quakes paid attention to Doyle’s comments, or maybe with the absence of Anibal Godoy and Harold Cummings, who are on their way to the World Cup, San Jose was forced into the MLS Analyst’s recommended single-CDM formation, choosing to go with a brand-new 4-4-2 narrow diamond on Saturday against the Chicago Fire.

The Fire have had their own share of troubles this season, and you could have been forgiven for skipping this Saturday night game on in favor of one of the other matchups, or maybe spending time with loved ones. Chicago didn’t do much at all in Zone 14, choosing instead to play effectively through the wings, which San Jose chose to defend 1v1 with fullbacks Nick Lima and a pressed-out-of-position Florian Jungwirth. Bastian Schweinsteiger started on the left for Chicago, but the Fire got two goals off of the right-hand side and enjoyed a 2-1 win.

Following the Doyle and Warshaw video above, I hastened my analysis and put out my article on a site dedicated to covering the Earthquakes. Prior to Saturday’s games, I tweeted out this chart about the goals and xG for each team defending the opponent Zone 14.

As a bonus for ASA readers, here is a similar graph showing which teams which give up a lot of key passes within and leaving Zone 14 with up-to-date data from Week 14.

Ouch, Minnesota United, just…ouch.

Where the Ball is Won

The San Jose-focused article itself garnered a fair amount of attention from Bay Area coaches along with Quakes fans. I had conversations with two USSF “A” licensed coaches, along with other top local coaches, about it. Both of them had similar things to say, that the Quakes’ real troubles were less about poor defending in the opponent’s Zone 14 (San Jose’s Zone 5), and more about how often they were forced to defend in this zone. The problem with San Jose is that they do not have a clear and effective strategy for winning the ball farther up the pitch.

That’s not a revolutionary statement, and soccer minds sharper than mine were already thinking it. But as I was crunching passing data to prepare for this article, I looked at where MLS teams were winning the ball. Allow too much penetration into your defending third, and Zone 14 (as well as Zone 17 in front of the goal) will be under constant assault.

ASA has published articles showing which teams are more active and reactive and examined the Red Bulls’ high press. I had suspicions this analysis will either further confirm those studies or show which teams may be making shifts.

The data I prepared was related to passing chains (sequences). Here are the total number of passing chains started by each MLS team through Week 14 -- even if the first pass was unsuccessful -- along with how many were started in the attacking half or defensive half.

Team Total Sequences Attacking Half Defensive Half
Atlanta United 1657 690 967
Chicago 1708 629 1079
Columbus 1921 719 1202
Colorado 1412 545 867
DC United 1194 439 755
FC Dallas 1541 640 901
Houston 1618 708 910
Los Angeles FC 1619 681 938
L.A. Galaxy 1745 754 991
Minnesota United 1757 680 1077
Montreal 1762 610 1152
New England 1842 832 1010
New York City FC 2004 756 1248
New York 1640 672 968
Orlando City 1747 721 1026
Philadelphia 1826 773 1053
Portland 1401 517 884
Salt Lake 1846 697 1149
Seattle 1428 558 870
San Jose 1637 582 1055
Kansas City 1988 891 1097
Toronto 1698 693 1005
Vancouver 1674 700 974

Some possessions, of course, start without an attempted pass, e.g., started by a dribble or become a shot without a pass. If we consider that each passing chain started is actually a possession gained and started, then we can use this data to indicate how far up the pitch teams generally are gaining possession.

For the most part, we see teams higher up the table in 2018 have a higher percentage of possession starting in the attacking half. This isn’t to say teams which tend to win the ball more often in their own half aren’t quality teams – Columbus, NYCFC and Portland all appear on the bottom half – but that, without a solid defensive strategy and a defined line of demarcation where engagement with urgency will win the ball back, frequently having to win the ball in your end of the field could be an indicator of a team under too much pressure.

Of course, teams will employ different strategies of pressing higher, sitting deeper, applying pressure to the first line or second line and implementing their own version of pressure-cover-balance. They may change strategy game-to-game or even within a game.

3.56.png

This data doesn’t consider situations where high pressuring teams may not be winning the ball in the attacking third or half when they face teams which opt to play the long ball under pressure. In those situations, the high pressuring team can only win the ball back in the defensive half, which, if it happens often enough, will at least somewhat affect these numbers. But if those same teams are mostly successful in applying their pressure against teams which will typically try to play out of the back, then they should be able to win more possessions higher up the pitch.

As an example, just look at defensive actions the Dynamo generated against the Quakes in April during a 2-2 away draw which Houston really dominated. As San Jose had difficulties playing out of the back in a 4-3-3 (which was disbanded before the 70th minute), Houston won the ball up the pitch frequently with their press and ended up an xG of 3.14, while San Jose had a measly 0.47.

In order to better account for teams which are choosing to apply their pressure in the middle of the pitch, I divided the data into attacking, middle and defending thirds. I ranked the resulting table by the lowest percentage started in the team’s own defending third. The output appears to be more useful overall:

Notice the Red Bulls creeping up from the middle of the pack to the fifth position. Sporting KC has the highest attacking position. The Houston Dynamo, with the highest middle percentage, and the revitalized New England Revolution top the list.

It’s difficult to imagine the Revolution’s success thus far if they were ranked lower here, soaking up pressure with their central defense. On the other hand, Columbus is a very successful defensive team on the lower end of the visualization. But it matters less where a team draws its lines of pressure than it does that they are effective in it. Generally speaking, the more effective teams in 2018 MLS through Week 14 appear to be the ones which are better at stopping the opponent from entering their defensive third. Teams such as San Jose, Montreal and Colorado have ineffective defensive pressure, as you can see on this chart, plus issues defending the opponent in Zone 14, and it shows in their spots in conference tables.

Before drawing too many conclusions, this initial analysis can and should be more deeply explored in many ways, including examining game state, red card effects and home vs. away games which could have profound impacts to how this data looks.

Here’s a quick look at an even game state slice of the previous graph:

Interestingly, Toronto, which was in the middle on the previous two charts, shows up as the strongest at starting possessions in the attacking third in even game state by over 2%, and moves up to sixth overall when combining attacking % and middle %. FC Dallas also moves up quite a bit, perhaps indicating they apply more pressure in even game states. Sporting KC moves down a few spots, while Columbus drops to the lowest spot.

These differences likely indicate that those teams which moved several spots should be examined more closely to see how they play differently in various game states. Sporting KC, for example, seems to win balls higher up the pitch when not in an even game state. Columbus is in the bottom spot, but if I’m a Columbus fan I am not worried much because their strategy overall seems to be working just fine.

One other factor to mention: in speaking with one top Bay Area coach, he mentioned that in world football, teams which implement effective pressing often see early success, but as the season wears on, those advantages become neutralized as team offensive cohesion builds. It would be interesting to revisit previous season data to see where pressuring teams end up in the final tables, to understand if this situation generally applies to MLS or not.

Conclusion

The narrative in San Jose has been building that European general manager Jesse Fioranelli came in from Italy and grossly underestimated the physicality and athleticism of MLS. He signed players such as Georgian international designated player Vako and Swiss centerback Francois Affolter last year, spent an international slot this year to bring in Joel Qwiberg of Sweden (who has been playing for the team’s USL affiliate), and drafted the undersized and slow of foot Paul Marie in the first round of the 2018 MLS SuperDraft. Maybe worst of all, Fioranelli allowed the ultra-aggressive Costa Rican defensive forward Marco Ureña (who could have been a great fit for the pressing style new Swedish head coach Mikael Stahre wanted to use at the start of the season) to depart for LAFC through the expansion draft, opting to hand the center forward role to Danny Hoesen. The Dutchman has been a prolific goal scorer so far (7 goals in 14 matches) but is not the sprinter, presser, and overall nuisance that Ureña can be at his best.

Outside of German defensive utility-man Florian Jungwirth, Fioranelli appears to have handed Stahre a team of new players who are neither quick enough nor aggressive enough to win balls up the pitch in MLS. Similar struggles seem to exist with the new international coaches in Colorado and Montreal, while American newcomer Brad Friedel has coached the Revolution into one of the turnaround stories of the season. Passing data, as an indicator of where the ball is being won, may point to some key reasons these new MLS coaches are seeing such dramatically different results.