Introducing Expected Goals 2.0 and its Byproducts

Many of the features listed below from our shot-by-shot data for 2013 and 2014 can be found above by hovering over the "Expected Goals 2.0" link. Last month, I wrote an article explaining our method for calculating Expected Goals 1.0, based only on the six shot locations. Now, we have updated our methods with the cool, new, sleek Expected Goals 2.0.

Recall that in calculating expected goals, the point is to use shot data to effectively suggest how many goals a team or player "should have scored." This gives us an idea of how typical teams and players finish, given certain types of opportunities, and then allows us to predict how they might do in the future. Using shot locations, if teams are getting a lot of shots from, say, zone 2 (the area around the penalty spot), then they should be scoring a lot of goals.

Expected Goals 2.0 for Teams

Now, in the 2.0 version, it's not only about shot location. It's also about whether or not shots are being taken with the head or the foot, and whether or not they come from corner kicks. Data from the 2013 season suggest that not only are header and corner kick shot totals predictive of themselves (stable metrics), but they also lead to lower finishing rates. Thus, teams that fare exceptionally well or poorly in these categories will now see changes in their Expected Goals metrics.

Example: In 2013, Portland took a low percentage of its total shots as headers (15.4%), as well as a low percentage of its total shots from corner kicks (12.3%). Conversely, it allowed higher percentages of those types of shots to its opponents (19.2% and 15.0%, respectively). Presumably, the Timbers' style of play encourages this behavior, and this is why the 2.0 version of Expected Goal Differential (xGD) liked the Timbers more so than the 1.0 version

We also calculate Expected Goals 2.0 contextually--specifically during times periods of an even score (even gamestate)--for your loin-tickling pleasure.

Expected Goals 2.0 for Players

Another addition from the new data we have is that we can assess players' finishing ability while controlling for the various types of shots. Players' goal totals can be compared to their Expected Goals totals in an attempt to quantify their finishing ability. Finishing is still a controversial topic, but it's this type of data that will help us to separate out good and bad finishers, if those distinctions even exist. Even if finishing is not a repeatable skill, players with consistently high Expected Goals totals may be seen as players that get themselves into dangerous positions on the pitch--perhaps a skill in its own right.

The other primary player influencing any shot is the main guy trying to stop it, the goalkeeper. This data will someday soon be used to assess goalkeepers' saving abilities, based on the types of shot taken (location, run of play, body part), how well the shot was placed in the goal mouth, and whether the keeper gave up a dangerous rebound. Thus for keepers we will have goals allowed versus expected goals allowed.

Win Expectancy

Win Expectancy is something that exists for both Major League Baseball and the National Football League, and we are now introducing it here for Major League Soccer. When the away team takes the lead in the first 15 minutes, what does that mean for their chances of winning? These are the questions that can be answered by looking at past games in which a similar scenario unfolded. We will keep Win Expectancy charts updated based on 2013 and 2014 data.

A couple thoughts on MLS Fantasy Football

I won't be so bold as to suggest what players you want on your team(s) this year, but I will offer up some interesting statistical data for your consideration. In looking at Defenders, there has been some guidance offered that talks about going with a 'team' of defenders versus some individual defenders. If you consider looking at a team of defenders, here's a look at how some teams compare to others for Bonus Points...

Defender Blocks, Interceptions and Clearances:

Oddly enough the Chicago Fire have a total score of 9.50 bonus points per game while Toronto (8.67) Real Salt Lake (8.44) and FC Dallas (8.22) follow somewhat close behind.

How I got there: I took the total defender blocks, interceptions and clearances per game (added them up) and then divided by 6 (actions per bonus point).

For the Recoveries bonus points I took the same approach and here's the top teams on recoveries after three weeks:

The Columbus Crew lead with 5.92 bonus points per game in recoveries, followed by New York at 5.06, Toronto FC at 4.92, and Seattle at 4.83 bonus points per game.

Reminder: these are team averages, not individual averages added collectively. Matty confirms that adding up a bunch of individual averages won't necessarily lead to the same as the team average.

Next up are negative points for goals against (roughly). In looking at the team defenses in that Category the best teams (that don't yield negative points) are Houston (0); with Columbus, Colorado and Toronto all yielding just -1 point.

All told the top five defending teams with respect to bonus points are:

1) Toronto (averaging 13 per game)

2) Columbus (averaging 12 per game)

3) Houston (averaging 10 per game)

4/5) Seattle and Chicago (averaging 9 per game)

What this is offering is that if you run a flat back four with just one team--say, Houston--you could have averaged 10 bonus points per game with your players.

This does not take into account all the other ways to capture points in Fantasy Football but perhaps it may help locate some cheaper defenders that will get you a better-than-average point total per game.

With the defending side of the pitch offered up for bonus points here's a look at which teams offer up more crosses than average and how successful they are in that effort.

The team that averages the most crosses per game is San Jose with 30.5. Montreal follows with 28.3 per game, while the LA Galaxy offer up 24.5 per game.

The team that averages the most successful crosses per game is also San Jose, with 10 per game hitting their target. Montreal is again second with 8.7 successful crosses per game while Sporting Kansas city leapfrogs LA with 7 successful crosses per game. Of note is that LA drops down to 5.5 successful crosses per game (sixth best).

In considering that information, perhaps a way to capture some additional bonus points for crossing would be to pick out at least one midfielder/forward for San Jose and perhaps one from Montreal or Kansas City.

All told, that may give you better chances of getting points week-to-week with somewhat less money invested than just buying the stars. 

All the best, Chris

How it Happened: Week Three

In the three games I watched this week, five goals were scored. Two were from penalty kicks, and two were off corner kicks. Needless to say, offenses around the league are in early-season form, i.e. not exactly clicking in front of the net. On the bright side, there was a decent amount of combination play leading to chances....it's just that whole putting them away thing that MLS teams are still working on. Onto the main attraction: Chicago Fire 1 - 1 New York Red Bulls

Stat that told the story for New York: 350 completed passes; 68% of which were on the left side of the field*

nyrb3

It's hardly inspiring for the Supporters' Shield holders to sneak away from Chicago with a draw, but I actually thought they played pretty well on Sunday. Like I said above about the league as a whole, quality was missing on the final ball/shot, but New York fans shouldn't be too worried about the team's winless start. In this one there was quite a bit of good linking-up, particularly on the left flank. Given that midfielder Matt Watson was starting in a pinch as a nominal right back for the Fire, it seemed like a concerted effort from RBNY to expose a weakness on that side of the field. Between Roy Miller, Jonny Steele and Thierry Henry, there were some encouraging sequences down that side in particular; unfortunately for New York it didn't lead to any actual goals.

*This stat/image is blatantly stolen from the Twitter account of MLS Fantasy Insider Ben Jata, @Ben_Jata. After seeing it this weekend, I was unable to think of anything better to include, so thanks, Ben!

Stat that told the story for Chicago: 24 total shots + key passes, only 2 of which were from Mike Magee

I'm not sure if this one is a good stat for Chicago fans or a bad one, but Mike Magee was conspicuously absent from a lot of the action this weekend (unless you count yelling incessantly and childishly at the ref as your definition of 'action'). But seriously: last year Chicago had 377 shots the entire season, and Magee either took or assisted on 116 of them (31%)*. Oh, and he only played 22 of their 34 games. The fact that he was involved in only 2 of the team's 24 shots (both of his shots were blocked, for what it's worth) could certainly be viewed as concerning for Chicago fans expecting another MVP-caliber season out of Magee. But on the other hand, it's easy to chalk up the struggles to the fact that this was his first game of the season after a maybe-contract-hold-out related hiatus. Also, the fact that Chicago managed to create 22 shots without Magee's direct influence (or Patrick Nyarko and Dilly Duka, both also out this weekend) has to be a good sign for a team that was often a one-man show last season: youngsters Harrison Shipp and Benji Joya in particular both seem capable of lightening the load.

*Numbers from Squawka.


Toronto FC 1 - 0 DC United

Stat that told the story for Toronto: 38% possession, 3 points won

tfc3

TFC captain Michael Bradley made headlines this week saying something along the lines of how possession was an overrated stat, and his team certainly appears to be trying to prove his point so far this season. The Reds didn't see a ton of the ball in their home opener, instead preferring to let DC knock the ball around with minimal penetration in the final third. And then when Toronto did win the ball, well, check out the Opta image that led to the game's lone goal for Jermain Defoe (or watch the video). It started with a hopeful ball from keeper Julio Cesar. The second ball was recovered by Steven Caldwell, who fed Jonathan Osorio. Osorio found his midfield partner Bradley, who lofted a brilliant 7-iron to fellow DP Gilberto. The Brazilian's shot was saved but stabbed home by the sequence's final Designated Player, Defoe. Balls like that one were played multiple times throughout the game by both Bradley and Osorio, as TFC has shown no aversion to going vertical quickly upon winning the ball. And with passes like that, speedy wingers, and quality strikers, it's certainly a strategy that may continue to pay off.

Stat that told the story for DC: 1/21 completed crosses

This stat goes along a bit with what I wrote about Toronto above: they made themselves hard to penetrate in the final third, leading to plenty of incomplete crosses. Some of this high number of aimless crosses also comes from the fact that DC was chasing an equalizer and just lumping balls into the box late in the match. Still, less than 5% on completing crosses is a bit of a red flag when you look at the stat sheet. Particularly when your biggest attacking threat is Eddie Johnson, who tends to be at his best when attacking balls in the air. You'd think Ben Olsen would expect a better crossing percentage. To be fair to United though, I thought they were much better in this game than they were on opening day against Columbus. They looked about 4 times more organized than two weeks ago, and about 786 times more organized than last season, and their possession and link-up play showed signs of improvement too. Still a ways to go, but at least things are trending upward for the Black and Red.


Colorado Rapids 2 - 0 Portland Timbers

Stat that told the story for Portland: 1 Donovan Ricketts karate kick

por3

I admit that I'm cheating here and not using a stat or an Opta Chalkboard image. But the above grainy screenshot of my TV that I took is too hilarious and impactful not to include. Colorado and Portland played a game on Saturday that some might call turgid, or testy, or any number of adjectives that are really stand-ins for the word boring. The most interesting parts of most of the game were Ricketts' adventures in goal, which ranged from dropping floated long balls to tipping shots straight in the air to himself. In the 71st minute it appeared Ricketts had had enough and essentially dropped the mic. Flying out of his net, he leapt into the air with both feet, apparently hoping that if he looked crazy enough the ref would look away in horror instead of red carding him for the obvious kick to Deshorn Brown's chest. The Rapids converted the penalty and then added another one a few minutes later, and that was all she wrote.

Stat that told the story for Colorado: 59 total interceptions/recoveries/tackles won; 27 in the game's first 30 minutes

Alright, I was silly with the Portland section so I feel like I need to do a little serious analysis for this paragraph. The truth is that this game was fairly sloppy on both sides, which is particularly surprising considering how technically proficient Portland was for most of last season. But cold weather combined with early season chemistry issues makes teams play sloppily sometimes, and it didn't help that Colorado came out and looked very good to start this game. Their defensive shape was very compact when the Timbers had the ball, and the Rapids were very proficient in closing down passing lanes and taking possession back. The momentum swung back to Portland's side and back a couple of times throughout the match, but Colorado's strong start set the tone that Donovan Ricketts helped carry to the final whistle.


Agree with my assessments? Think I'm an idiot? I always enjoy feedback. Contact me on twitter @MLSAtheist or by email at MLSAtheist@gmail.com

MLS Week 3: Expected Goals and Attacking Passes

In the coming days, Matthias will be releasing our Expected Goals 2.0 statistics for 2014. You can find the 2013 version already uploaded here. I would imagine that basically everything I've been tweeting out from our @AnalysisEvolved twitter handle about expected goals up to this point will be certainly less cool, but he informs me it won't be entirely obsolete. He'll explain when he presents it, but the concept behind the new metrics are familiar, and there is a reason why I use xGF to describe how teams performed in their attempt to win a game. It's important to understand that there is a difference between actual results and expected goals, as one yields the game points and the other indicates possible future performances. However, this post isn't about expected goal differential anyway--it's about expected goals for. Offense. This obviously omits what the team did defensively (and that's why xGD is so ideal in quantifying a team performance), but I'm not all about the team right now. These posts are about clubs' ability to create goals through the quality of their shots. It's a different method of measurement than that of PWP, and really it's a measuring something completely different.

Take for instance the game which featured Columbus beating Philadelphia on a couple of goals from Bernardo Anor, who aside from those goals turned in a great game overall and was named Chris Gluck's attacking player of the week. That said, know that the goals that Anor scored are not goals that can be consistently counted upon in the future. That's not to diminish the quality or the fact that they happened. It took talent to make both happen. They're events---a wide open header off a corner and a screamer from over 25 yards out---that I wouldn't expect him to replicate week in and week out.

Obviously Columbus got some shots and in good locations which they capitalized on, but looking at the xGF metric tells us that while they scored two goals and won the match, the average shot taker would have produced just a little more than one expected goal. Their opponents took a cumulative eleven shots inside the 18 yard box, which we consider to be a dangerous location. Those shots, plus the six from long range, add up to nearly two goals worth of xGF. What this can tell us is two pretty basic things 1) Columbus scored a lucky goal somewhere (maybe the 25 yard screamer?) and then 2) They allowed a lot of shots in inopportune locations and were probably lucky to come out with the full 3 points.

Again, if you are a Columbus Crew fan and you think I'm criticizing your team's play, I'm not doing that. I'm merely looking at how many shots they produced versus how many goals they scored and telling you what would probably happen the majority of the time with those specific rates.


 Team shot1 shot2 shot3 shot4 shot5 shot6 Shot-total xGF
Chicago 1 3 3 3 3 0 13 1.283
Chivas 0 3 2 2 3 0 10 0.848
Colorado 1 4 4 2 1 1 13 1.467
Columbus 0 5 1 2 1 0 9 1.085
DC 0 0 1 1 4 0 6 0.216
FC Dallas 0 6 2 0 1 1 10 1.368
LAG 0 0 4 2 3 0 9 0.459
Montreal 2 4 5 8 7 0 26 2.27
New England 1 2 1 8 5 0 17 1.275
New York 2 4 2 0 2 0 10 1.518
Philadelphia 2 5 6 2 4 0 19 2.131
Portland 0 0 2 2 2 1 7 0.329
RSL 0 4 3 0 3 0 10 0.99
San Jose 0 2 0 0 3 0 5 0.423
Seattle 1 4 0 2 2 0 9 1.171
Sporting 2 6 2 2 3 2 17 2.071
Toronto 0 6 4 2 2 0 14 1.498
Vancouver 0 1 1 3 3 0 8 0.476
 Team shot1 shot2 shot3 shot4 shot5 shot6 Shot-total xGF

Now we've talked about this before, and one thing that xGF, or xGD for that matter, doesn't take into account is Game States---when the shot was taken and what the score was. This is something that we want to adjust for in future versions, as that sort of thing has a huge impact on the team strategy and the value of each shot taken and allowed. Looking around at other instances of games like that of Columbus, Seattle scored an early goal in their match against Montreal, and as mentioned, it changed their tactics. Yet despite that, and the fact that the Sounders only had 52 total touches in the attacking third, they were still able to average a shot per every 5.8 touches in the attacking third over the course of the match.

It could imply a few different things. Such as it tells me that Seattle took advantage of their opportunities in taking shots and even with allowing of so many shots they turned those into opportunities for themselves. They probably weren't as over matched it might seem just because the advantage that Montreal had in shots (26) and final third touches (114). Going back to Columbus, it seems Philadelphia was similar to Montreal in the fact that both clubs had a good amount of touches, but it seems like the real difference in the matches is that Seattle responded with a good ratio of touches to shots (5.77), and Columbus did not (9.33).

These numbers don't contradict PWP. Columbus did a lot of things right, looked extremely good, and dare I say they make me look rather brilliant for picking them at the start of the season as a possible playoff contender. That said their shot numbers are underwhelming and if they want to score more goals they are going to need to grow a set and take some shots.

 Team att passes C att passes I att passes Total Shot perAT Att% KP
Chicago 26 17 43 3.308 60.47% 7
Chivas 32 29 61 6.100 52.46% 2
Colorado 58 27 85 6.538 68.24% 7
Columbus 53 31 84 9.333 63.10% 5
DC 61 45 106 17.667 57.55% 3
FC Dallas 34 26 60 6.000 56.67% 2
LAG 43 23 66 7.333 65.15% 6
Montreal 63 51 114 4.385 55.26% 11
New England 41 29 70 4.118 58.57% 7
New York 57 41 98 9.800 58.16% 6
Philadelphia 56 29 85 4.474 65.88% 10
Portland 10 9 19 2.714 52.63% 3
RSL 54 32 86 8.600 62.79% 3
San Jose 37 20 57 11.400 64.91% 3
Seattle 33 19 52 5.778 63.46% 5
Sporting 47 29 76 4.471 61.84% 7
Toronto 30 24 54 3.857 55.56% 6
Vancouver 21 20 41 5.125 51.22% 2
 Team att passes C att passes I att passes Total ShotpT Att% KP

There is a lot more to comment on than just Columbus/Philadelphia and Montreal/Seattle (Hi Portland and your 19 touches in the final third!). But these are the games that stood out to me as being analytically awkward when it comes to the numbers that we produce with xGF, and I thought they were good examples of how we're trying to better quantify the the game. It's not that we do it perfect---and the metric is far from perfect---instead it's about trying to get better and move forward with this type of analysis, opposed to just using some dried up cliché to describe a defense, like "that defense is made of warriors with steel plated testicles" or some other garbage.

This is NUUUUUuuuuummmmmbbbbbbeeerrrs. Numbers!

MLS PWP: Team Performance Index through Week 3

I hope all are enjoying my PWP series here at American Soccer Analysis. With Week 3 completed, I have at least two games worth of data for every team in MLS, and now it's time to begin offering up the cumulative PWP Strategic Index and all that goes with it. Wasting no time, here's the initial diagram on how things look after at least two games:

Observations:

Given what happened the first few weeks, it should be no surprise that Columbus lead the pack early on with Houston second, and (like last year) a strong early start for FC Dallas.

What may be surprising to some is where Toronto falls in this Index; it should be noted that in both games played this year, Toronto have had just 32.46% possession (Seattle) and 37.68% possession (D.C. United).

What this indicator helps point out is how different Toronto is playing compared to others while still taking points - in both cases Toronto have opted to sit back and cede possession in order to capitalize on opponents losing their shape. How well that continues to work for them remains to be seen, but for now Bradley has been absolutely correct in his analysis/offering to MLS: you don't need to have a majority of possession to win a game.

As for the bottom dweller, note the familiar spot for D.C. United. It would seem those off-season transactions have yet to bear fruit, and it might not be t0o long before coach Ben Olsen sees the door if United don't start turning things around.

How about some of the other teams in the middle? Well New York and Portland have both opened up exactly like they did last year with two points in three games. What may be most troubling for both is a lack of scoring. We'll see how that unfolds, as it is likely that Thierry Henry and Tim Cahill will score sooner rather than later.

With respect to LA Galaxy, I watched their game this weekend against Real Salt Lake, and it appeared to me that it was all about Robbie Keane and his single-handed goal (with Donovan lurking) versus a solid Real Salt Lake team effort. If Joao Plata doesn't go off injured in that game, I'd have been a betting man that RSL would have taken three points from LA.

Other lurkers here are Seattle, Colorado and Vancouver. Recall last year that the defense of Vancouver kept them from the Playoffs (45 goals against). This year things are starting a wee bit different, as they had a great defensive battle with New England this past weekend.

All those thoughts being said here's how the teams stack up in the PWP Strategic Attacking Index:

Observations:

Columbus Crew, FC Dallas and Houston are the new guys on the block this year--as compared to last year--with RSL, LA Galaxy, Seattle, Colorado, New York and Vancouver returnees to the top spots.

Missing from the potent attack side so far this year (foremost) are Sporting Kansas City and Portland. One may recall that Chivas USA had a good start last year, but then the Goats seemed to wander off and join D.C. United as the season wore on.

Of note is where Toronto sits. In playing a counterattacking style, parts of their PWP will naturally fall lower down the list than other more possession-based teams. It will be fun to track how they progress in PWP this year.

For the defensive side of PWP here's how things stand today:

Observations:

With Columbus doing so well in attack it's no surprise that their opponents aren't... so here's where the real grist begins when peeling back defending activities.

Note that Houston, Seattle, Colorado, and Sporting Kansas City are in the top five, while FC Dallas, high up in attack, isn't quite so high in defending. Will that gap create issues again this year? Pareja was noted as having a pretty tight defense in Colorado. Will there be personnel changes in Dallas?

Oddly enough, a top defender in my view for Portland was David Horst. I'm still not sure why he was moved to Houston, but given their early season success, his big presence in the back has certainly improved that team. Can David remain healthy? Hard to say, but continued presence by the big guy should garner some interest, I hope, in some USMNT training after the World Cup is completed this year. It's never too early to plan for the future.

As for the bottom dwellers, note again that Chivas USA are the bottemost. They may have improved their attack this off-season, but if they can't stop the goals against, that attack will mean nothing when it comes to Playoff crunch time.

In closing...

It remains early, and I've every belief that this table will adjust itself a bit more as time passes and points are won and lost. The intent is not necessarily to match the League Tables, but to offer up a different perspective on teams' abilities that are reasonable when viewing team performance.

Check out my PWP Week 3 Analysis, as well as my New York Red Bulls-centric PWP weekly analysis for New York Sports Hub. If time permits please join me on twitter as I offer up thoughts during nationally-televised matches this year.

All the best, Chris

MLS Possession with Purpose Week 3: The best (and worst) performances

Here's my weekly analysis for your consideration as Week 3 ended Sunday evening with a 2-nil Seattle victory over Montreal. To begin, for those new to this weekly analysis, here's a link to PWP. It includes an introduction and some explanations; if you are familiar with my offerings then let's get stuck in.

First up is how all the teams compare to each other for Week 3:

Observations:

Note that Columbus remains atop the League while those who performed really well last year (like Portland) are hovering near the twilight zone. A couple of PKs awarded to the opponent and some pretty shoddy positional play defensively have a way of impacting team performance.

Note also that Toronto are mid-table here but not mid-table in the Eastern Conference standings; I'll talk more about that in my Possession with Purpose Cumulative Blog later this week.

Also note that Sporting Kansas City are second in the queue for this week; you'll see why a bit later.

A caution however - this is just a snapshot of Week 3; so Houston didn't make the list this week but will surface again in my Cumulative Index later.

The bottom dweller was not DC United this week; that honor goes to Philadelphia. Why? Well, because like the previous week, their opponent (Columbus) is top of the heap.

So how about who was top of the table in my PWP Strategic Attacking Index? Here's the answer for Week 3:

As noted, Columbus was top of the Week 3 table again this week, with FC Dallas and their 3-1 win against Chivas coming second, and Keane and company for LA coming third.

With Columbus taking high honors, and all the press covering Bernardo Anor, it is no surprise he took top honors in the PWP Attacking Player of the Week. But he didn't take top honors just for his two wicked goals, and the diagram below picks out many of his superb team efforts as Columbus defeated Philadelphia 2-1.

One thing to remember about Bernardo; he's a midfielder and his game isn't all about scoring goals. Recoveries and overall passing accuracy play a huge role in his value to Columbus, and with 77 touches he was leveraged quite frequently in both the team's attack and defense this past weekend.

Anyhoo... the Top PWP Defending Team of the Week was Sporting Kansas City. This is a role very familiar to Sporting KC, as they were the top team in defending for all of MLS in 2013. You may remember that they also won the MLS Championship, showing that a strong defense is one possible route to a trophy.

Here's the overall PWP Strategic Defending Index for your consideration:

While not surprising for some, both New England and Vancouver finished 2nd and 3rd respectively; a nil-nil draw usually means both defenses performed pretty well.

So who garnered the PWP Defending Player of the Week?  Most would consider Aurelien Collin a likely candidate, but instead I went with Ike Opara, as he got the nod to start for Matt Besler.  Here's why:

Although he recorded just two defensive actions inside the 18-yard box compared to five for Collin, Opara was instrumental on both sides of the pitch in place of Besler. All told, as a Center-back, his defensive activities in marshaling the left side were superb as noted in the linked MLS chalkboard diagram here. A big difference came in attack where Opara had five shots attempts with three on target.

In closing...

My thanks again to OPTA and MLS for their MLS Chalkboard; without which this analysis could not be offered.

You can follow me on twitter @chrisgluckpwp, and also, when published you can read my focus articles on the New York Red Bulls PWP this year at the New York Sports Hub. My first one should be published later this week.

All the best, Chris

In Defense of the San Jose Earthquakes and American Soccer

Note: This is part II of the post using a finishing rate model and the binomial distribution to analyze game outcomes. Here is part I. As if American soccer fans weren’t beaten down enough with the removal of 3 MLS clubs from the CONCACAF Champions League, Toluca coach Jose Cardozo questioned the growth of American soccer and criticized the strategy the San Jose Earthquake employed during Toluca’s penalty-kick win last Wednesday. Mark Watson’s team clearly packed it in defensively and looked to play “1,000 long balls” on the counterattack. It certainly doesn’t make for beautiful fluid soccer but was it a smart strategy? Are the Earthquakes really worthy of the criticism?

Perhaps it’s fitting that Toluca is almost 10,000 feet above sea level because at that level the strategy did look like a disaster. Toluca controlled the ball for 71.8% of the match and ripped off 36 shots to the Earthquakes' 10. It does appear that San Jose was indeed lucky to be sitting 1-1 at the end of match. The fact that Toluca only scored one lone goal in those 36 shots must have been either unlucky or great defense, right? Or could it possibly have been expected?

The prior post examined using the binomial distribution to predict goals scored, and again one of the takeaways was that the finishing rates and expected goals scored in a match decline as shots increase, as seen below. This is a function of "defensive density," I’ll call it, or basically how many players a team is committing to defense. When more players are committed to defending, the offense has the ball more and ultimately takes more shots. But due to the defensive intensity, the offense is less likely to score on each shot.

 source: AmericanSoccerAnalysis

Mapping that curve to an expected goals chart you can see that the Earthquakes expected goals are not that different from Toluca’s despite the extreme shot differential.

source data: AmericanSoccerAnalysis

Given this shot distribution, let’s apply the binomial distribution model to determine what the probability was of San Jose advancing to the semifinals of the Champions League. I’m going to use the actual shots and the expected finishing rate to model the outcomes. The actual shots taken can be controlled through Mark Watson’s strategy, but it's best to use expected finishing rates to simulate what outcomes the Earthquakes were striving for. Going into the match the Earthquake needed a 1-1 draw to force a shootout. Any better result would have seen them advancing and anything worse would have seen them eliminated.

Inputs:

Toluca Shots: 36

Toluca Expected Finishing Rate: 3.6%

San Jose Shots: 10

San Jose Expected Finishing Rate: 11.2%

Outcomes:

Toluca Win: 39.6%

Toluca 0-0 Draw: 8.3%

Toluca 1-1 Draw: 13.9% x 50% PK Toluca = 6.9%

Total Probability Toluca advances= 54.9%


San Jose Win: 32.3%

2-2 or higher Draw = 5.8%

San Jose 1-1 Draw: 13.9% x 50% PK San Jose = 6.9%

Total Probability San Jose Advances = 45.1%


The odds of San Jose advancing with that strategy are clearly not as bad as the 10,000-foot level might indicate. Counterattacking soccer certainly isn’t pretty, but it wouldn’t still exist if it weren’t considered a solid strategy.

It’s difficult, but we can also try to simulate what a “normal” possession-based strategy might have looked like in Toluca. In MLS the average possession for the home team this year is 52.5% netting 15.1 shots per game. In Liga MX play, Toluca is only averaging about 11.4 shots per game so they are not a prolific shooting team. They are finishing at an excellent 15.2%, which could be the reason San Jose attempted to pack it in defensively. The away team in MLS is averaging 10.4 shots per game. If we assume that a more possession oriented strategy would have resulted in a typical MLS game then we have the following expected goals outcomes.

source data: AmericanSoccerAnalysis

Notice the expected goal differential is actually worse for San Jose by .05 goals. Though it may not be statistically significant, at the very least we can say that San Jose's strategy was not ridiculous.

Re-running the expected outcomes with the above scenario reveals that San Jose advances 43.3% of the time. A 1.8% increase in the probability of advancing did not deserve any criticism, and definitely not such harsh criticism. It shows that the Earthquakes probably weren’t wrong in their approach to the match. And if we had factored in a higher finishing rate for Toluca, the probabilities would favor the counterattack strategy even more.

Even though the US struck out again in the CONCACAF Champions League, American's don't need to take abuse for their style of play. After all, soccer is about winning, and in the case of a tie, advancing. We shouldn't be ashamed or be criticized when we do whatever it takes to move on.


Predicting Goals Scored using the Binomial Distribution

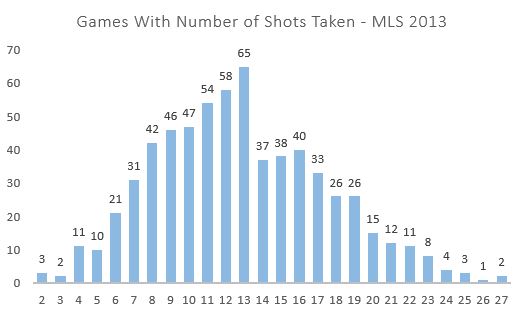
Much is made of the use of the Poisson distribution to predict game outcomes in soccer. Much less attention is paid to the use of the binomial distribution. The reason is a matter of convenience. To predict goals using a Poisson distribution, “all” that is needed is the expected goals scored (lambda). To use the binomial distribution, you would need to both know the number of shots taken (n) and the rate at which those shots are turned into goals (p). But if you have sufficient data, it may be a better way to analyze certain tactical decisions in a match. First, let’s examine if the binomial distribution is actually dependable as a model framework. Here is the chart that shows how frequently a certain number of shots were taken in a MLS match.

source data: AmericanSoccerAnalysis

The chart resembles a binomial distribution with right skew with the exception of the big bite taken out of the chart starting with 14 shots. How many shots are taken in a game is a function of many things, not the least of which are tactical decisions made by the club. For example it would be difficult to take 27 shots unless the opposing team were sitting back and defending and not looking to possess the ball. Deliberate counterattacking strategies may very well result in few shots taken but the strategy is supposed to provide chances in a more open field.

Out of curiosity let’s look at the average shot location by shots taken to see if there are any clues about the influence of tactics. To estimate this I looked expected goals by each shot total. This does not have any direct influence on the binomial analysis but could come in useful when we look for applications.

source: AmericanSoccerAnalysis

The average MLS finishing rate was just over 10 percent in 2013. You can see that, at more than 10 shots per game, the expected finishing rate stays constant right at that 10-percent rate. This indicates that above 10 shots, the location distribution of those shots is typical of MLS games. However, at fewer than 10 shots you can see that the expected goal scoring rate dips consistently below 10%. This indicates that teams that take fewer shots in a game also take those shots from worse locations on average.

The next element in the binomial distribution is the actual finishing rate by number of shots taken.

 source: AmericanSoccerAnalysis

Here it’s plain that the number of shots taken has a dramatic impact on the accuracy rate of each shot. This speaks to the tactics and pace of play involved in taking different shot amounts. A team able to squeeze off more than 20 shots is likely facing a packed box and a defense less interested in ball possession. What’s fascinating then is that teams that take few shots in a game have a significantly higher rate of success despite the fact that they are taking shots from farther out. This indicates that those teams are taking shots with significantly less pressure. This could indicate shots taken during a counterattack where the field of play is more wide open.

Combining the finishing accuracy model curve with number of shots we can project expected goals per game based on number of shots taken.

ExpGoalsbyShotsTaken

What’s interesting here is that the expected number of goals scored plateaus at about 18 shots and begins to decline after 23 shots. This, of course, must be a function of the intensity of the defense they are facing for those shots because we know their shot location is not significantly different. This model is the basis by which I will simulate tactical decisions throughout a game in Part II of this post.

Now we have the two key pieces to see if the binomial distribution is a good predictor of goals scored using total shots taken and finishing rate by number of shots taken. As a refresher, since most of us haven’t taken a stat class in a while, the probability mass function of the binomial distribution looks like the following:

source: wikipedia

Where:

n is the number of shots

p is the probability of success in each shot

k is the number of successful shots

Below I compare the actual distribution to the binomial distribution using 13 shots (since 13 is the mode number of shots from 2013’s data set), assuming a 10.05% finishing rate.

source data: AmericanSoccerAnalysis, Finishing Rate model

The binomial distribution under predicts scoring 2 goals and over predicts all other options. Overall the expected goals are close (1.369 actual to 1.362 binomial). The Poisson is similar to the binomial but the average error of the binomial is 12% better than the Poisson.

If we take the average of these distributions between 8 and 13 shots (where the sample size is greater than 40) the bumps smooth out.

source data: AmericanSoccerAnalysis, Finishing Rate model

The binomial distribution seems to do well to project the actual number of goals scored in a game, and the average binomial error is 23% lower than with the Poisson. When individually looking at shots taken 7 to 16 the binomial has 19% lower error if we just observe goal outcomes 0 and 1. But so what? Isn’t it near impossible to predict the number of shots a team will take in the game? It is. But there may be tactical decisions like counterattacking where we can look at shots taken and determine if the strategy was correct or not. And a model where the final stage of estimation is governed by the binomial distribution appears to be a compelling model for that analysis. In part II I will explore some possible applications of the model.

Jared Young writes for Brotherly Game, SB Nation's Philadelphia Union blog. This is his first post for American Soccer Analysis, and we're excited to have him!

MLS Prediction Contest - We Have a Winner!

After two weeks of Major League Soccer wins, losses, and, this week, mostly draws, the best predictors were... [googleapps domain="docs" dir="spreadsheet/pub" query="key=0At6qSdpic03PdE4zOE12WWNlSm0zeVBnaXd6SnpDQ0E&output=html&widget=true" width="500" height="300" /]

MLSAtheist and timbertyler tied for first place with 13 correct answers each (out of 20). Normally, we would have gone to the tiebreaker to determine the grand prize winner, but MLSAtheist, a valued contributor to American Soccer Analysis, graciously decided to withdraw his prize eligibility. That leaves timbertyler as the winner of a subscription to MLS Live 2013!

Congratulations to timbertyler; maybe Portland will follow his lead and start amassing some wins of their own.

ASA Fantasy League Update Round 2: A Terrible Case of the Nagbe's

This is your weekly reminder that you're doing MLS fantasy, and if you're taking part in our league you should probably set your rosters so you have an opportunity to win something TBD. And really, since you're probably not doing any work with the NCAA tournament going on, you have some time to make sure your lineup is good to go this week. If you aren't in our league yet, and for some reason you feel the strong need to join, you can do so by figuring out how to use this code: 9593-1668. We grade on a pass/fail scale. If you get in you passed. Here is the current week's worth of data. It's in a jpeg format because, frankly, tables show up for crap on our site and we'll be moving soon enough to this other site that... well, we'll tell you more when we're at that stage.

week2MLSFANTASYHere are the main take aways for this week.

- Stop making Darlington Nagbe your Captain.

- Will Bruin continues to make me look stupid.

- I'm average, and if you are below me, you are not doing yourself any favors.

- I'm ahead of both Matthias and Drew, so while I'm the idiot of the podcast I've so far shown to be the better fantasy player.

- I totally lucked out with Zack MacMath this week.

Now the below image is for the week 2 "dream team" which is basically how you could have gotten the most points last week. Interesting that no one from our league sported a 3-5-2 formation this week and that three main formations were kind of cycled through for everyone.

DreamTeam-week2

Good luck to you all, and we'll see if we can ever catch up to either Bazzo, Cris Pannullo or Chris Gluck. They look poised to possibly run away with this thing. Hopefully this week will set them back so the rest of us can feel better about ourselves.