

Gotta Catch Em All: MLS Teams as Pokemon
/
By Paul Harvey
Ask anybody around my age (now pretty old!) to describe their first experience playing Pokemon Red or Blue, and they can likely do so in surprisingly accurate detail. From Professor Oak being unsure of your gender, to the feeling when you first venture into the grass to wrangle a Rattata, those first moments of stepping into a much bigger world are seared onto our consciousnesses even decades past the game’s release.
What made Pokemon a global phenomenon was more than just the gameplay, which had been done many times before in various formats. The core of the experience was the Pokemon themselves, as unique, diverse, and fascinating as any creatures in our own world. Each one came with not just its own look but an entire personality as well, enhanced by other media such as the TV show or movies. Although there are now 898 distinct species of Pokemon, the original 151 hold an outsized presence in the nostalgic psyche of the generation that grew up with the game.
The distinct personalities also fused neatly with the underlying numbers that ran the game, and because of this we can use a mathematical process to match MLS teams to Pokemon in ways that reflect not just what a team does on the field, but their entire personalities. The comparison hijacks the common understanding of what a Pokemon is or does and in doing so creates an inherent understanding of how a team plays soccer in a way that just a bunch of numbers or even a really clever visualization can’t do.
Methodology
If you want to read an in depth explanation on how it all works, keep reading. If you want to skip to more vizzes, skip this section.
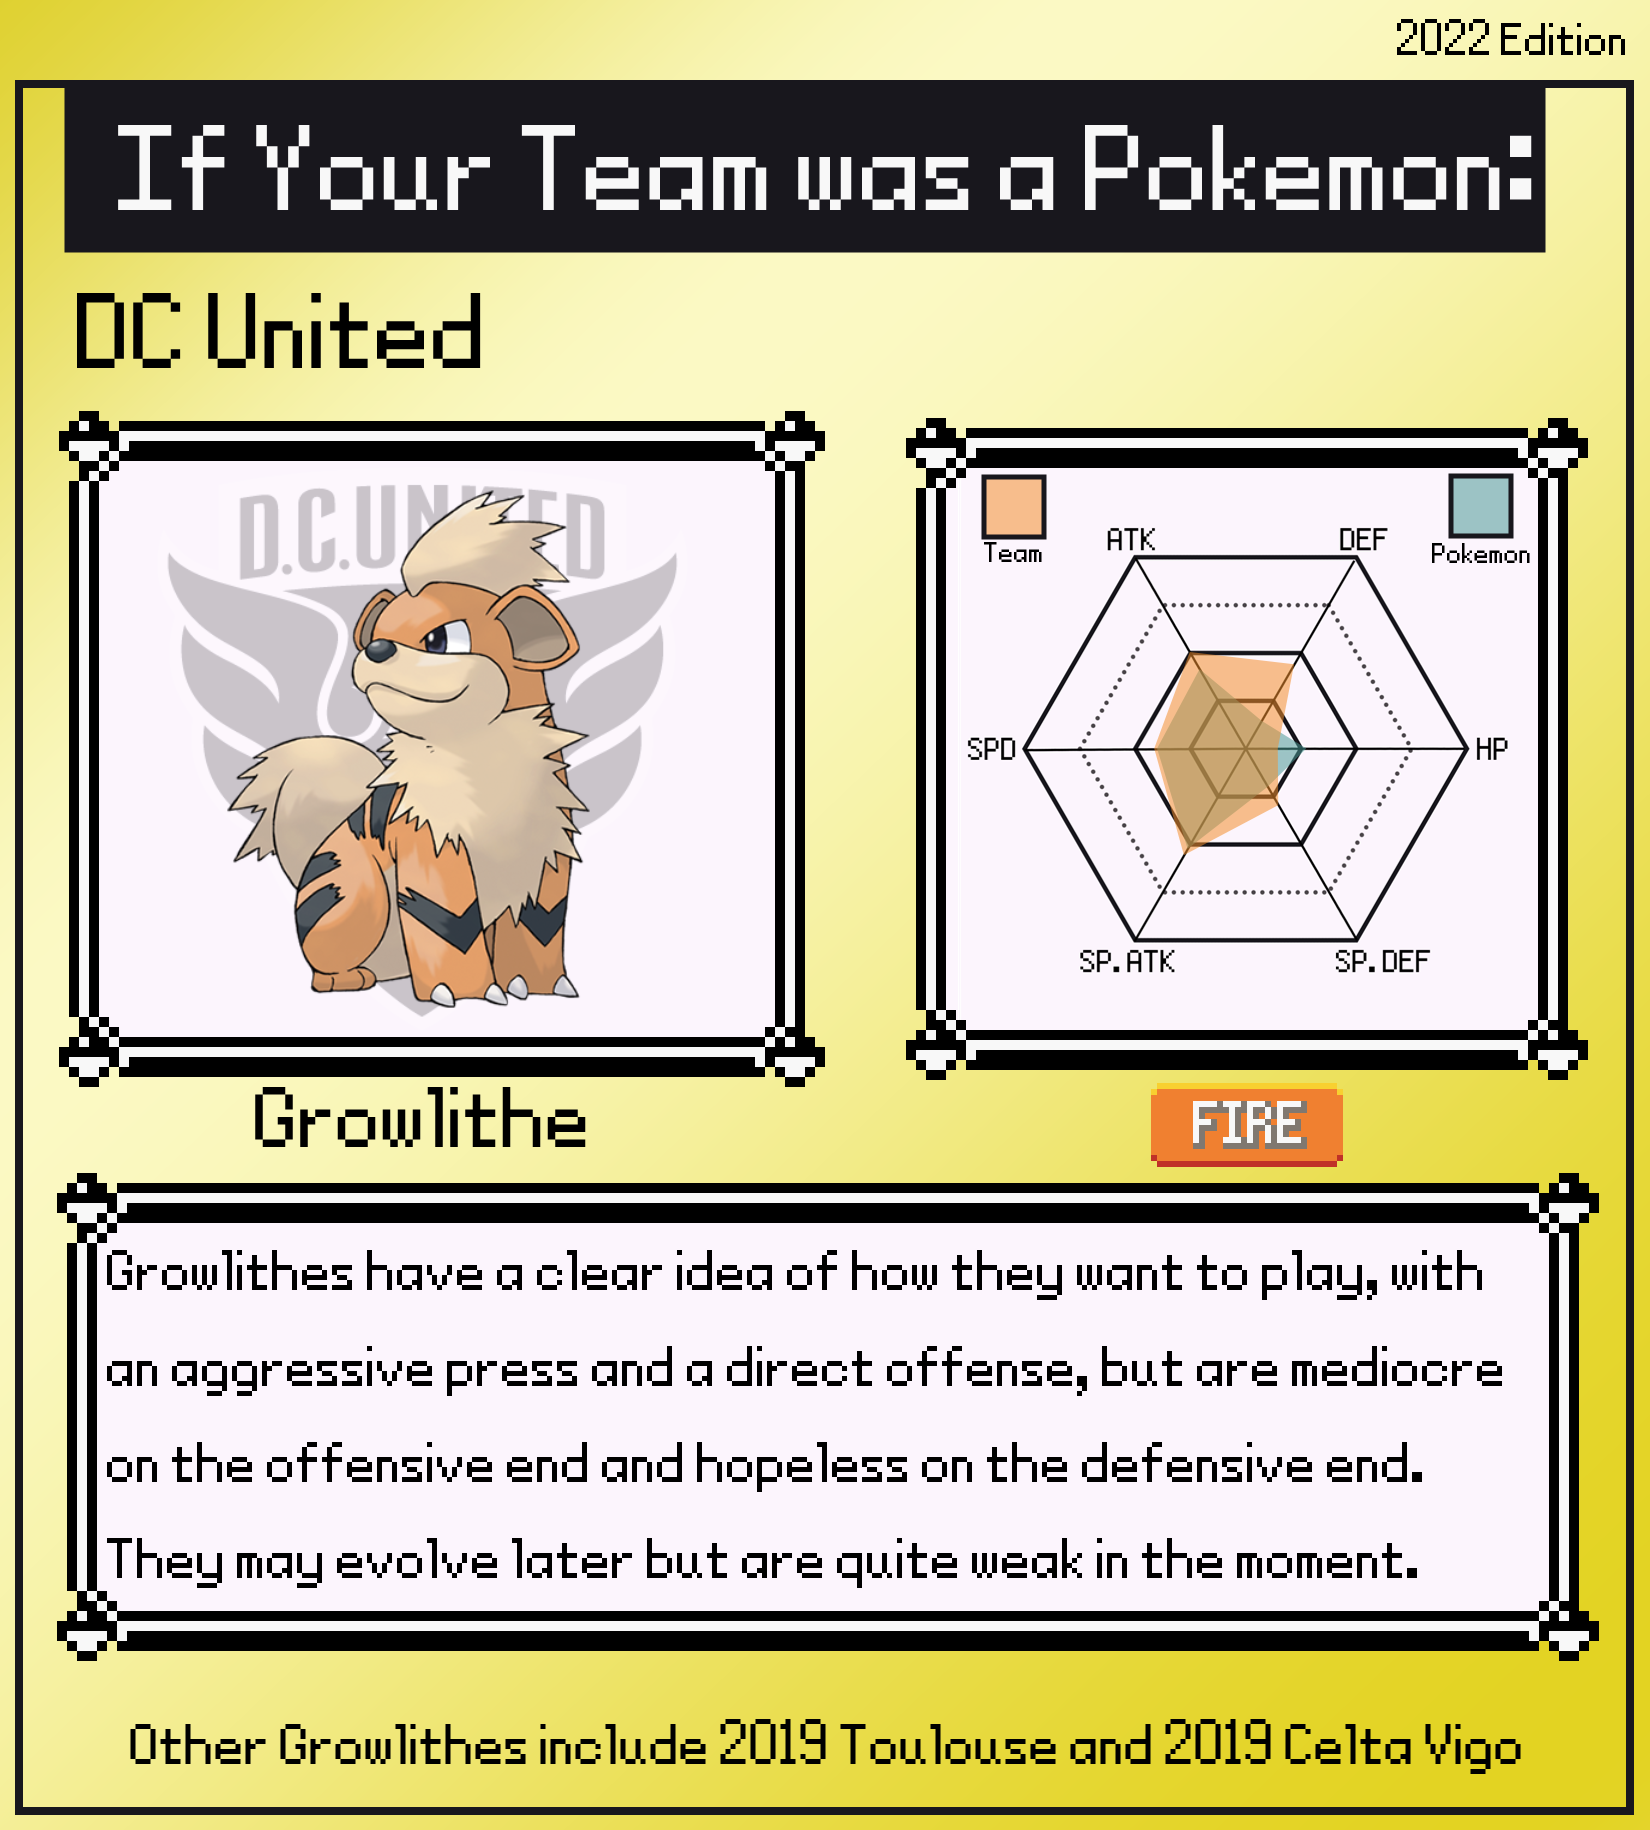
Each Pokemon has 6 underlying stats that determine how they performed in battle. Though there can be individual variations, the species of the Pokemon largely determined show their stats are distributed. The 6 stats are HP, Attack, Defense, Special Attack, Special Defense, and Speed.
To create a system that matches teams to Pokemon, each of the 6 stats match up to a metric that rates how well a team does certain things. The first three are focused on possession and field position, how much and where a team or their opponent has the ball. The last three are focused on efficiency, or how well a team does with or without possession in specific areas. I used a sample of all MLS and top 5 league teams from the 2017-2018 season up to June 2nd, 2022.
HP translates to overall possession, more specifically how many touches a team has per game. More touches means higher HP. The highest in the data set was 2020-21 Barcelona, with 850 touches per game. The lowest was 2020-21 Cadiz, with just 423. In MLS, the leader was 2018 NYCFC with 696.7 touches per game and the lowest has been 2022 Philadelphia with 486.5 touches per game.
Attack translates to field tilt. There are a variety of ways to define tilt, but in this case the metric is how many touches a team has in their opponent’s third, divided by total touches between teams. The output is a percentage that reflects the amount of possession spent in the opponent’s third. In the sample 2021-22 Manchester City leads the way with 21.4% of all touches being by them in their opponent's third. The worst team by this metric is once again 2020-21 Cadiz, with just 8.4%. In MLS, the highest percentage of attacking third tilt was held by 2018 Sporting Kansas City with 18.3%, and the lowest was held by the 2020 Vancouver Whitecaps with 8.7%.
Defense is the opposite of Attack, based on the percent of touches in the game by the opponent in a team’s defending third. 2021-22 Manchester City yet again lead the way by allowing just 6.1% of touches to be by their opponent in their defensive third. 2018-19 Parma are our other extreme, allowing opponents to take 19.1% of all touches in their territory. In MLS, the best so far have been 2022 Sporting Kansas City who have allowed just 9.5% while the weakest team was the 2019 Vancouver Whitecaps who allowed 18.5%. Very clear trends on the possession side!
Having the ball is all well and good, and keeping it in dangerous positions is even better, but it doesn’t matter without efficiency. That’s where the other 3 metrics come into play.
Special Attack is the amount of final third touches a team has taken divided by their total xG. This reflects their ability to create goal scoring chances from possession. Even racking up gaudy possession numbers can be undone by inefficiency, and many teams have survived games where they see little of the ball by making the most of what they do have. In the data set, the most efficient team was 2019-20 Borussia Monchengladbach who took 72.5 attacking third touches per xG generated. The least efficient was 2018-19 Huddersfield Town, and already weak team in possession who nonetheless took more than 200 touches in their opponents third per xG generated! The most efficient attacking team in MLS has been the 2022 Red Bulls so far, only needing 83.8 touches per xG generated. The least effective was 2020 Atlanta who needed 159.4 touches per xG generated.
Special Defense is the same measure, but on the other end. How many touches do your opponents need in your third to generate xG? The most defensively solid team in the sample was Diego Simeone’s 2019-20 Atletico Madrid, whose opponents needed 185.6 touches per xG generated. In MLS, the toughest defending team has been 2022 Philadelphia, whose opponents need 172.3 attacking third touches to generate a single xG on average. The team has offered the least resistance across the entire sample is MLS’ very own 2022 San Jose Earthquakes, whose opponents have only needed 63.8 touches in the attacking third to generate 1 xG.
Speed is unique among the measures. It is the number of touches taken per shot generated. Of all the measures, it is the one that does not correlate with success; in fact, it has a slight negative correlation. Fewer touches per shot can mean that a team is snatching at poor chances, or it can mean that they are more direct.In the sample 2020-21 Aston Villa took the fewest touches per shot at just 32.7; meanwhile at the other end 2018-2019 Barcelona took the most touches per shot at 92. In MLS, the most rapid (or rushed?) team has been the 2022 Red Bulls, who take just 35.2 touches for every shot. The slowest was 2020 Atlanta who took 70.8 touches per shot they took.
The matches were made by taking the average difference of the percentile rank of each stat, and returning the match with the smallest average difference. There is a final tiebreaker to help narrow down comparisons more effectively, and that is by Type. Types in Pokemon are complex, but they do tend to follow certain trends. Fire types are more aggressive, for example, and Rock types are much more passive. Teams are associated with types based on how frequently they press high up the pitch. The metric used is opponent’s defensive third touches per times pressed. Because this is more subjective, I used it to separate relatively close matches while still getting “personality” fits.
Who’s That Pokemon?!
Here are the matches for every team from the 2022 MLS Season so far:


And for comparison, here are the matches for the 2021 season.


What does it all mean?
All this is fun, but is it informative? What does it mean to play like a Mewtwo or to play like a Staryu?
Good teams can be good in different ways:
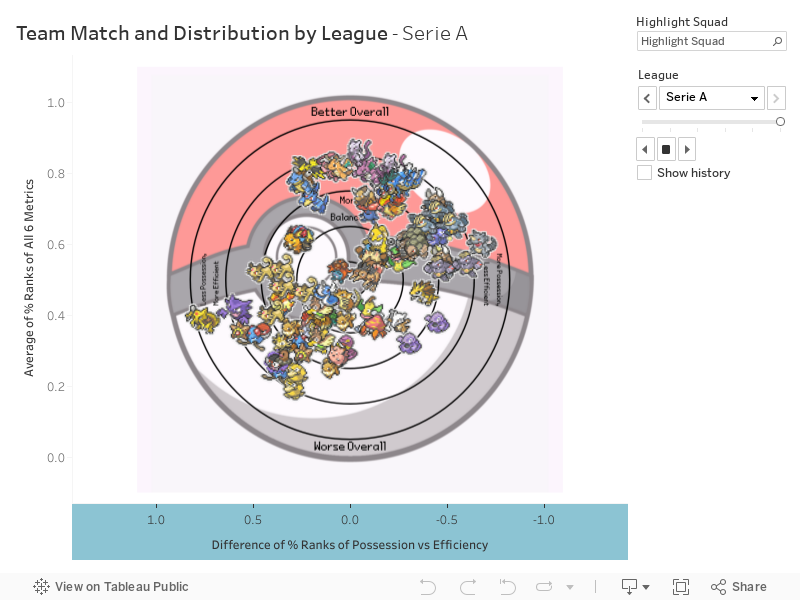
The chart below looks at how teams have performed across different leagues, and some trends do begin to emerge.
MLS is a much more equal league in general, with far more teams able to have success while having lower positional control through possession. It’s entirely possible to be a good team that doesn’t have the ball as much, but those teams are rarer when there are better teams in the league.
Serie A is an interesting league at the top. It’s entirely possible to contend for a championship in the league as a team that doesn’t dominate possession or position, a rarity in the top five leagues. The Premiership and La Liga are the most skewed between top and bottom teams, but there are relatively few teams in the lower possession group that don’t make their attacks count (aside from the hapless 2022 Norwich).
The charts can be explored in more detail below:
You Have to Evolve
Everyone knows that Pokemon are better when they’re an evolved form, and the same holds true in this situation. A quick offhand way of telling if a team is good or not is whether or not their closest match is an evolved form or not. This is especially true for the handful of Pokemon with three stage evolutions. The lowest stage tends to be teams that are relegation contenders, the middle stage is comfortable teams who aren’t quite contenders, and the highest stage are teams contending for championships.
Here’s the 3 evolutions of Squirtle, the teams that represent them, and how they did their seasons:

You need more than the ball:
Speaking of evolutions, in 2021 Sporting Kansas City was a Rhydon. Unfortunately, in 2022 they have devolved and their current closest comparison is Rhyhorn. What’s the common thread? Absolutely garbage defense.
Sporting Kansas City by possession and position numbers was a respectable defensive team in 2021. They were 91st percentile in keeping opponents from having touches in their final third, and 3rd overall in MLS behind 2022 and 2020 Sporting KC. Under the surface lurked the reality - when actually required to defend in their final third, they were hopeless. 2021 Sporting KC was just 2nd percentile in defensive resilience. After losing key offensive pieces to transfer or injury in 2022, their defensive performances stayed terrible (and slightly worsened to 1st percentile) but their ability to create chances while on the ball suffered. Now, they are legitimately one of the worst teams in the league.
For teams to succeed at the highest level, they need to be resilient and efficient. While there are certainly teams that power their way to success through total domination of possession and position, they are very few. Interestingly enough at a certain level of possession a team can afford to be less than dominant in one of the efficiency stats - 2020 Barcelona had a tremendously inefficient attack but still had a solid defense, and through a plurality of chances found goals.
Meanwhile there are teams that can punch above their weight even without the ball, simply by attacking directly and ruthlessly while resisting attacks. Mr. Mime is the patron Pokemon of the effective bunker and counter team - his 5 matches all outperformed expectations in their leagues, the most recent being 2022 Brentford easily staying up in their first year in the Premiership. Mr. Mime may also be the patron Pokemon of draws - he was the match for 2021 Nashville SC.
Radars and other Vizzes:
Here’s the radar comparison for each and every one of the 521 teams and 151 Pokemon in the sample.
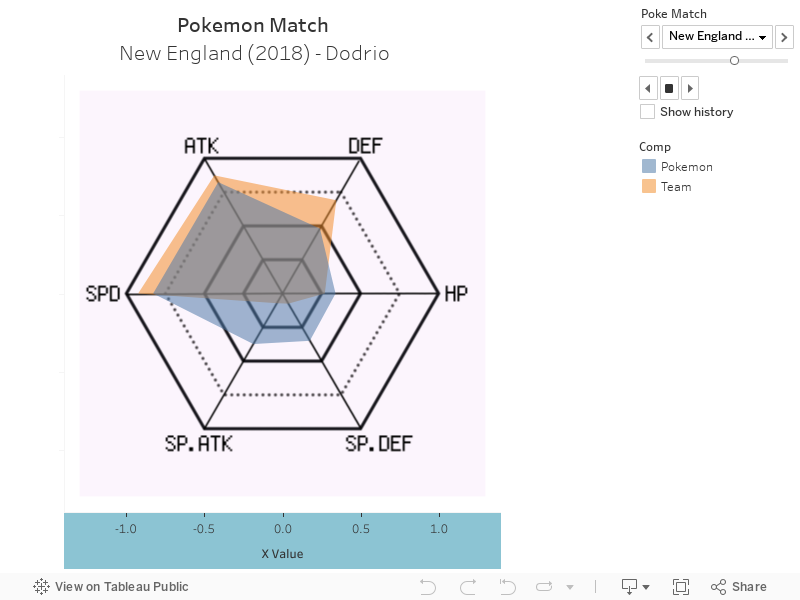
Here’s the visualization that shows the matches for the 2021 MLS season.
For my super nerds, to whom each and every one of the 898 Pokemon and their assorted types have deep meaning, you can find comparisons to the full Pokedex here. Because there are so many more options, these comparisons are more accurate in the details but maybe less meaningful to anyone not steeped in the game lore. I can’t say that I know what it means that 2021 LAFC was a Mega Medicham, but one of you might!
Thank you to everyone who reads this for indulging my nostalgia and deep love of both Pokemon, and soccer as a whole. I hope it was as fun to read as it was to make, and that it sparks discussions of what your teams are or could be.