

Measuring Goalkeeper Impact in MLS: A Data-Driven Look at Value, Volatility, and Efficiency
/By Lucas Morefield
Goalkeeper evaluation has always been one of the thorniest challenges in soccer analytics. The position is defined by small sample sizes, high variance, and context-driven outcomes. In Major League Soccer, where roster rules magnify the impact of every marginal dollar, understanding goalkeeper value is especially important. With clubs often operating near budget ceilings, a single overperformance or underperformance in goal can shift playoff probability, alter roster-building timelines, or change the financial implications of a season.
This project uses goals added (G+) and MLS salary data to evaluate goalkeeper impact from multiple angles: their contribution to team standings, their efficiency relative to cap hit, and how their performance fluctuates year-to-year. The goal is not to produce a definitive model or prescribe specific roster strategies, but rather to explore goalkeeper value through a framework that raises sharper questions about a position that is both highly influential and deeply unpredictable.
For simplicity, this analysis uses only one goalkeeper per club, that which played the most minutes. All salary figures reflect guaranteed compensation as reported by the MLSPA, ensuring that comparisons across players and seasons rely on a standardized measure of financial cost. These choices simplify the dataset and allow for cleaner year-over-year comparisons, but they also mean that mid-season changes, injuries, and incentive-based earnings are not captured in full. You can find this data and the corresponding Tableau worksheet embedded below, or here.

Methodology: Translating Performance into Points
The backbone of this analysis is ASA’s Goals Added (G+) framework, which captures every measurable action a GK performs relative to average, from shot-stopping to sweeping. I’ve always been interested in isolating the impact that goalkeepers have on their team’s season. Beyond the eye test, it’s often difficult to tell what a goalkeeper provides for their team when compared to an average one. Looking past that, how do those contributions change the fate of a team’s season?
Converting Goals Added into Points
To express goalkeeper impact in standings terms, I first estimate how goals translate into points at the league level. I regressed match-level expected goal differential against points earned. The fitted model produces a coefficient of approximately 0.64 points per goal, reinforcing the historical rule of thumb that a one-goal swing in performance quality is worth roughly two-thirds of a point in the standings.
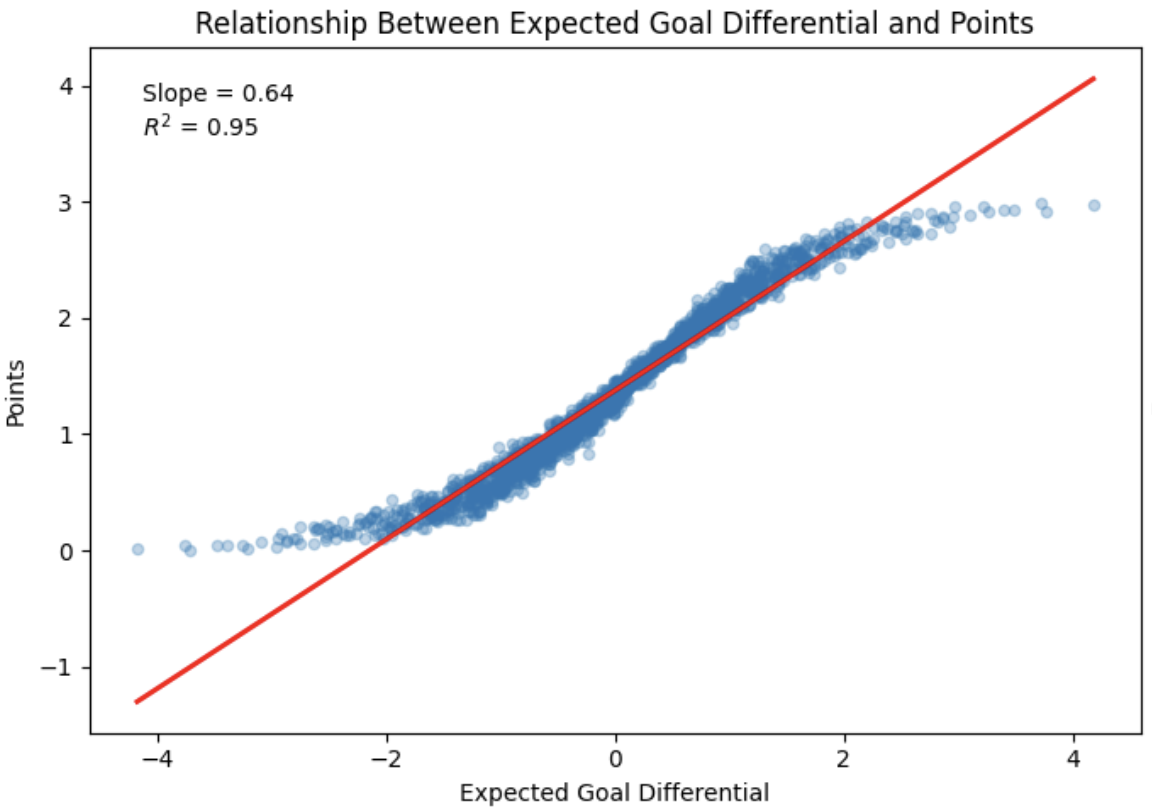
Because goalkeeper g+ is dominated by shot-stopping, it maps naturally onto this framework. Shot stopping directly shifts a team’s goals against and therefore its goal differential. Applying the league-wide conversion allows goalkeeper goals added to be expressed in points context, not as a precise causal claim, but as a principled translation of goal prevention into standings impact.
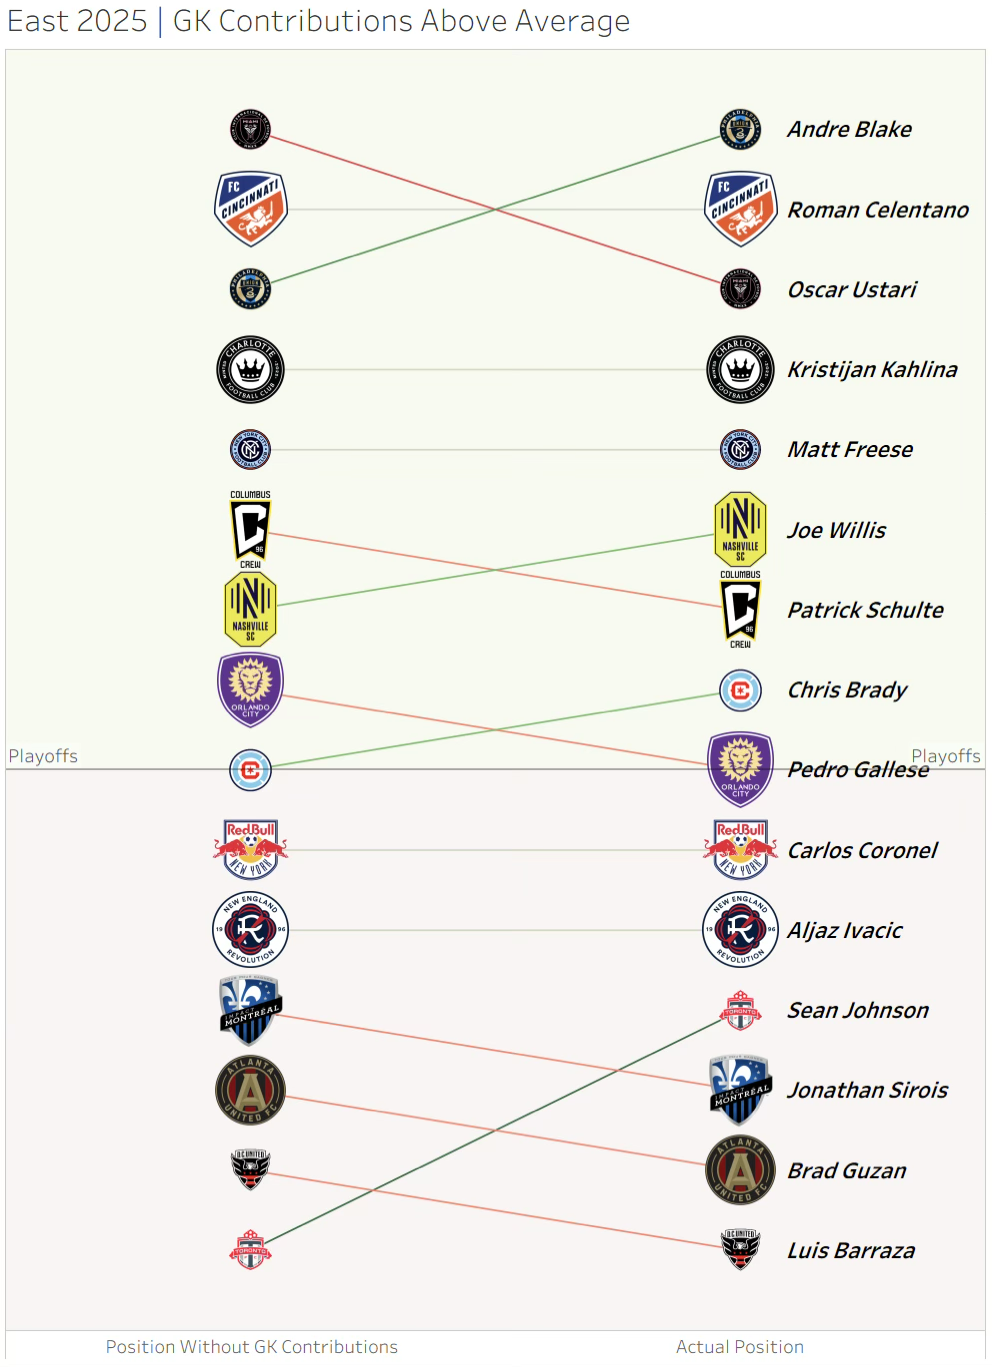
Counterfactual Standings
By subtracting goalkeeper points added from every team’s ending point total, we can create conference standings that assume every team fielded an average goalkeeper (Position Without GK Contributions). This allows us to clearly see the impact (positive or negative) a goalkeeper’s contributions had on their club (Actual Position).
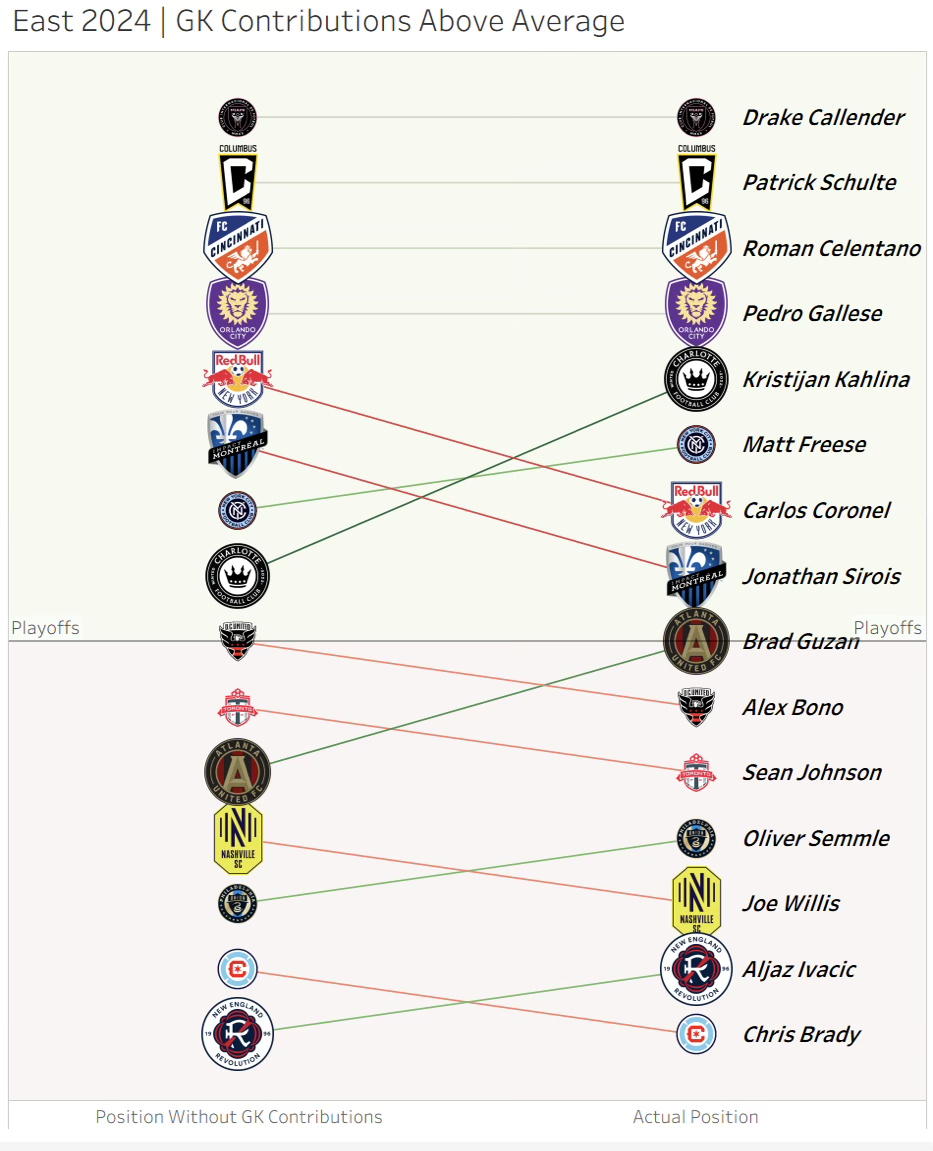
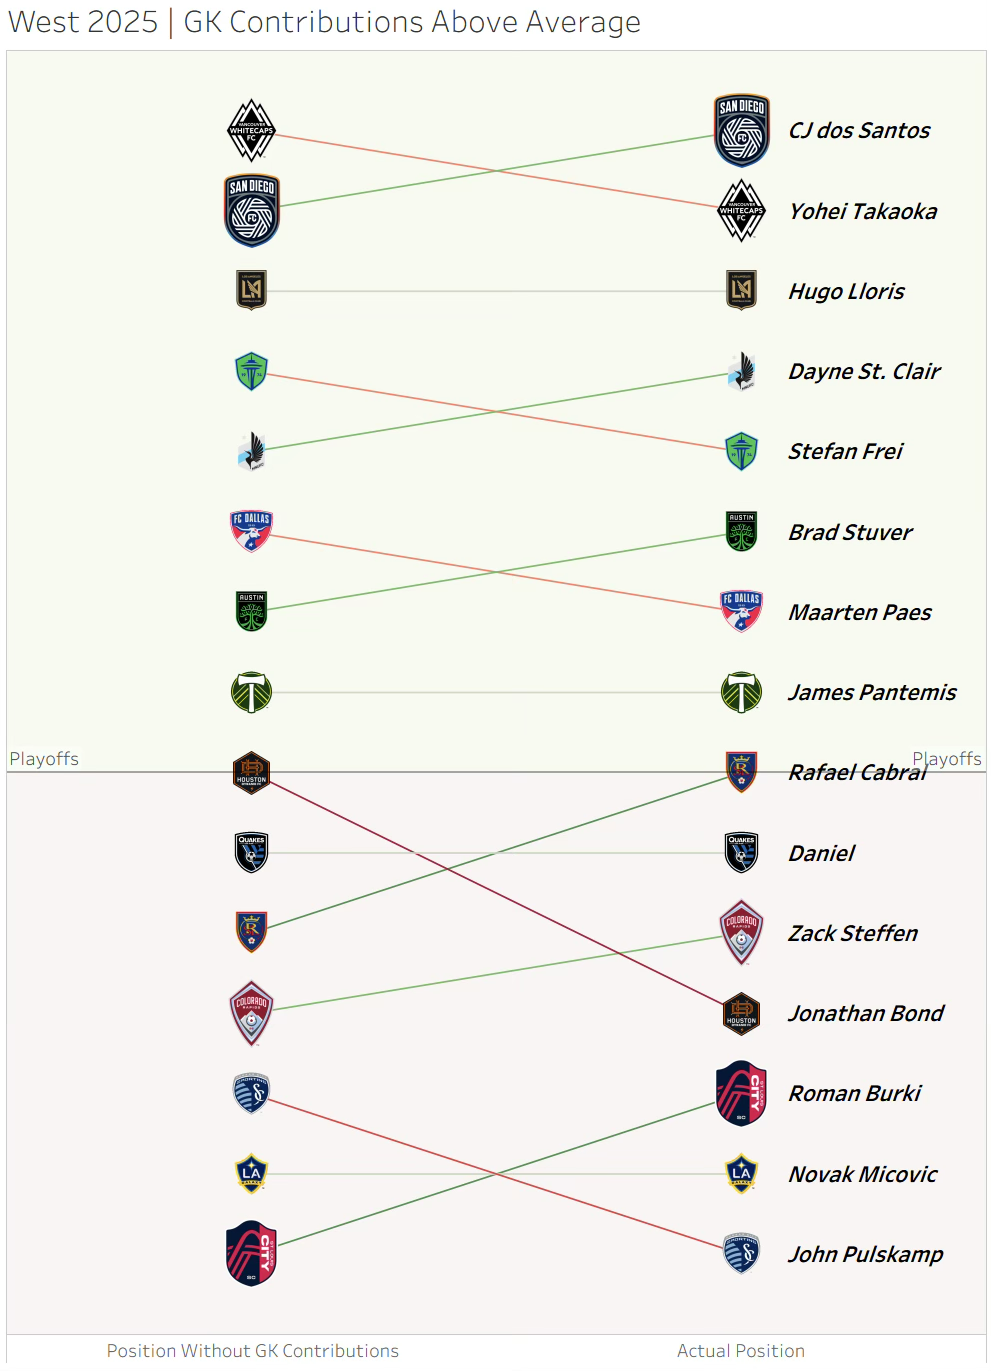
How Much Do Goalkeepers Actually Impact Standings?
The results are stark. Across three seasons:
Many MLS teams experience 3-5 points of swing entirely due to GK performance.
A handful of goalkeepers provide enough marginal value to shift their clubs into or out of the playoffs.
Poor GK seasons often cost teams the equivalent of a home playoff match or the playoffs altogether.
The league’s structure amplifies this effect. Because playoff lines are tight and most teams land between 40–52 points, even a +3 or −3 GK swing can redefine a season.
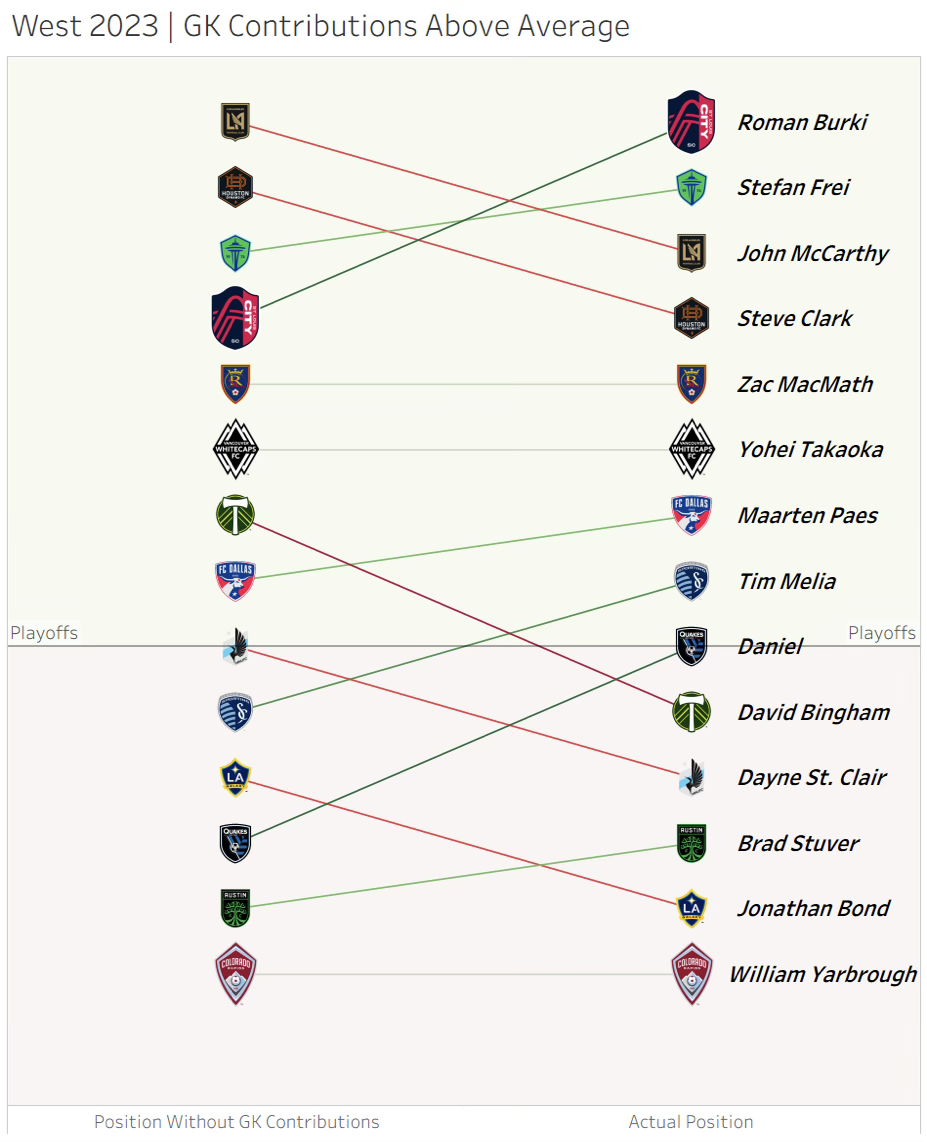
Case Study: Dayne St. Clair’s +7.35 Points Added and the Real Financial Value of Goalkeeping
One of the clearest examples of goalkeeper-driven value in recent MLS seasons is Dayne St. Clair’s 2025 campaign. His +7.35 points added (via ASA’s G+ → points conversion) significantly altered Minnesota United’s postseason path.
The Counterfactual
With St. Clair, Minnesota finished 4th in the Western Conference. Without his contributions, their projected finish drops to 5th.
Under MLS’s Best-of-3 first round:
4th place hosts Games 1 & 3
5th place hosts only Game 2
Because Minnesota secured the 4th seed, they received two home playoff matches instead of one.
Minnesota won both of those home matches via penalty shootouts, where goalkeeper influence is disproportionately high.
This creates a clean, quantifiable impact chain:
St. Clair’s shot-stopping → higher seed → more home games → playoff advancement
Quantifying the Added Value of Two Home Playoff Games
Using Minnesota’s 2025 average attendance of 19,247 (near stadium capacity), we can estimate the incremental financial value of the additional home matches created by St. Clair’s points added.
Revenue Inputs (conservative but realistic)
Attendance: 19,247
(Allianz Field 2025 average attendance)
Average playoff ticket price: $60–$80
(based on resale market ranges for MLS playoff games)Per-fan matchday spend (concessions/parking): $20–$30
(industry-standard stadium benchmarks)Sponsorship activation uplift per playoff game: $200k–$400k
(local partner activation and playoff inventory premiums)
Conservative Estimate — Per Home Match
Ticket revenue: 19,247 × $60 = $1.15M
Concessions/parking: 19,247 × $20 = $385k
Sponsor uplift: $200k
Total per home match= ≈ $1.7M
Two matches = ≈ $3.4M
Given the assumptions and reasonable MLS benchmarks:
Dayne St. Clair’s +7.35 Points Added plausibly generated $1.7M–$2.0M in incremental value for Minnesota United, through improved seeding, two home playoff matches, and subsequent playoff advancement.
This is a clean demonstration of how goalkeeper performance directly drives both standings outcomes and real financial return under MLS’s current playoff structure.
Why This Case Study Matters
St. Clair’s season embodies the core insight of this project:
A goalkeeper’s marginal points can produce millions in organizational value
Standings impact is not abstract—it is directly monetizable
MLS’s playoff format amplifies GK contributions
Performance and salary efficiency should be evaluated together
St. Clair’s +7.35 points added did far more than improve Minnesota’s defense.
It created home-field advantage, determined playoff survival, and generated meaningful commercial value. This full demonstration of DSC’s impact raises an interesting question given his status as a free agent. How much is he really worth? With St. Clair headed to Inter Miami, it’s feasible to look at an even max TAM level contract as a good investment.
Editor’s note: Philly was right to sign Raïs M’Bolhi to a DP contract.
The combination of standings impact and financial return underscores how meaningful goalkeeper performance can be. But to fully understand the market, we also need to evaluate efficiency. The following salary scatter plot allows us to measure precisely which goalkeepers deliver the most value per dollar and where MLS clubs find (or miss) competitive advantage.
Salary Analysis
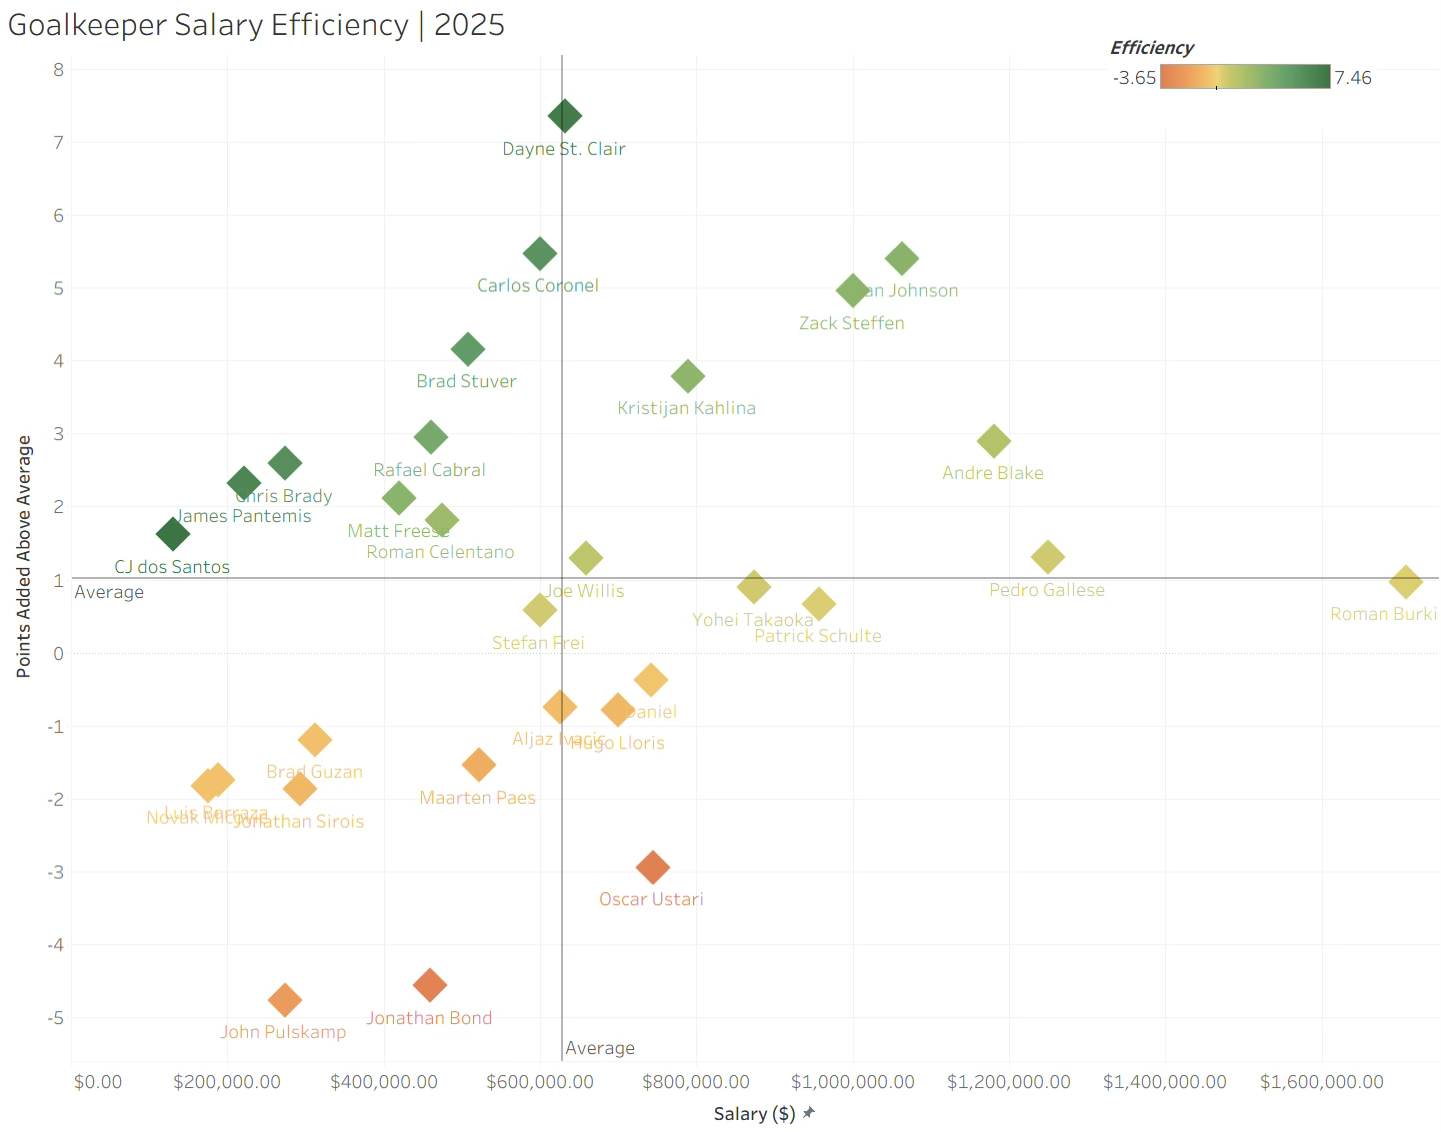
Efficiency Metric
To evaluate how effectively MLS clubs convert goalkeeper spending into on-field value, this scatter plot uses an “Efficiency” metric that scales a goalkeeper’s Points Added Above Average by their salary relative to a baseline MLS starting goalkeeper wage.
The formula used in Tableau is:
IF [Points Added] > 0 THEN
[Points Added] / ([GK Salary] / 600000)
ELSE
[Points Added (Dynamic)] * ([GK Salary] / 600000)
END
What the Metric Measures
The metric answers a practical roster-building question:
How much on-field value does a goalkeeper produce per dollar of salary, relative to a standard MLS goalkeeper contract?
The baseline of $600,000 approximates the typical salary for a starting MLS goalkeeper based on MLSPA data from the previous three seasons. Dividing or multiplying by the salary ratio ensures the metric adjusts performance relative to cost:
Goalkeepers earning less than $600k have their efficiency boosted when they add value.
Goalkeepers earning more than $600k see reduced efficiency unless their performance meaningfully exceeds expectations.
How the Formula Behaves
Positive Points Added:
If a goalkeeper adds value, efficiency is calculated by dividing Points Added by the salary ratio. This rewards high-performing, low-salary keepers and tempers the scores of expensive ones.
Negative Points Added:
If a goalkeeper costs their team points, efficiency is calculated by multiplying Points Added by the salary ratio. This penalizes high-salary underperformance more heavily while preventing extreme outliers for low-salary goalkeepers.
Interpreting the Color Scale
The scatter plot color scale is derived from this efficiency value:
Green represents positive value relative to salary.
Red represents negative value or poor cost-performance.
Orange/yellow indicates approximately break-even value.
This structure allows the visualization to reflect a core MLS roster-building principle: performance must be evaluated in proportion to both salary and opportunity cost.
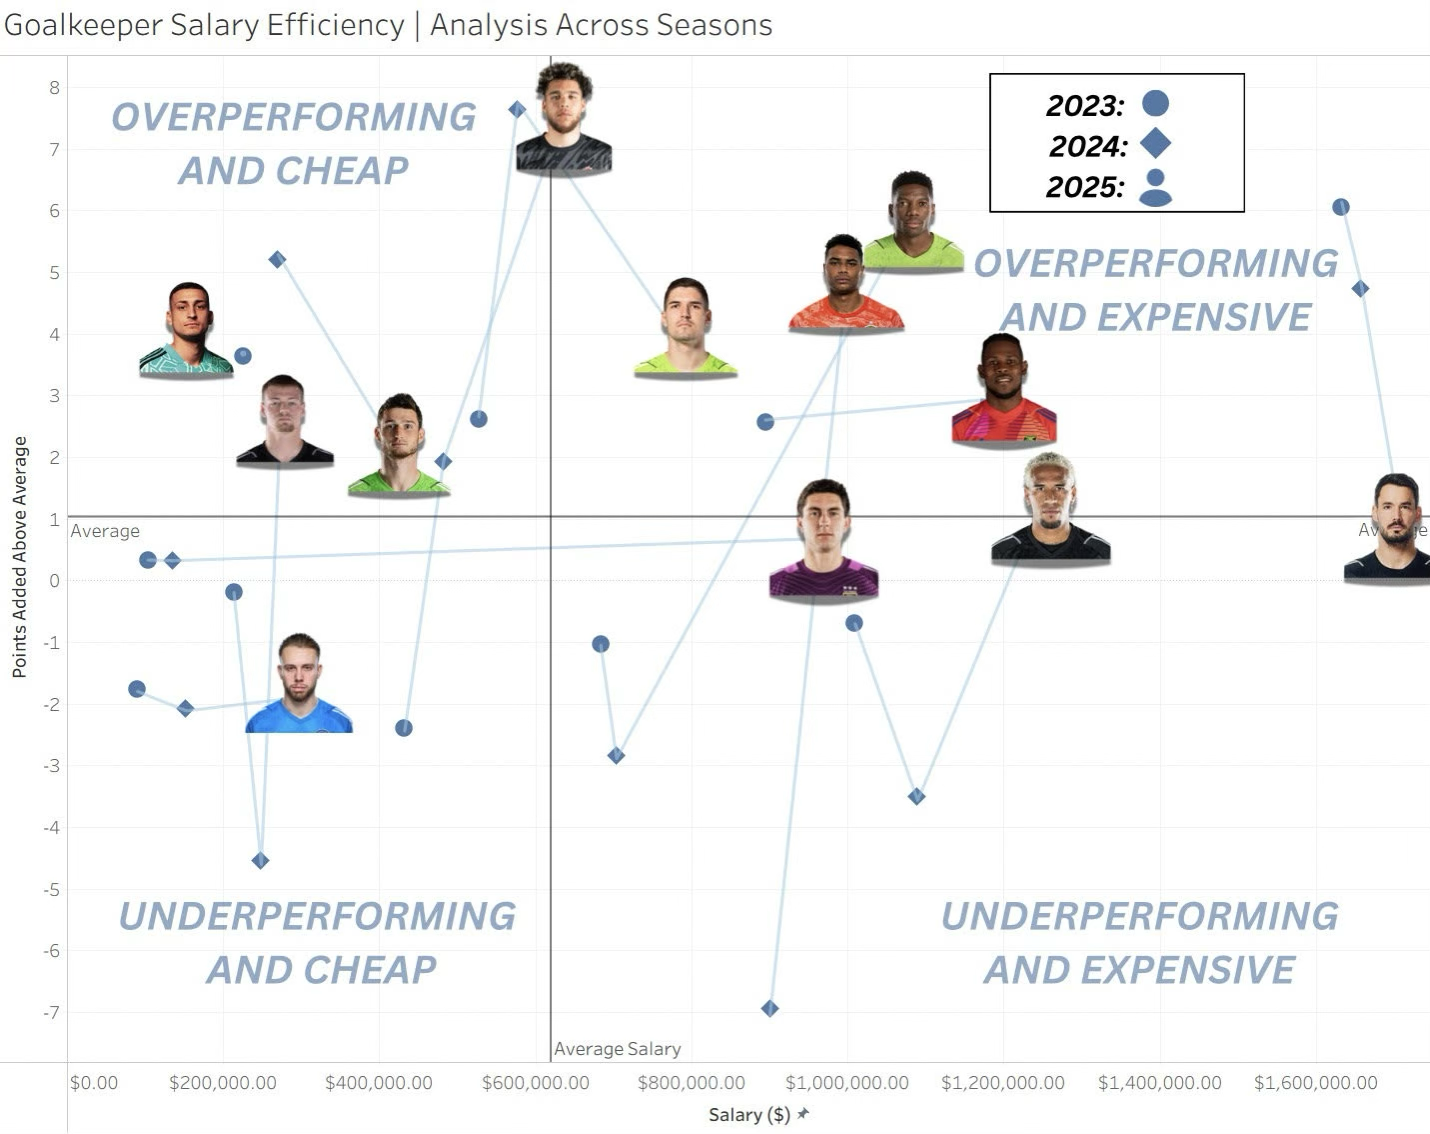
There are limits to what a single-season salary–performance snapshot can reveal. To understand goalkeeper value more fully, I extended the analysis across multiple seasons and tracked how certain goalkeepers moved between quadrants over time. Each trajectory begins at 2023 and ends with the goalkeeper’s headshot. This approach reframes the scatter plot from a static evaluation into a dynamic view of performance volatility, contract adjustment, and career stage, all of which are central to assessing goalkeeper value under MLS roster constraints.
Overperforming and Expensive
This quadrant is populated by elite goalkeepers on premium contracts. Tracing the trajectories of Sean Johnson, Zack Steffen, and Roman Bürki highlights the natural performance volatility that often accompanies aging veterans. Even among top-tier starters, year-to-year swings are common. This reinforces the importance of contract flexibility, especially when clubs are paying not only for shot-stopping but also for leadership, organizational value, and fan recognition.
Entering this quadrant in 2025 are Dayne St. Clair and Kristijan Kahlina. St. Clair’s rise is particularly notable. After three seasons on an average to below-average starting goalkeeper salary, he now projects firmly into the high-salary tier. With his recent move to Inter Miami, getting an appropriate level of production from DSC’s, presumably now very large, salary will be a key impact on Miami’s ability to manage their cap in 2026.
Overperforming and Cheap
The top-left quadrant captures the most efficient goalkeeper profiles. These players deliver above-average performance while earning below-average salaries, creating clear surplus value. Strong seasons in this quadrant rarely last without consequence. Clubs are typically forced to act, either by extending contracts or selling at peak value.
Djordje Petrović followed the transfer route. His elite 2023 season led New England to sell at the optimal moment, generating more than $14 million in profit plus potential bonuses. Kristijan Kahlina represents a steadier version of this path. He was the only goalkeeper in the dataset to produce above-average points added across all three seasons, delivering sustained value at a modest cost before earning a contract extension in 2024. This quadrant consistently shows where clubs extract the greatest return on investment and why efficiency at goalkeeper is often fleeting.
Underperforming and Expensive
The bottom-right quadrant reflects the most uncomfortable short-term outcomes: above-average salaries paired with below-average shot-stopping value. Within MLS budget constraints, this is the clearest form of negative efficiency. However, the multi-year trajectories suggest this profile is often temporary rather than structural.
Players like Gallese, Johnson, and Steffen rebounded after down seasons, underscoring the volatility inherent in goalkeeper performance. Patrick Schulte’s placement here requires additional context. His year-to-year consistency hovers just below the average points added value. I will argue that there is much more value in that than wild fluctuations year-over-year. I think most coaches would agree with my sentiment. He was central to Columbus winning the MLS Cup in 2023 and was rewarded with a monster contract evident by his trajectory on the plot.
Underperforming and Cheap
This quadrant captures multiple developmental paths. Young starters like Chris Brady and Dayne St. Clair posted sub-average seasons before improving sharply the following year, a common pattern for goalkeepers still refining consistency. Jonathan Sirois, playing behind a struggling Montréal side, produced negative value on paper but remains a positive expected-value asset due to his low cap hit. When his contract expires in 2026, I wouldn’t be surprised to see European clubs come calling, perhaps like Anderlecht.
The key insight is that this quadrant is not inherently problematic. For young goalkeepers, it often serves as a staging ground before a breakout season. For clubs, it functions as a low-cost evaluation phase. Columbus’ return on Patrick Schulte illustrates how much upside can exist in this space. At these salary levels, teams can absorb negative value without sacrificing roster flexibility, making this quadrant essential rather than avoidable.
Conclusion
This study set out to quantify goalkeeper impact in Major League Soccer and to explore how performance, compensation, and year-to-year trends interact in a position often treated as unpredictable and difficult to value. By pairing goals added with salary data, layering in league-standing outcomes, and visualizing results through efficiency metrics and quadrant-based comparisons, the analysis provides a structured way to contextualize goalkeeper output within MLS roster constraints. The approach does not claim to solve the goalkeeper valuation problem, but it does surface patterns that are difficult to see through traditional statistics alone.
Across quadrants, several themes emerge. Young, low-salary keepers show wide volatility: sometimes struggling, sometimes breaking out, and often reshaping their club’s roster flexibility in the process. High-salary starters demonstrate that even established names can swing meaningfully from one season to the next, raising questions about contract length and the risk tolerance built into cap-restricted decision-making.
Ultimately, the findings should be viewed as directional rather than prescriptive. Goalkeeper evaluation remains inherently noisy, and the patterns observed here are starting points for deeper inquiry rather than final verdicts. The study’s framework—linking performance impact, financial cost, and team outcomes—offers clubs, analysts, and researchers a new lens through which to examine one of the league’s most variable positions. The goal is not to declare answers, but to raise sharper questions: How should teams price volatility? When is it worth paying for stability? And what does “value” look like at a position where even small swings can alter a season’s trajectory?