

Check Out futi
/Hey folks, our long time friends Mike Imburgio and John Muller are putting out an app. Kieran, Ben, and Harrison spoke to them on the pod if you want to hear some more of the why, and some of the fun things coming out on top of it. ASA wouldn’t have built many of the cool things we have over the years without these two gentlemen, and it’s pretty exciting to see what they’re building now. Mike is here to explain more below.
futi is a next-gen live score app built to bring pro-quality analytics to fans in a familiar format. We’re rolling out model explainers and early data releases so you can preview the models behind the app. Follow us to keep up to date and be part of the future of fan-facing stats at the links below:
My first day in the ASA slack felt like coming home. I met some incredible people that I owe a lot to for how much I’ve learned from them and how they’ve influenced my life. Sam Goldberg, now with RBNY, is one of them. When he and I published DAVIES, it opened doors to working in professional soccer that I never could have dreamed of before I found this community. That wasn’t the point for me, though, and it wasn’t why ASA felt like home. John Muller was one of the first people I interacted with here, and that first day he sent me a message that summed up ASA’s resolve to bring quality stats to fans in a world where most of the good stuff was out of their reach: “Welcome to the resistance.”
John, like everyone else I’ve met here, was truly passionate about the idea that bringing better soccer data to as many people as possible was important. That’s why ASA felt like home. He and I have spent the last year working on futi, a live score app that we hope will do exactly that. We want to give you, the fans, access to better stats on a larger scale than ever before.
I’m all too familiar with being an analytics-starved fan. In 2012, I resolved to expand my soccer fandom into new leagues. I started by researching the different styles of play across them to help me decide where to focus my time. A fan-made flow chart on reddit based on vibes was the most helpful resource I could find, despite the fact that it was half tongue-in-cheek. I’d settled on making the Bundesliga and the Eredivise the primary leagues I watched (yes, I’m still a bit of a hipster who hates defense). I hunted for stats to tell me which players I should be watching in those leagues and how they played - not just top goal scorers or assist-getters, but all kinds - and hated what I found. They were opaque player ratings that claimed to tell me who the best players in the league were, but I had no idea what was behind them. It was at this point in 2012 that I gave up on soccer statistics.
Had I known that Sarah Rudd was at StatDNA creating one of the first versions of a possession value model a year earlier to do exactly this for clubs, I would not have given up on soccer statistics. But I still would have had to wait eight years for access to a public one here at ASA.
About that many years later, I was sucked back in by COVID lockdown and an intense desire to procrastinate writing my graduate thesis. I was ecstatic to find a lot more public data this time around. Fired up, I cold emailed a well known data provider in the club space asking for a student discount on a data package and got promptly stonewalled. Even with everything that was now available online, I couldn’t find anything that told me about different styles of play across players. I spent more time than I care to admit creating a model that tried to do that, exactly the kind of thing I would have wanted when I started watching new leagues in 2012. I knew it needed a lot more work, but I was excited and lucky enough to have it published on this website. I felt like an innovator.
Had I known that Ian Graham was already doing almost exactly this at Liverpool for years in a much better way, I would not have felt like an innovator. I probably would have emailed him and asked for a student discount on his model, though.
When Sam and I made DAVIES, we included a platform to allow fans to play with the results themselves. The public data that made that platform possible isn’t available anymore, but seeing people use it to discover new players, write about it, and tweet about it was incredible. It allowed me to appreciate on another level everything that ASA stands for - bringing people new ways to engage with soccer because it’s the right thing to do for the sport. It helped me understand how important it is to have a group like ASA in the world who care so much about that, because there are many more people who care equally as much about having that kind of information at their fingertips.
Since then, while working with clubs, I’ve gotten access to the data I couldn’t get a student discount on. I’ve worked on models for them that I would’ve loved in 2012 when all I wanted to do was watch more soccer. I’ve had less and less time to create things for fans and write things here and honestly, I’ve felt guilty about it the entire time.
Fans deserve the kinds of numbers that tell you which leagues to watch if you’re a defense-hating hipster, which teams in those leagues embody or buck that trend, which players in those leagues are actually good and what kind of player they are. You’re probably exactly the kind of fan that needs no more explanation, because ASA is one of the only places left on the internet where you can answer some of these questions yourself with g+.
With futi, we want to give fans the analytics they deserve by putting the kinds of models that clubs have been developing for years, but remain out of reach for the average fan, into a live score app. It’s the same kind of app you probably already use to track a match and check up on scores, just with a lot more data to help you follow along.
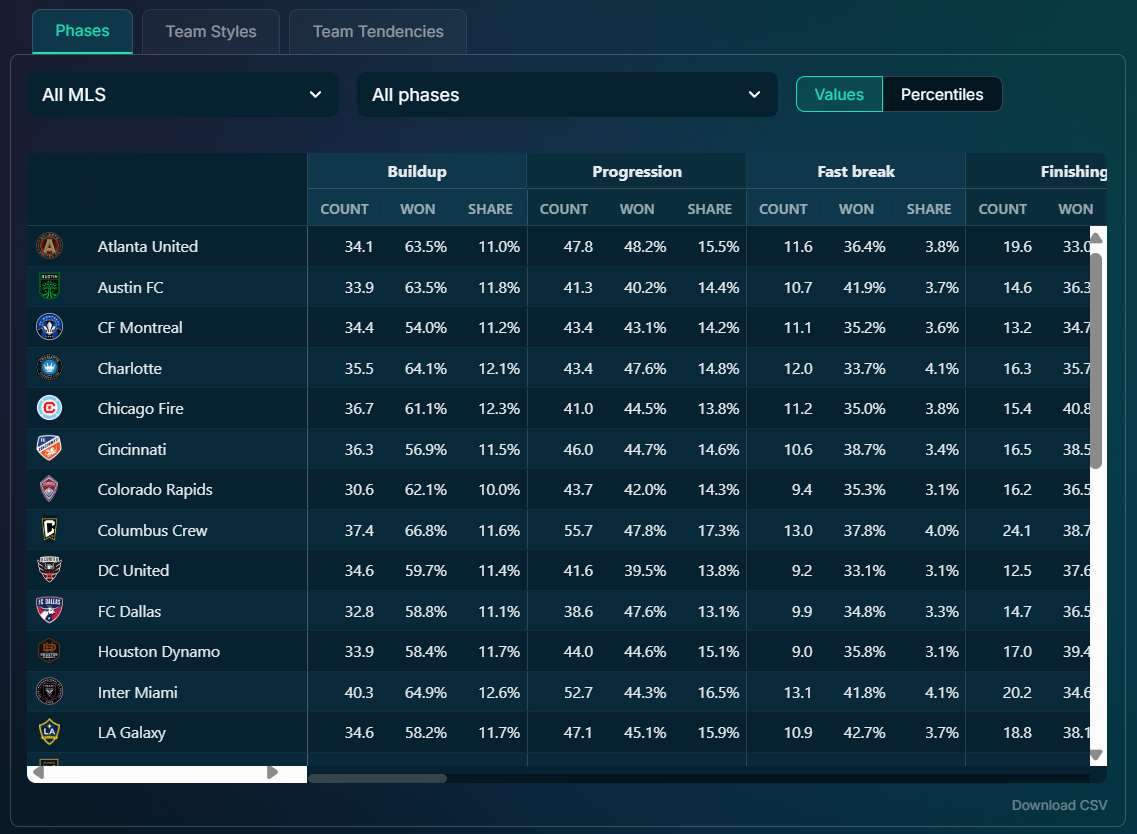
futi will give you access to player ratings that are based on possession value. It’ll bring you metrics that tell you that a nominal winger is actually more of a central attacker and whether they drift wide, crash the box, or stay central to create compared to others. You’ll be able to track whether a team deserved to win, lose, or draw according to underlying stats during the match and their expected table finish throughout the season. futi gives context to these stats using a phase of play model that breaks the match into contested phases, transitions, organized possession and set pieces, and then down further from there into things like buildup, progression and fast breaks. We’ve released some of our stats at a team level that tell you which teams play most often and most effectively in these different phases and how their tendencies within them translate to broader team styles of play. We put it all in a web app where you can download and play with the data yourself.
We’re actively developing and improving all of these models. As we develop the mobile app, we’ll be releasing more stats with articles explaining what they are and what goes into them on our substack, because we believe it’s important to make the stats we present you with as transparent as we can. Being able to understand and trust them means you can use them to argue with your friends about your opinions on social media or make cool charts that show your own analysis of this data.
Just as importantly, we want your input as we continue to develop all of this. We want to hear what you like and don’t like. Which early versions of things don’t pass a gut check and what we aren’t giving you that you wish we did. You can tag us on Bluesky and yell at us if that’s your thing, but joining our Discord is the best way to be a part of these conversations (or just talk about whatever match you’re watching that day).
futi is the best way John and I know how to give back to the fan community we started in and help move soccer analytics forward. We’d love for you to be a part of it.