ASA Podcast XXIX: The International Break And All That Garbage

Hey, guys... we're back with better audio quality this week. A big thanks to Drew who put things together last week in my place, and despite technology failing apart around them, Drew and Matty were able to put together a great podcast. This week on the show we tackle MLS playoffs, CONCACAF and USMNT dealings and then some Transfers/Loan rumors that are out there. It's a longer podcast, but it'd been a few weeks since we all got together, and things just rolled. I hope you enjoy it.

[audio http://americansocceranalysis.files.wordpress.com/2013/11/29-asa-podcast-xxix_-the-internation.mp3]

MVP Discussion: Soccer shares baseball's issues

In the wake of Major League Baseball awarding its MVP to Miguel Cabrera, debates over what "valuable" means have once again flared up. Though soccer and baseball are two incredibly different sports, I think we can apply some of the same logic to both MVP discussions. Major League Soccer has about two weeks remaining before its MVP award is handed out, and we will no doubt encounter many of the same controversies in the soccer blogosphere that appear in baseball every season. The MVP controversy usually begins with what "valuable" means. I think there's little doubt in most people's minds that "valuable" and "skilled" are correlated. The main controversy is how correlated. To some, asking who was the best player in Major League Soccer in 2013 would be equivalent to asking who was the most valuable to his team. To others, there would be some key distinctions, the most common of which is that MVPs must come from teams that reach the post season.

In retort to that thinking, some very astute commenters in a Fangraphs.com forum offered up these nuggets. Hendu for Kutch made the analogy:

"We each want to buy something that costs $1. I’ve got a quarter, 8 nickels, and 10 pennies. My 'team' of coins is worth 75 cents and falls short of being able to buy the item. You have one dime and 18 nickels. Your 'team' is worth $1, and you successfully buy the item. Is your dime more valuable than my quarter simply because it led to a successful item purchase?"

Mike Trout = quarter and Miguel Cabrera = dime, for those of you not so into baseball, and the question is a good one. Few would argue that the dime is more valuable than the quarter just because it found itself in a position to help buy that scrumptious Twix.

In reply to someone arguing that the quarter had no value because it didn't lead to the purchase of a desired item, BIP and ndavis910 then chimed in:

"Except not everything costs $1, and at any rate, you would always choose the quarter over the dime when accumulating money for a purchase."

"Especially when you don’t know the cost of the items until you get to the store. In baseball, a team cannot be sure how many wins it will take to reach the playoffs until the last day of the season. In your example, the quarter is the most valuable piece regardless of whether or not the item cost $1 or $0.75."

When thinking about attributing value to players like Marco Di Vaio, Mike Magee, Camilo Sanvezzo, Robbie Keane and company, why should it matter where their teams finished? If one believes that Magee, for instance, is the best player in MLS, then does it matter if he took his team from 39 points to 49, versus from 40 points to 50? Either way, it's still ten points of value in the standings. When Magee was traded to Chicago, neither Chicago nor Magee knew that the Fire was going to need 50 points to make the playoffs. The fact that they got just 49 points shouldn't negate any of Magee's value.

If you say that it matters because MLS clubs get real value from extra playoff games, then think about this. Playoff cutoff lines are quite arbitrary. If MLS allowed only the top two teams in from each conference---not completely unreasonable for a league of just 19 teams---then none of the players mentioned above would be considered under this playoffs requirement. Playoffs represent an arbitrary bar that the players competing for the award don't get to set, and while reaching the playoffs does bring the team measurable revenue and value, basing an award on something outside an individual's control would, in my opinion, strip the award of its intended meaning and purpose.

Now let's anticipate the logical counterargument---that players pick up their games in playoff races and play well when it matters most.

For a moment, let's ignore the fact that little evidence has ever been found in professional sports that players can turn it on and turn it off as needed. This past season, Magee scored seven goals in Chicago's final nine games, a stretch in which the team averaged 1.56 points per match. That represents a pace that would have gotten the Fire into the playoffs if maintained for the entire season. Di Vaio scored five goals in his last 10 games---I even included that tenth-to-last game in which he scored two goals---in a stretch where Montreal tallied just 0.7 points per match, limping into the playoffs on a tie-breaker with Chicago. Just because one team makes the playoffs doesn't mean its best player was at his peak when it mattered. Goals are, admittedly, a narrow-minded way to measure a striker's value, but I think the point is still valid.

For me, the Magee-Di Vaio example above may have been no more than an exercise in confirmation bias. I chose to see what I already believed. However, the logic behind the belief that team standings shouldn't matter to players' MVP merits is still good stuff, and transcends any biased example I can come up with.

If we're ready to agree that that the MVP award should essentially be given to the best overall player, then we still have a tall task ahead of us. How do we measure skill on the soccer field? That is the 64,000-dollar question, and one we hope to help tackle here at ASA some day. But perhaps it's not so crazy to think that a guy like Federico Higuain is deserving of the MVP award. If you scoff at that notion, you likely do so because you've been trained to think about MVP awards in a certain way.

We're all about re-thinking things around here.

ASA Podcast XXIX: Of flip phones, semifinals, USMNT, pass completions, and burrito folding.

This week we talked about how cool and hip we are, followed by a discussion of the first legs of the MLS Cup semifinals. We continued with potential changes to MLS' CONCACAF Champions League births, Klinsmann's 23 man roster for the upcoming friendlies versus Scotland and Austria, and the top 50 players in MLS by pass completion percentage. We concluded with a discussion of burritos and proper burrito folding practices. [audio http://americansocceranalysis.files.wordpress.com/2013/11/episode-xxix.mp3]

Game of the Week: Real Salt Lake vs. Portland Timbers

A look at the 4-2 scoreline may give the appearance that Real Salt Lake shredded Portland's defense in an wide-open free-for-all. On the contrary, two of RSL's goals came directly from corner kicks, while a third was courtesy of the generosity and stone touch of Futty Danso (who was also marking Schuler on RSL's first goal). Credit should of course go to Salt Lake for piling on the pressure, but what really characterized Real Salt Lake's play on Sunday was not a free-flowing attack, but rather excellent team defense and a commitment to attacking via the flanks. No Space for Portland

Throughout the match, Real Salt Lake's defensive shape remained resolute, and never came close to being broken down by Portland's 4-3-3. Kyle Beckerman was, as ever, the linchpin of RSL's midfield, leading the team in aerial duels won with 6 (of 7) and tackles (4, tied with Tony Beltran), and contributing 6 clearances. However, the incessant pressure of Sebastian Velazquez and Luis Gil—who it should be noted are 19 and 22 years old, respectively—along with the fullback pairing of Beltran (who led RSL in touches with 76) and Chris Wingert/Lovel Palmer, never allowed any space for Diego Valeri or Darlington Nagbe to work their magic in the midfield. Many of Portland's forays into the penalty area stemmed from Rodney Wallace collecting the ball in wide positions and sending in listless crosses (0-for-6) that were easily dealt with by Nat Borchers. Forward Ryan Johnson was kept in check all game, limited to a mere 18 touches in his 59 minutes on the field.

The entirety of Portland's productive offensive output consisted of Will Johnson's free kick goal, Piquionne's soaring headed goal, and a 77th minute shot from Alhassan after a slick dribbling spell through the heart of RSL's midfield. For the entire game, Portland had only two successful dribbles and three successful crosses in the attacking third (one of which was Jewsbury's beautiful assist).

Defending from the Front

The only change in the starting lineup for Real Salt Lake to start the game was Devon Sandoval replacing an ailing Alvaro Saborio. While few would argue that Sandoval is the better player, his kinetic style, defensive workrate, and ability to get into wide spaces provided problems for the Great Wall of Gambia.

Chalkboards of Devon Sandoval vs. Portland (left) and Alvaro Saborio vs. Los Angeles (right)

RSLvPor-11-11-Sandoval RSLvLA-11-07-Saborio

As you can see, the defense starts from the front. Sandoval pressured wide all game long, trying to disrupt Portland's rhythm in the defensive half of the field. Of Sandoval's 43 actions against Portland, only 11 (25.6%) took place in the center third of the field, compared to 15 of 28 (53.6%) for Saborio against Los Angeles. Sandoval also pressured back more than Saborio did: 8 of 43 (18.6%) actions by Sandoval took place in RSL's half of the field, compared to a meager 2 of 28 for Saborio (7.1%).

Stretching the Diamond

What really stuck out about the way that Real Salt Lake played, however, was the way that their midfield “diamond” stretched from touchline-to-touchline, with Velazquez manning the left, Gil hugging the right, and Morales drifting from side-to-side, looking for an inch of space wherever he could find it.

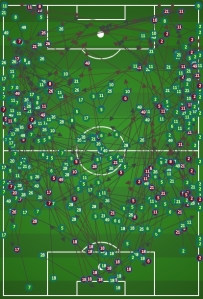
Here is a chalkboard of passes attempted by Real Salt Lake, along with the percentage of passes attempted from each section of the field:

RSLvPOR-11-11-RSLBallPossessionAreas     RSLvPOR-RSLPossessionNinthed

And here are all of the passes attempted by Portland, along with the percentage breakdown:

RSLvPOR-11-11-PORBallPossessionAreas     RSLvPOR-PORPossessionNinthed

Real Salt Lake attempted only 13.6% of their passes from the central attacking portions of the field, while 64.3% of their passes came from the wide attacking areas. Portland, by contrast, attempted 18.9% of their passes from the central areas, and 58.6% of their passes coming from the wide attacking zones.

RSL ratio of wide-attacking passes to central-attacking passes: 4.73-to-1 POR ratio of wide-attacking passes to central-attacking passes: 3.10-to-1

Real Salt Lake took their chances against Portland's flank defense rather than try to fight through Will Johnson and Diego Chara. The gambit worked well, as all eight of RSL's key passes and assists came from wide positions.

Three questions for leg 2 in Portland:

1. Will Saborio be healthy? If so, Sandoval will likely see the bench again as Findley's speed will serve as an outlet against a high-pressing, possibly desperate Timbers squad, unless...

2. Kreis opts for the 4-2-3-1? Beckerman and Yordany Alvarez were deployed in a double pivot at Los Angeles a few weeks ago, and while the results were not exactly convincing, it perhaps implies (or at least I'm inferring) that Kreis may want to take a more conservative approach on the road in the playoffs.

3. Ryan Johnson or Frederic Piquionne? Ryan Johnson has put in a workmanlike effort thus far in the playoffs, but with his playing time diminishing each game (83 min @ SEA, 69 min v SEA, 59 min @ RSL) and Piquionne finally healthy (and able to leap clear over Nat Borchers), it may be time for Piquionne to crack the starting lineup.

What Piquionne's goal means to Portland

Though our game states data set doesn't yet include all of 2013, it still includes 137 games. In those 137 games, only five home teams ever went down three goals, and all five teams lost. There were 24 games in which the home team went down two goals, with only one winner (4.2%) and five ties (20.8%). The sample of two-goal games perhaps gives a little hope to the Timbers, but these small sample sizes lend themselves to large margins of error. It is also important to note that teams that go down two goals at home tend to be bad teams---like Chivas USA, which litters that particular data set. None of the five teams that ever went down three goals at home made the playoffs this year. Only seven of the 24 teams to go down two goals at home made it to the playoffs. Portland is a good team. Depending on your model of preference, the Timbers are somewhere in the top eight. So even if those probabilities up there hypothetically had small margins of error, they still wouldn't necessarily apply to the Timbers.

Oh, and while we're talking about extra variables, in those games the teams had less time to come back. To work around these confounding variables, I consulted a couple models, and I controlled for team ability using our expected goal differential. Here's what I found.

A logistic model suggests that, for each goal of deficit early in a match, the odds of winning are reduced by a factor of  about two or three. A tie, though, would also allow Portland to play on. A home team's chances winning or tying fall from about 75 percent in a typical game that begins zero-zero, to about 25 percent being down two goals. Down three goals, and that probability plummets to less than 10 percent. But using this particular logistic regression was dangerous, as I was forced to extrapolate for situations that never happen during the regular season---starting a game from behind.

So I went to a linear model. The linear model expects Portland to win by about 0.4 goals. 15.5 percent of home teams in our model were able to perform at least 1.6 goals above expectation, what the Timbers would need to at least force a draw in regulation. Only 4.6 percent of teams performed 2.6 goals above expectation. If we just compromise between what the two models are telling us, then the Timbers probably have about a 20-percent chance to pull off a draw in regulation. That probability would have been closer to five percent had Piquionne not finished a beautiful header in stoppage time.

The Predictive Power of Shot Locations Data

Two articles in particular inspired me this past week---one by Steve Fenn at the Shin Guardian, and the other by Mark Taylor at The Power of Goals. Steve showed us that, during the 2013 season, the expected goal differentials (xGD) derived from the shot locations data were better than any other statistics available at predicting outcomes in the second half of the season. It can be argued that statistics that are predictive are also stable, indicating underlying skill rather than luck or randomness. Mark came along and showed that the individual zones themselves behave differently. For example, Mark's analysis suggested that conversion rates (goal scoring rates) are more skill-driven in zones one, two, and three, but more luck-driven or random in zones four, five, and six. Piecing these fine analyses together, there is reason to believe that a partially regressed version of xGD may be the most predictive. The xGD currently presented on the site regresses all teams fully back league-average finishing rates. However, one might guess that finishing rates in certain zones may be more skill, and thus predictive. Essentially, we may be losing important information by fully regressing finishing rates to league average within each zone.

I assessed the predictive power of finishing rates within each zone by splitting the season into two halves, and then looking at the correlation between finishing rates in each half for each team. The chart is below:

Zone Correlation P-value
1 0.11 65.6%
2 0.26 28.0%
3 -0.08 74.6%
4 -0.41 8.2%
5 -0.33 17.3%
6 -0.14 58.5%

Wow. This surprised me when I saw it. There are no statistically significant correlations---especially when the issue of multiple testing is considered---and some of the suggested correlations are actually negative. Without more seasons of data (they're coming, I promise), my best guess is that finishing rates within each zone are pretty much randomly driven in MLS over 17 games. Thus full regression might be the best way to go in the first half of the season. But just in case...

I grouped zones one, two, and three into the "close-to-the-goal" group, and zones four, five, and six into the "far-from-the-goal" group. The results:

Zone Correlation P-value
Close 0.23 34.5%
Far -0.47 4.1%

Okay, well this is interesting. Yes, the multiple testing problem still exists, but let's assume for a second there actually is a moderate negative correlation for finishing rates in the "far zone." Maybe the scouting report gets out by mid-season, and defenses close out faster on good shooters from distance? Or something else? Or this is all a type-I error---I'm still skeptical of that negative correlation.

Without doing that whole song and dance for finishing rates against, I will say that the results were similar. So full regression on finishing rates for now, more research with more data later!

But now, piggybacking onto what Mark found, there does seem to be skill-based differences in how many total goals are scored by zone. In other words, some teams are designed to thrive off of a few chances from higher-scoring zones, while others perhaps are more willing to go for quantity over quality. The last thing I want to check is whether or not the expected goal differentials separated by zone contain more predictive information than when lumped together.

Like some of Mark's work implied, I found that our expected goal differentials inside the box are very predictive of a team's actual second-half goal differentials inside the box---the correlation coefficient was 0.672, better than simple goal differential which registered a correlation of 0.546. This means that perhaps the expected goal differentials from zones one, two, and three should get more weight in a prediction formula. Additionally, having a better goal differential outside the box, specifically in zones five and six, is probably not a good thing. That would just mean that a team is taking too many shots from poor scoring zones. In the end, I went with a model that used attempt difference from each zone, and here's the best model I found.*

Zone Coefficient P-value
(Intercept) -0.61 0.98
Zones 1, 3, 4 1.66 0.29
Zone 2 6.35 0.01
Zones 5, 6 -1.11 0.41

*Extremely similar results to using expected goal differential, since xGD within each zone is a linear function of attempts.

The R-squared for this model was 0.708, beating out the model that just used overall expected goal differential (0.650). The zone that stabilized fastest was zone two, which makes sense since about a third of all attempts come from zone two. Bigger sample sizes help with stabilization. For those curious, the inputs here were attempt differences per game over the first seventeen games, and the response output is predicted total goal differential in the second half of the season.

Not that there is a closed-the-door conclusion to this research, but I would suggest that each zone contains unique information, and separating those zones out some could strengthen predictions by a measurable amount. I would also suggest that breaking shots down by angle and distance, and then kicked and headed, would be even better. We all have our fantasies.

ASA Podcast XXVIII: The One where we talk MLS Conference Semi-finals

Last night we talked about the eight teams still in the playoffs in a round-robin-style discussion, and then followed up the playoff talk with a general discussion about numbers. Specifically we talked about often-quoted and used statistics that don't really hold any value. I also pretty much alienate all lawyers who listen to the podcast. Enjoy! [audio http://americansocceranalysis.files.wordpress.com/2013/11/asa-episode-xxviii.mp3]

Jamison Olave's Value to New York

There was quite a popular tweet from a canine about New York's improved play this season when Jamison Olave was playing. https://twitter.com/GothamistDan/status/397398611438608384

There are obviously confounding factors at play here, not to mention small sample sizes. There were only seven matches this season in which Olave did not start, and eight in which he played 45 minutes or less. Any data obtained from these games is going to be subject to A) small sample sizes, B) lots of variance in the response variable (goals or wins), and C) no control for quality of opponent or location of the match.

To deal with the small sample size/variance problem, I'm going to use our now semi-famous data set on shot location origins. Steven Fenn kindly showed the world their predictive value, and to me that means that expected goals for and against are the most stable stat available for such an analysis. To control for New York's opponents---when Olave was both in and out of the starting XI---I have included each of New York's opponent's expected goals data in the linear regression, while also accounting for whether or not the Red Bulls were at home. Blah, blah, blah, to the results!

Looking at the defensive side, New York allowed shots leading to 0.24 fewer expected goals against in games that Olave started. That seems to indicate New York's need for Olave, but the p-value was a kind-of-high 26 percent. Overall, New York's expected goal differential climbed 0.19 goals in those games that Olave started, though again, the p-value was quite high at 46 percent.*

Now for your shitty conclusion, courtesy of shitty p-values: Olave's influence on New York's level of play this season was questionable. There is some suggestion that he helped reduce goal-scoring against, however there is a reasonable chance that that difference was due to other, not-measured-here variables. What I am more comfortable claiming is that he does not make a 0.86-goal difference on the defensive side.

The point is this. New York's shot creation and goal scoring ability, for and against, are more a function of whether or not the Red Bulls are home, and against whom they are playing. Not as much whether Olave starts. Obviously putting an inferior player into the starting XI isn't going to help New York out. But, as I always question, do we really know how to value soccer players at all? Maybe Olave just doesn't make that much of a difference. After all, he's only one of eleven players.

*For those curious, the number of minutes Olave played was a worse predictor variable than the simple binary variable of whether or not he started. Controlling for the strength of opponent was necessary since perhaps Mr. Petke was more likely to sit Olave against a worse opponent at home, or something like that.

A Closer Look At The MLS MVP Race

Editor's Note: This was the first of many articles by Jacob, who can be found at @MLSAtheist on twitter. It's quite amazing, and I encourage you to read it. He's one of several wonderful writers that we are adding to the site in the coming weeks. Please give him a follow and good feedback, as you have for Drew, Matty, and me. This is all part of putting together newer, better site content.

Not long ago, I saw a piece on ESPN handicapping the MLS MVP race, featuring the one and only Alexi Lalas. Say what you will about Lalas, but what he said on this topic got my mind jogging. The season was still a couple weeks from being complete, but the Redhead tipped Marco Di Vaio over Mike Magee for the award, based mostly on his higher goal total. He explained that goals are the rarest and most important event in soccer, so the guy who scores the most (and in the most games, giving his team a better chance to win) is the best candidate for the award. But here at American Soccer Analysis, we know that just because a guy puts the final touch on a goal doesn’t necessarily make him the most valuable component of that play, let alone that season.

Anyway, Lalas had a point: goals are important. And whether you like it or not, goal scorers and creators are always going to be the award winners in this sport. But still, looking solely at goal totals seems far too simplistic when handicapping the race for MVP. So, as we are wont to do around here, I tried to delve a little deeper.

First of all, you can contribute to goals without being the one to actually kick it into the net. I’ll do the most obvious thing possible, and just add assists to the equation. Additionally, not every player gets to play the same amount. Especially in MLS, where some of the top players are constantly called away for international duty, some MVP candidates only play in two-thirds of his team’s games. But if the premise here is that the award is intended to go to the most prolific goal creator, we should really look at how many goals they create when they’re actually on the field.

Here are the ten top MVP candidates (I know they probably aren’t all that deserving, but ten is a good round number and I’m a little OCD), and how many goals they’ve created, as well as their per 90 minute rate.

Player

Goals

Assists

G+A Per 90

M. Magee

21

4

.806

M. Di Vaio

20

2

.698

R. Keane

16

11

1.22

J. Morales

8

10

.710

Camilo

22

6

1.04

D. Valeri

10

13

.909

F. Higuain

11

9

.694

D. Fagundez

13

7

.742

T. Cahill

11

5

.642

G. Zusi

6

8

.535

It’s no surprise to see Keane and Camilo leading the way with over one per game, as they have the highest sum of goals and assists, and Keane did his work in fairly limited minutes. But again, goals and assists are a little too superficial for us here at ASA. After all, some goals are the fault of terrible defending, goalkeeping, or just some really fortunate bounces; instead it’s preferred to look at chance creation. If a player is consistently creating chances, it’s nearly inevitable that it should lead to more goals. Now rather than just the shots that actually end up in the net, we’ll run the numbers regarding shots, as well as passes that lead to shots (key passes) for the same players:

Player

Shots

Key Passes

Shots Created Per 90

M. Magee*

114

65

5.77

M. Di Vaio

89

25

3.62

R. Keane

54

53

4.86

J. Morales

33

94

5.01

Camilo

95

37

4.91

D. Valeri

55

59

4.51

F. Higuain

69

115

6.39

D. Fagundez

43

27

2.60

T. Cahill

47

19

2.65

G. Zusi

41

75

4.43

This time we’ve got a couple of different leaders, as Federico Higuain and Mike Magee take the lead thanks to their trigger-happy styles. Higuain’s incredible number of key passes, despite playing for a middling Crew team, should raise some eyebrows---the dude’s an absolutely fantastic attacker.

Still, I have an issue with just looking at shots created. After all, we know not all shots are created equal. Without looking up the shot location data of every one of the shots in the above table, I think there’s still a way to improve the statistics: add in a factor of accuracy.

For Higuain, creating over six shots a game is terrific. But from watching a lot of Columbus games, I can tell you that plenty of those shots were low percentage bombs from 30 yards out, and plenty of others were taken by other fairly inept Crew attackers. To try to factor this in, I’d like to look at how many shots on target each player creates - the ones that actually have a chance at becoming goals. While shots on goal stats for individual players are easy to find, it’s tougher to decipher when key passes lead to shots that test keepers rather than boots into the stands. To compensate, I used each player’s team percentage of shots on target to estimate how many key passes turned into shots on goal, leading to the final following table:

Player

Shots on Goal

Key Passes

Team Shot%

SoG Created Per 90

M. Magee*

50

65

48% / 51%

2.68

M. Di Vaio

56

25

54%

2.21

R. Keane

31

53

48%

2.56

J. Morales

19

94

52%

2.68

Camilo

56

37

49%

2.76

D. Valeri

31

59

49%

2.36

F. Higuain

36

115

43%

2.96

D. Fagundez

30

27

50%

1.57

T. Cahill

22

19

48%

1.25

G. Zusi

21

75

42%

2.00

There we have it. My endorsement for MVP this season, based on a combination of Alexi Lalas’ inspiration and my own twisted statistical mind, is Federico Higuain of the 16th-best team in the league, the Columbus Crew.

Just kidding, guys! Obviously the MVP debate should take more into account than who creates shots on goal. Defense, leadership, your team actually winning---all of these things should and do matter. But still, I think this was an interesting exercise and hopefully opened at least one set of eyes to how prolific Higuain is.

Finally, a few thoughts/takeaways in bullet form:

  • Higuain was held back by his team’s terrible shooting accuracy, but not as much as Graham Zusi. Now I understand why analytic folks like Sporting Kansas City’s chance creation so much, yet the team hasn’t always seen the results.
  • Diego Fagundez is incredibly selective about his shooting - almost 70% of his shots hit the target.
  • Javi Morales doesn’t shoot much for being so prolific at creating others shots. Reminds me of this post by Tempo Free Soccer---really interesting as far as categorizing attackers as shooters vs. providers.

*Since Magee was traded mid-season, his season total stats were harder to find. While I used Squawka for everyone else’s stats, I ended up having to tally Magee’s game-by-game stats from Who Scored. It’s possible that the two sites have different standards for what constitutes a shot or key pass, and that could’ve skewed the data for Magee. I’m not sure any of them look too far out of whack that I’m too suspicious, but it’s possible so I thought it should be noted.

Rosales, not Dempsey, is the clear choice for Seattle's set-piece crosses

In Seattle’s 2-1 loss to Portland on Saturday, Clint Dempsey took all of the Sounders’ attacking set-pieces in the first half. He was impressive with his free kick shots on goal, clipping the crossbar and forcing Donovan Ricketts into multiple saves. But his corner kicks left much to be desired. Mauro Rosales subbed on in the 63rd minute and took the remainder of the set-piece crosses and created more chances. With Lamar Neagle suspended for yellow card accumulation and Seattle needing goals in leg two, Rosales seems likely to start. Requisite warning about small sample sizes aside, based off of the results in leg one, the data suggest Sigi Schmidt would be wise to let Rosales take over set-piece crossing duties in the second leg.

Here's how Dempsey’s nine corners and one free kick cross went in leg one:

DempseyLeg1FKs

3rd minute corner: To the near post, cleared by Diego Chara 6th corner: Near post, cleared by Will Johnson 20th corner: Near post, cleared by Will Johnson 25th corner: Near post, cleared by Chara 32nd corner: Near post, cleared by Chara 38th corner: Top of the six yard box, cleared by Pa-Moudou Kah 38th corner: Top of six, cleared by Kah 39th free kick: Cross from 18 yards out on the wing to the top of the six, cleared by Futty Danso 45th corner: Near post, punched clear by Ricketts

In the second half, Rosales took all three Seattle corners and two free kick crosses:

RosalesLeg1FKs

68th minute corner: To the penalty spot, shot by Djimi Traore, saved by Ricketts 69th corner: Top of six, Headed cross by Dempsey  blocked by Zemanski and eventually caught by Ricketts 82nd free kick: Cross from 38 yards in the center to the penalty spot, cleared by Danso 86th free kick: Cross from 28 yards on the wing to the edge of the penalty box, headed by Shalrie Joseph across the box 87th corner: Penalty spot, Headed shot by Dempsey off of the crossbar and out

In summary: Dempsey had 10 set-piece crosses, none of which reached a Seattle teammate. Rosales had five set-piece crosses, four of which found a teammate in the box, and three of which led to shots.

As you can tell, it was a tale of two halves. In the first, Dempsey’s crosses rarely cleared the first defender, and none found another Sounders player. In the second half, four of Rosales’ five crosses created chances, two off of the head of Dempsey himself.

If Seattle is going to win at Jeld-Wen Field on Thursday, they’ll need to do better with their crosses. Based on their chances in game one, it looks to be in the Sounders' best interest to allow Rosales to take the free kick crosses in game two. Not only did his crosses create better chances than Dempsey in game one, but Deuce seems to be more dangerous getting on the end of crosses than he is at taking them.