2015 ASA Preview: Colorado Rapids

By Harrison Crow (@harrison_crow)

*xG = expected goals, xA = expected assists, xGD = expected goal differential. For more information see our xGoals by Team page.

By Harrison Crow (@harrison_crow)

Looking back on a season and attempting to define it with terms as “successful,” “unsuccessful” or even “failure” is tricky business considering the fine lines between the terms, the few number of points that separate one definition from another and the amount of luck that influences results.

To a certain extent, all these terms apply to the Colorado Rapids' 2014 season.

Rapids ended last season with 32 points, good for 8th place in the Western Conference (second to last) and even finished behind defunct perennial catastrophe Chivas USA. Still, I’m not convinced last year was a “failure”. Obviously, ending a season by losing 12 of your last 14 games is a miserable end. The problem with this narrative that is that prior to their slide the Rapids were in the thick of a playoff spot and even a dark horse to steal RSL's token third seed.

Colorado's last win of the season came on July 25th and put them at 30 points in 20 matches, good for 1.5 points a game. Had the Rapids kept up with that pace through the remainder of the season, it's likely that they would have had at least the 5th seed in the MLS playoffs. Indeed, they also had an outside shot at that third place seed with four of their 12 loses coming at the hands of rivals Real Salt Lake and FC Dallas, two clubs that finished ahead of them in the playoff race.

The Coach

Second-year coach and organization icon Pablo Mastroeni's first year was a bit of a rough go for a lot of reasons. The expectations that were placed on Mastroeni from the start was likely a bit unfair to him. After a season of being team captain under Óscar Pareja, many believed he would be a like-for-like replacement.

But when we remember the years of time Mastroeni spent around the likes of Bob Bradley, Bruce Arena and of course Gary Smith, a different style comes to mind. These influences and his defensive mindset pulled the throttle back on a young run-and-gun club and instilled a more disciplined team that went from 10th in fouls committed to a team that committed the fewest in all of MLS.

Mastroeni also ran into a complex set of problems the regression of Clint Irwin, the second year slump of Chris Klute, a litany of injuries, and poor finishing that plagued their strikers, leading to the club scoring only 12 goals in their last 14 matches. These combined issues are all reasons for why the Rapids trotted out six different formations over 34 MLS matches.

Primarily deploying a two striker system in 22 out of 34 matches there was also some room for some flexibility and rumor has it Mastroeni is playing with a few new ideas. I think the gist of any positional arrangement implemented will bring the club to being true a possession-centric club with emphasis on defense and limiting oppontents' shots.

The Goalkeepers

Going into the 2014 season there was no doubt Clint Irwin was the man between the posts for Colorado. Unfortunately, Irwin was injured early and then never really seemed to recover his form after that time off. Unfortunately, Colorado didn't have much in the way of a back-up plan and Joe Nasco was forced into the line of duty. Things were never were the same after that.

This season Colorado takes advantage of the Philadelphia Union's problem of too many starting keepers and adds Zach MacMath to the equation. Our numbers haven't loved MacMath, but he's considered him average, which is still relatively good. Looking at the 423 shots at MacMath, he's allowed 136 goals, almost three more than our expected goal metrics believe he ought to have (133.28, total expected goals against).

Over four seasons allowing three additional goals isn't necessarily a lot or considered bad. As an example, last year our metrics believed that Clint Irwin allowed almost 11 more goals than he should have. However, that's not to say he's a bad keeper. Player metrics swing pretty wildly from year-to-year and while we can see the influence they have on the team for good or bad one season, it's not necessarily a barometer for talent. MacMath is a perfect example of needing more data to round out an impression of who he is and still, with four years of data, he is still evolving and getting better. It seems likely that Irwing and MacMath will compete for the starting job all year, and maybe that competition drives them each to get better. Maybe.
 

The Defenders

Press pause on my centerback thoughts and let's get to something that's near and dear to my heart, the trade of Chris Klute. He didn't have a great season in 2014, but he was still compensated far less (only $80k) than what many of his peers (roughly $140-180K) were at the same position. The club says they earned a nice chunk of allocation money from the deal so maybe it was good business, but quality MLS fullbacks are hard to come by. To properly evaluate the move we're going to need more than a single year.

The fullback situation short of Klute is one that has a lot of good answers for the Rapids; Michael Harrington comes from Portland, the booming left boot of Marc Burch is still present and Marlon Hairston has had some fun moments early in preseason. Outside of those, questions abound.

Shane O'Neil could end up as the solution in a fullback but most seem to see him as a central defender. A move isn't preposterous, but then who takes his place in central defense? Do they throw first round draftee Axel Sjöberg? There are many question marks remaining.

The only thing that isn't in question on this back defensive line is Drew Moor. Moor could probably sit down with Chad Marshall, have some beers and talk about being consistently snubbed by USMNT coaches. It also might help Matt Hedges to have a collective pool of support to tap into over the years.

Moor was considered one top centerbacks in MLS by both Squawka and WhoScored metrics last season. Even understanding that they both have their own little quirks and subtle nuances, it still provides some context to how good the numbers think he is, putting him in the same company as Aurélien Collin, Omar Gonzalez and Marshall. The only thing about Moor is that he'll miss some of the start of the season due to recovering from an ACL. It's not known when he'll return, but until he does it's going to complicate an already volatile situation.

The biggest challenge Colorado right now is undoubtedly it's defensive situation; the fact that a tactically conservative coach has so many question marks on his backline is worrisome. If my writing doesn't convey the disarrayed state this defense is in, maybe this will; James Riley, who supposedly retired this off-season, showed up on the bench in a pre-season match last weekend.

The Midfielders

The Rapids have done a good job at revamping their central midfield. After mutually parting ways with Jose Mari and his elegant deep play making abilities, then declining the option on Nick LaBrocca, the team needed to add talent and did so wonderfully by acquiring Marcelo Sarvas and Sam Cronin through a couple of trades.

Sarvas was a midfield staple for so many of those LA Galaxy Championships and despite his age looks to be the prize piece of the Rapids midfield this season for Mastroeni. But he won't be alone, as the Rapids swung another trade a few days later to nab Sam Cronin in what I presume is to pair the two together. Both Cronin and Sarvas are big at duels won and while they don't probably play traditional roles as “destroyer” or “creator” they both play solid box-to-box roles that should be upgrades at the position.

Looking out wide, one of my favorite things is when clubs take advantage of Youth Designated Player. Colorado added 21-year old left midfielder Juan Ramirez from Argentinos Juniors. Only the second ever Designated Player in club history, the question is how much playing time will be afforded to him.

The club still has Vincente Sanchez, who was featured out wide in all but four of his 12 appearances and is adored by our expected goal metrics for his near four shots per 90 he creates and where on the field they come from.

Additionally, the club has budding star Dillon Serna who, despite only turning 21 next month, has shown to be a fun wide player with his tricks, moves, and goals. The Rapids then also grabbed 23-year old midfielder Lucas Pittinari, also from Argentina. Oh, there is also Gabby Torres.

Break out 2013 Gold Cup star Gabriel Torres is still looking to find that form that once suggested that he'd be special, and this is a bit of a do or die season for him in Colorado. His performances last year make him out to be something of an average goal creator, but average doesn't seem to be what anyone in Colorado is looking for at the moment.

Once we all accepted the idea that Dillon Powers would eventually be Diego Valeri or Javier Morales, a near-elite attacking midfielder. Now that is nowhere particularly close to being true. It's partly the “he's got the body of a soccer player” reputation that goes on with him.

Yes, Power's is technically superior soccer player. Yes, he's got a supreme amount of physical gifts that are needed to succeed at the international level. But statistically he doesn't have it. He's combined for a total of 25 goals in roughly 4800 minutes. Our model has him at 17. Diego Valeri has 34 in roughly the same amount of time.

Some say he's a creator and he's not going to score a lot of goals. His shot to key pass ratio is .472 validating the thought he's going to take that pass more frequently than he's going to shoot the ball. But his shot leverage (the average location where he takes a shot) is just a touch above 10%, meaning that when he does shoot it's not really good anyways.

I'm not sinning against the US/MLS prospects gods or whatever. Powers has a lot of potential and all the right things are there, but they aren't clicking yet and they may not ever. That's okay. He's still a usable player for what the Rapids need. I wouldn't throw a tantrum if he's moved back into a deep central midfield position, where statistically he wins the ball at a very good rate.

For all the question marks that are in the defense for Colorado, there is almost a reverse question mark thing going on here. There are probably eight suitable starting candidates in the midfield with at very most five positions to fill.

It's a good problem to have, but you have to question why they are still adding to the depth and not really addressing the true issue of the roster.
 

The Strikers

Deshorn Brown or GTFO.

I'm serious. The amount of people that are talking about him slumping or not passing enough makes me feel like I'm taking crazy pills. Using a filter of a minimum of 2,500 minutes, Brown comes in 12th for players—let me reiterate that again—PLAYERS (meaning midfielder or strikers) in total expected goals per 90 minutes (p90). He's 14th overall in creating shots p90. He's basically Edson Buddle, only 24 and actually really good.

Brown gets the brunt of it from fans and pundits alike because he hasn't been good at finishing and, in fairness, you've got to score goals for them to count and influence games—I'm not such a nerd that the concept escapes me. But last year was such a weird and improbable season that I can't help but bet on him to return and return strong.

There are other available choices available up top but really I would hope that with adding Pádraig Smith they'd be smart enough just to stick with the young Jamaican at striker. Potentially, and possibly likely, Brown could teamed with either Sanchez or Torres. 20 year-old, Charles Eloundou is also a possible pairing option for Brown. He has showed promise on the training ground and played well enough over 400 minutes that supporters are interested in seeing him get minutes.

The Summary

The Rapids seem like they're on the way to getting fixed. But it won't happen without some bumps along the way. I think this season they'll score goals, but their defense isn't encouraging and their midfield is rather scatter-brained.

If Deshorn Brown has as big of a season as I think he is capable of, it may be difficult to hold onto him beyond the January 2016 transfer window. I can think of at least one or two English Championship clubs that might be interested in his talents, and I'm not sold that Colorado values all that he brings to the table.

Last season, Colorado had some up and down results. Their overall season stats aren't good and it's a legitimate question as to whether they end up finishing in last place this season. They're a team that still seems to be seeking their identity from a tactical and personnel perspective. There is a lot of talent, but without it being molded and then pointed in the right direction I'm afraid that they'll become aimless and have another season where they underachieve.

The height of their potential is probably the 4th seed in the Western Conference, but everything would have to break right for that to occur. I'm much more cynical about their organizational direction at the moment and I tend to believe that between tinkering and pressure at the early stages of the season could leave things in a house of cards situation. I'm apt to believe they are closer to a last place club than a playoff team.

2015 ASA Preview: Chicago Fire

*xG = expected goals, xA = expected assists, xGD = expected goal differential. For more information see our xGoals by Team page.

By Mike Fotopoulos (@irishoutsider)

Frank Yallop is the sixth manager of the Chicago Fire in the past nine seasons. When you stop and look at that, it should be no surprise that the club has struggled to settle on a strategic plan, unable to rebuild the roster post-Cuauhtemoc Blanco. Most “designated player” signings have required fans to make air-quote gestures when referring to “impact players” like Federico Puppo, Sherjill MacDonald, and Juan Luis Anangono. Front office turnover and lack of strategic vision have turned the most recent versions of the Chicago Fire into the MLS’ “Three Amigos.” Sure, they put on the costumes and dance around, but those other guys are using real bullets.

While it is still officially preseason, I will be optimistic and say that is about to change. It became clear in 2014 that Yallop and technical director Brian Bliss were going to have to fully rebuild the Fire, and there were likely few players, and more importantly few contracts, that would make the cut in 2015. The two have put together one of the busiest winters in memory, implying that this season is where they start to put their mark on the club. Indications have been they would like to structure the roster around a 4-3-3 formation, and the bulk of the new additions appear to confirm this. Having an actual plan and sticking to it are reason enough to get excited.

On offense, this is a team that has struggled to consistently threaten opponents (1.2 xGF in 2014, 16th overall) and has two of its main attacking options on the shelf for the near future. Both Mike Magee and Patrick Nyarko will be coming off of injury to start the year, leaving Quincy Amarikwa as the main striker left from 2014. While Harrison and I have had lengthy discussions about his total value and upside, one thing is clear: a team cannot survive on #QuincyTime alone. The Fire have gone out and spent “DP Money” (yes, still air quotes for now) on David Accam and Kennedy Igboananike, two young attackers from the Allsvenskan. The Swedish 1st Division is a better comparison to MLS than the likes of LDU Quito, so both will be expected to add value right away, providing talent and depth to the wings. Guly do Prado comes in from Southampton as the likely center forward, aiming to play a more traditional target role at least until Magee returns.

In midfield, Shaun Maloney is now officially the Next Big Thing. He will be taking the number 10 from Nowak and Blanco and hoping to be the dynamic playmaker the Fire have been missing for the last 5 seasons. Under the radar is the addition of Michael Stephens, a local boy by way of Stabaek, and I, for one, hope he can be Mix Diskerud without the poetry or the price tag. Both Maloney and Stephens add offensive potential to a midfield that has traditionally been more defensive than creative. The defensive midfield roles have been relegated to some combination of Alex, Matt Watson, and Chris Ritter, and it appears the Fire are still looking for an upgrade if at all possible. Jeff Larentowicz would be fine here at his natural position, however the current plan is to continue his move to CB.

The Fire defense needs all the help it can get. While Sean Johnson is a fine young goalkeeper, he hasn’t been able to work miracles behind shaky backlines. Larentowicz adds experience and leadership to the backline and will likely partner with newly signed 31-year-old Adailton from Bahia. The plan is to surround the two veterans with enough young talent and hope a decent backline presents itself. Joevin Jones, Eric Gehrig, Patrick Doody, and Matt Polster join Greg Cochrane and Lovel Palmer, a group that has little experience playing together. They will have to find their feet quickly, even if the offseason seems to be geared towards bombarding on offense and hoping for the best.

Depth-wise, it is usually damning with faint praise to say this is the deepest Fire team in years. However, it might actually be true this season. MLS fans on Twitter have been pulling their hair out trying to find a role for Harry Shipp on this roster. I’m of the opinion the season is a marathon, and there will be plenty of minutes to go around. Shipp is going to get plenty of playing time to start the season and having a would-be Rookie of the Year as your 1st sub is not a terrible problem to have. The discussion itself confirms the fact that the Fire have made enough upgrades to keep most of the 2014 team on the outside looking in. This plays directly into Yallop and Bliss’ plans, creating competition for positions outside of defense, and maybe, just maybe, some honest-to-goodness rotation opportunities. At best it is a complete rebuild, at worst it is the same old Fire, flipping over the roster and doing the dance for another year.

Most importantly, however, is that this plan was fully designed and implemented in a single offseason. There should be less reliance now on the summer transfer window to salvage a playoff run. Almost half of the roster and potentially the majority of the new starting XI have been signed this winter, leaving little doubt how the technical staff has planned for 2015. If a foundation has been built this offseason it will put the club on a path it has not had after wandering for several years.

2015 ASA Preview: Montreal Impact

*xG = expected goals, xA = expected assists, xGD = expected goal differential. For more information see our xGoals by Team page.

By Harrison Crow (@harrison_crow)

Last year was a long one for the Impact organization and their fans.

This off-season seemed, at least on the surface, to do very little to inspire hope and convince the supporters that this season will be any better than the last. Following the retirement of Marco Di Vaio, leading scorer over all of the franchises' three MLS seasons, they've done little to replace the star power they once had.

Making things seemingly worse, they traded another established attacking player in Felipe Martins, who was second only to Di Vaio in every goal-scoring-related category since the team joined MLS. It was a move that seemed to further disconnect the fan base from the front office, and it further complicated an uncomfortable situation that even club President Joey Saputo has acknowledged is creating an air of despondence among the fan base.

Still, while their offseason moves have paled in comparison to the flashy signings of rivals Toronto, the Blues have quietly made some capable and complementary additions. Dilly Duka and Jack McInerney were brought in last season to join the war-forged talents of Justin Mapp and Hassoun Camara, but it's the additions to the beleaguered and aging defense that will most improve the team. However unlikely the possibility seems at this stage of pre-season, Montreal has assembled a crew that has the potential to stick around and remain relevant longer than most may think.

The Coach

Head coach Frank Klopas has not been one to utilize a traditional “go-to” formation. He dropped his propensity to use a 4-4-2 in Chicago after moving North of the border, and showcased his managerial flexibility by sending out a 4-2-3-1 last season. The choice of formation seems to be an adaptation to the personnel at his disposal. Depth at central midfield, coupled with last year’s late addition of playmaker Ignacio Piatti, suggests continued use of a 4-2-3-1 or even a mutated 4-3-3 in some way in 2015.

The Goalkeepers

The Impact dropped the pricey and declining Troy Perkins in lieu of the more affordable Eric Kronberg; a good piece of business for the club despite Kronberg losing his starting position to Andy Greenbaum in Kansas City. Kronberg seemed to be the perfect player to compete with Evan Bush, the club's long-time backup, for the starting goalkeeper job.

Bush is ranked the 12th overall among US Keepers by EverybodySoccer.com and at age 28 seems primed to finally take over the starting job at an MLS club. Three years of our Expected Goals data (2012-2014) and 89 shots show bush Bush to be an average goalkeeper, allowing 27 out of an expected 27.5 goals. This suggests a potential improvement over the 34 goals allowed of 30.51 expected by Perkins last season.

The Defenders

Most would probably say the biggest move this offseason came in the form of 23-year-old attacking full back Ambroise Oyongo, a promising young member of Cameroon’s national team. However, the biggest hesitation with Oyongo is the volume of duels won (4.0 per 90 minutes, 64th among defenders with at least 18 matches played) and the low frequency in which he won them (42% win percentage). This, coupled with his turnover ratio (0.9 per 90, 126th), raises a flag on Oyongo. He has plenty of youth and physical attributes that may offset some technical deficiencies, but he needs to solve those things to prevent them from impairing his upside.

Whether Oyongo even ends up with Montreal is still very much in the air as the legitimacy of his contract with MLS is being questioned by a team in Cameroon. This appeal seems unlikely to succeed, but could delay when Oyongo starts the season with his new club.

The real offseason jewel for my money is Laurent Ciman, a 29-year old Belgian who's tallied nine caps since 2010 and a call-up as recently as 2014. His ability as a stand-up central defender will greatly improve the backline, and he comes without the cost of a designated player contract.

Bakary Soumare is the third and last newcomer to this party that I'll mention. He arrives to his third club in three years, coming off a poor season in Chicago. Despite the rough 2014 season, he is projected to start and brings league experience and athleticism.

Oyongo, Soumare and Ciman are likely join Camara on the backline, though it’s a bit of an unknown how they will fit together with Wandrille Lefèvre and Donald Toia, who was picked up via the Chivas USA dispersal draft.

All told, this isn't the same defense you've seen the last few years in Montreal. This season it’s truly upgraded with both youth and talent that could be one of the primary roots which could grow and spring the club towards a relatively successful season.

The Midfielders

The Impact revitalized their central midfield depth this off-season by adding veteran Nigel Reo-Coker through the Re-Entry draft, and dipped their toe back into the comfortable pool of Serie A, signing Marco Donadel. Both talents look to combine with designated player Piatti to give him the defensive support and transition to create goals. Piatti’s role as the primary playmaker will determine how many goals this team creates. If he can continue his end of season form, creating shots in high leverage locations, we can likely expect him to be a success. Still, that's a tall order for team whose offense has been rather inconsistent over the years.

Out wide will feature such attacking talents as Andrés “don’t call me Chris Rolfe” Romero, the ever undervalued left foot of Justin Mapp, and the project that is still Dilly Duka. All have unique talents that will be added to the club, but how that rotation will work and who starts is still up in the air.

I also wouldn't discount Blake Smith finally seeing some daylight this season, and there's a chance Maxim Tissot is used in some capacity in the midfield. as some believe he’ll be consistently selected for the 18.

The Striker

A five-man midfield implies the use of a sole striker. It seems that choice will come down to one of either Jack McInerney or newly acquired veteran Dominic Oduro getting the nod up top.

JackMac is still only 22 has plenty of upside. But let me be honest with you for a moment, I’m a huge fan of Oduro.* There are only 13 other players that over the past four years have accumulated as many expected goals (45.31) in MLS as Oduro.

It seems strange but many like to dismiss Oduro’s and his lack of eye-catching style as an MLS 1.0 player. People on twitter say things like “he’s all physical attribute no real substance” and “he’s lightening in a bottle, you just have to hope to get lucky.”

Sure, Oduro isn’t the type of striker that is going to bring you 20 goals in a season and win you MLS Cup. He can be a starting striker on an MLS playoff team and one that will still score goals; some pretty, others not so pretty. If he gets 2,500 minutes, I’d be willing to bet he’ll score more than 10 goals, looking at a combination of past years' shot placement and average shots per 90 minutes, he is estimated to net 12 goals.

A nice give and take relationship between him and McInerney must be formed. Neither striker is perfect, so Klopas would be wise to try and use both to accentuate each other’s talents and get the most out of his players. Focus the strengths of one to exploit the weaknesses of that day's opposing defense.

Additionally, there are youngsters Romario Williams, drafted out of Central Florida third overall in the MLS draft and Anthony Jackson-Hamel to serve as depth. Because of their age and lack of experience at MLS level, plus Klopas' past reluctance to play youngsters, I expect either Williams or AJ-H to end up at the USL level with the newly minted Montreal FC.

The Summary

While scoring the third fewest goals last season didn't help get the results they needed, Montreal's expected goal numbers were only just below average last season. This provides some confidence that a few good bounces may come back their way, raising their goal scoring numbers and with it their placement in the table.

The other problem in 2014 was allowing too many shots (13.4 per 90), 5th most in MLS. This, in turn, resulted in surrendering the 4th most goals (1.68 per 90), and increasing their expected goals (1.42 per 90), good for 8th most. An improved defense should help reduce those numbers, and could even push them into contention for a playoff spot, especially since the expected goals story is better than the actual goals story.

The Impact are a bit of a hard team to evaluate. It seems equally likely this season could end in disarray with everyone losing their job, or that the team could finish in the 5th or 6th seed in an MLS playoff spot. It's not very likely they finish dead last in the East again. Some happy medium between the two seems most likely.

*Harrison is rarely honest with you for longer than a moment.

2015 ASA Preview: San Jose Earthquakes

*xG = expected goals, xA = expected assists, xGD = expected goal differential. For more information see our xGoals by Team page.

By Tom Worville (@worville)

San Jose finished bottom of the Western Conference last season and 18th overall - a very poor season by any standards. Considering they finished first in the Western Conference just two years ago (reaching the quarter-finals of both the playoffs and the open cup) this drop in form is quite remarkable. 

But, as with all new seasons there is renewed hope. Dominic Kinnear is back as head coach and San Jose have made several strong signings, reinforcing the core of the squad. They also look forward to playing in the brand new Avaya Stadium, which hosts its first game on February 28th where the Earthquakes are set to face LA Galaxy in a friendly.

Looking at the data from last season, San Jose faced the most shots per game (16.1) of all teams in both conferences. Considering the next highest was the 14.4 a game faced by FC Dallas, and the league average was 13.0 this is a very high figure. It’s evident from this data that San Jose are very open to conceding shots in games. Whether this comes down to poor positioning or defending cannot be concluded from this data - but it highlights the need to bolster the defensive side of the team.

Turning our attention to the number of shots per game, San Jose had the 4th joint lowest of all teams, averaging 11.4 shots. While this is not as bad as their shots faced last season, it does not represent much of an improvement either. It indicates the number of chances created is very low; 285 last season being the second lowest in MLS (lowest being Chivas with 216 chances created). 

To put it bluntly, San Jose were bad last year. For any decent side in any league in the world you need to restrict the number of shots that the opposition has and/or out-shoot them. San Jose did neither and their league finish reflects that. The upside is that they can probably only improve. The 2015 season is an opportunity to re-build, and effort which has begun in the offseason with a set of fairly strong roster moves.

San Jose now has three DP’s on their roster following the signing of Innocent Emeghara - adding to the incumbent duo of Chris Wondolowski and Matias Perez Garcia. Emeghara, a Swiss international, comes from Azerbaijanian side Qarabag. He joins the Quakes with a goalscoring record of roughly one goal in every three games. If he can add 10 goals to San Jose’s tally this season it would be a great return on investment for the 25 year old.

It will also be the Quakes first full season with Garcia, as he only managed to play 6 games last year after joining in the summer. It would be unwise to look at his contribution to the team in such a small sample size of games and takeaway any meaningful conclusions, but a goal, an assist and a duel win percentage of 61% are all good signs.

The other new arrivals are Leandro Barrera, Mark Sherrod, Marvell Wynne, Sanna Nyassi and Fatai Alashe, who was picked up from the 2015 Superdraft. The team lost Jason Hernandez to NYCFC in the Expansion Draft and declined the option on longtime goalkeeper Jon Busch. They traded Sam Cronin to Colorado and Yannick Djalo’s loan expired. Finally, Andy Gruenebaum decided to retire after joining San Jose from Sporting Kansas City.

From the departures, Cronin is one of the more standout names. He was with the Quakes for four seasons and played for them 140 times, scoring five goals in the process. Clearly not an attacking midfielder, Cronin predominantly plays as a defensive, box to box midfielder. His place is likely to be taken up, at least in part, by Jean-Baptiste Pierazzi. The Frenchman will be coming into his second season of American soccer with a more than capable defensive skillset. He made more tackles and interceptions than Cronin per 90 minutes, and committed fewer fouls, and received fewer yellow cards. He was tied with Cronin on 87% pass accuracy last season, but created a lot fewer chances and scored fewer goals. Evidently not an attack minded player - it will be up to Pierazzi to break up the attacks and start them from deep. 

Another important player this season is going to be Shea Salinas. The wide-man will be hoping to build on a decent year last season and potentially add a few more goals to his game. Comparing Salinas’ 2013 and 2014 seasons, he created fewer chances last year than in 2013 (2.23 vs 2.97 per 90 minutes) and scored fewer goals (0.09 vs 0.04). He also took fewer shots and made fewer assists per 90 last season compared to 2013. His pass completion rate increased from 75% to 78%, indicating he’s potentially becoming more cautious when on the ball. Hopefully, with the addition of Emeghara and a full season of Garcia in the midfield, Salinas is able to create some more chances and become more of an attacking component for his side.

Finally, I’m going to focus on San Jose’s talismanic striker Chris Wondolowski. Wondo is entering his 7th year with San Jose over two spells. He managed an excellent 14 goals in 20 games last season, building on a solid 11 in 29 the season previous. This goals p90 of 0.54 was good, but this tally represented 40% of all of San Jose’s goals last season. As much as this highlights how much of an asset he is for San Jose, you can’t help but think he’s leaned on by the team too much. If San Jose want to be a force in the Western Conference, they'll need to hope the new signings can alleviate some of the pressure. Compared to his expected goals, Wondo overscored by 2.1 goals last season. This highlights despite overscoring last season, it was only by a marginal amount. For this reason it’s unlikely that his scoring will regress at all - and I’d be very surprised to see him score under 15 goals this season if he’s fully fit. Wondo also over-assisted last season, getting 5 vs the 2.6 that the model says that he should have. 

To conclude, San Jose can’t really get as bad as last season. Fans should look forward to a strong season at their new home, with a nicely rebuilt squad and a third DP to help lift the goalscoring pressure on striker Chris Wondolowski. The departure of Sam Cronin to Colorado shouldn’t affect the team too much, as Jean Baptiste-Pierazzi is more than capable of filling the gap. Shea Salinas could also be in for a productive year, and at 28 it would be a great time to have a career season.


Finishing rate as a predictor of future performance

By Matthias Kullowatz (@mattyanselmo)

Finishing ability can loosely be described as the efficiency with which a player or team puts the ball in the back of the net. A simple finishing metric might be goals divided by shots---in other words, a shooting percentage. The finishing metric I'll use here is goals divided by expected goals, or G/xG. Soccer nerds like me have bantered about whether or not finishing is skill, and that is still a controversial topic, but what's not controversial is how finishing rates can improve prediction models. I'll show you.

Jared pumped out an article a few weeks ago about how certain types of teams are capable of overperforming their expected goals. Jared suggested that some of it may be due to style of play. Counter-attacking teams, for example, are likely to get fewer shots, but those shots are probably of higher quality. Specificially, those shots are probably taken with more time, space, and physical momentum toward the goal than the average shot---three things not currently included in our expected goals. If this is true, then it means that finishing rate (G/xG) could be a stable metric, one that predicts future success. But not because finishing is necessarily a skill, but rather because of the influence of team style on finishing.

In fact, finishing rate is a stable predictor. Below is a smoothed curve showing the correlation between expected goal differential (xGD) in the first X games and actual goal differential in the final 34 - X games. Correlation here is the square root of the R-squared value. The red curve includes only expected goals as a predictor, and the green curve additionally includes finishing rate.

Even early on in the season, we see that the addition of finishing rate into the model helps the existing expected goals to predict future goals. Technically, this graph is showing the correlations between goal differentials, so let me break it down by goals scored and goals allowed. 

The two graphs above suggest that the entire increase in predictive correlation comes from offensive finishing rate, not defensive finishing rate allowed. I think this can probably be explained by the fact that a counter-attacking team will always be a counter-attacking team, but will not always play against a counter-attacking team. I think it's similar to the reason that pitchers find it hard to control their BABIP (Batting Average of Balls in Play). They're facing a variety of opponents, and they can't control what comes back at them. (Sorry, non baseball fans.) 

Skeptics with a good feel of linear regression may point out that any time you include more explanatory variables, the R-squared must increase. Yes, that's true, but on a case-by-case basis I also noticed that the p-value on the finishing rate coefficient became consistently significant by a team's 12th game. Some out-of-sample model diagnostics also showed that the average absolute error on predicted goal differential is less when including finishing rates, which is probably even stronger support for the usage of finishing rates.

As Jared and others have already suggested, some form of finishing rate should be included in predictive models, as well as in the general evaluation of a team. I'm just a little late to the party. I like to avoid awkwardly arriving first, anyway. 

Of Minutes and Men: A story about the importance of minutes played

By Jared Young (@JaredEYoung)

A few miles south on the list of soccer statistics is a little number called minutes played. It doesn’t stand out much and feels more obligatory than anything. Of course we need to know how much a player plays. Then we go ahead and divide it by 90 because “per 90” puts all the players on the same scale. That’s better. Minutes played is used and brushed aside just as quickly. But I came to find out that minutes played might tell us something we didn’t know about the good teams and the bad. 

This story begins not with me trying to resurrect minutes played, but with me wondering how to understand the importance of a team’s depth. The first thing I wanted to do was to look at the distribution of minutes across a team. Is there a healthy level of minutes played for starters and for reserves?

To simplify the calculation I added up the total minutes played of the top eleven players on every MLS roster and divided that number by total minutes. It turns out about 75 percent of the total minutes played are accumulated by the eleven players on a team who played the most. The highest percentage in 2014 belonged to DC United (79 percent) while the lowest percentage belonged to the Colorado Rapids (68.5 percent).

It was natural to wonder, given DC United’s success and Colorado’s up and mostly down season, if this simple metric would at all predict, well, anything. The best thing to do when one wonders is look at the data.

While there is a fair amount of variability in the plot, there is a significant Rsquared for a metric that is pretty far from having anything to do with goals. When you draw the likely playoff line of 50 points and cut it off at the average of 75 percent an interesting thing occurs. Just 1 of 7 teams with a ratio lower than 75 percent scored 50 points or more. On the flip side, 8 of 10 teams scored 50 points or more when having a ratio of 75 percent or higher. It looks like you want to get your best players as much of the playing time as possible. The teams that simply do that have a higher percentage of success.

Of course there are other factors to consider. For example, a team with a better starting XI will be more likely to limit reserve players’ time, as the quality of the starting XI demands they play. A team with a weaker starting XI would be more prone to test reserve players as the marginal difference between players may not be that great. So the minutes played distribution could definitely be a proxy for player quality. Injuries are another factor that would drive a lower percentage and cause a team to perform more poorly. 

Nevertheless the 75% heuristic can be used to determine if a team is distributing the minutes in a productive way or if the reserve players are getting too much time (which may just be an indication that the starting players aren't all that good or are hurt more than usual).

For readers wondering if adding up eleven players is the right choice, as it is purely chosen for convenience and a desire to use roman numerals, the answer is no. It looks like how many minutes the first fifteen players play is actually most predictive of a team’s points.

Still, I like the XI player and 75 percent target as it’s easy to remember and gets most of the predictive quality. And if you didn't think there was thick cream on this milk quite yet, I’m not done. This minutes played distribution metric remains statistically significant when used in a multivariate regression with expected goals. You might think that expected goals would erase its predictive value as the variables would be correlated, but the Rsquared increases to 38 percent and the minutes played distribution has a slightly lower p-score. This metric holds up even when use in conjunction with a metric that’s closer to measuring goals which is closer to actually winning.

So minutes played has some use after all. An application for its use would be to look at last season’s minutes for a team’s starting XI and analyze how well-suited the team is to achieve at least 75 percent of the team’s total minutes (that’s 25,425 minutes in an MLS season). You could also look at a team’s reserves and see if they have enough quality to play the over 8,000 minutes they’ll likely need to play in a season. 

But even if you don’t take it that far, perhaps the next time you look at a soccer boxscore you won’t be so quick to glance past that first lonely and misunderstood statistic, minutes played.


2nd Annual ASA prediction survey

By Drew Olsen (@drewjolsen)

Last February we polled our readers to ask how they thought the final 2014 MLS standings would look. You can see last season's results here (major props to the three people who predicted DC United finishing atop the Eastern Conference).  We had a lot of fun conducting this survey and revisiting it at the end of the season and seeing how everyone's predictions differed or coincided with reality.

So much fun, in fact, we're doing it again! So take our survey below! Tell us how you think the 2015 MLS standings will look once all the games have been played. It should be pretty obvious, but just click and drag the teams into the order that you see the teams finishing in. We'll publish the results in about a month, and then look at them again once the season is finished. Good luck!

The Ty Webb Award: MLS’ tallest team and other insights about height

Judge Smails: Ty, what did you shoot today?
Ty Webb: Oh, Judge, I don't keep score.
Judge Smails: Then how do you measure yourself with other golfers?
Ty Webb: By height.

-Caddyshack

By Jared Young (@JaredEYoung)

Ty Webb’s classic line is funny in part because no one measures the result of a sporting event based on how tall the participants are. But height is actually no laughing matter in soccer. An article written in 2011 by Chris Anderson revealed that, at least for national soccer teams, taller teams do perform better. The relationship produced a robust 0.53 r-squared. A recent trend showing that MLS homegrown players are smaller than players taken in the SuperDraft got me wondering more about the importance of tall players. How tall or short is MLS when it comes to height? And who in fact is the tallest current team in MLS, and therefore winner of the Ty Webb Award?

First, here is a look at how MLS stacks up against the top European leagues. This data is from mlssoccer.com rosters and an annual analysis of height in soccer managed by the CIES Football Observatory.

Interestingly, Germany and England clear nearly two centimeters per player over any of the other leagues in the analysis. That is pretty significant. MLS is the tallest league outside of those two countries, so they should not back down from any fights. It gets interesting when you look by position.

MLS stacks up quite consistently with Europe in all positions but midfield. MLS midfielders are 1.6 centimeters shorter on average than in Europe. Only Orlando City, Seattle and DC United have midfields that are taller than the European average. The Houston Dynamo, Sporting KC and the Vancouver Whitecaps all sport midfields four centimeters below that European average.

I dug into the midfield “issue” a bit. Players born in the US are just one centimeter shorter than the European average, but only 34 percent of US-born players are midfielders, compared to the league average of 40 percent. That means that foreign born players compensate for the lack of US midfielders, and they must be even shorter than average. Sure enough, Central and South American players represent the region that sources more than its share of shorter midfielders in MLS. In fact, 48 percent of players born in those regions who play in MLS play in the midfield, and they are much shorter than average at just 175.1 centimeters tall.

The Latin American players in MLS are also significantly shorter than the players overseas. They average 178.1 centimeters in MLS (when you include forwards, goalkeepers and defenders), and yet players from those regions are 181 centimeters over in Europe.

Players originally from the US are actually of slightly above average height compared to Europe, but MLS attracts foreign players that are below average height for soccer players. This is perhaps worth some future investigation.

Okay, onto the big trophy. This season’s Ty Webb Award for tallest team goes to the Colorado Rapids!

Here is a chart that shows all the MLS teams in order by average height.

I’ll leave you with a few observations:

*Colorado leads the league in defender height and also has a tall midfield, so their height is very much in the back. Colorado were tied for 5th last season in set piece goals.

*Sporting KC and Real Salt Lake, the two franchises most noted for winning the most with the least amount of salary, have the shortest teams.

*The expansion teams NYCFC and Orlando City SC are starting out tall.

*There does not appear to be any relationship between preseason favorites and the height of the team.

Despite the MLS targeting shorter homegrown players, folks like Ty Webb and soccer analysts will continue to question if that’s the right move. The latest understanding is that taller is better. That doesn’t mean that the Colorado Rapids are preseason favorites. It just means they may have a slight advantage over other teams they will face. 

In the next installment, we analyze which MLS team was most likely caught putting with the daughter of the Dean. Just putting, at night.

Do expected goals models lack style?

By Jared Young (@JaredEYoung)

Expected goals models are hip in the land of soccer statistics. If you have developed one, you are no doubt sporting some serious soccer knowledge. But it seems to be consistent across time and geography that the smart kids always lack a bit of style.

If you are reading this post you are probably at least reasonably aware of what an expected goals model is. It tells you how many goals a team should have scored given the shots they took. Analysts can then compare the goals actually scored with the goals a team was expected to score and use that insight to better understand players and teams and their abilities.

The best expected goals models incorporate almost everything imaginable about the shot. What body part did the shooter connect with? What were the exact X,Y coordinates of the shooter? What was the position of the goalie? Did the player receive a pass beforehand? Was it a set piece? All of these factors are part of the model. Like I said, they are really cool.

But as with all models of the real world, there is room for improvement. For example, expected goals models aren’t great at factoring in the number of defenders between the shooter and the goal. That could force a higher number of blocked shots or just force the shooter to take a more difficult shot than perhaps they would like to. On the opposite end of that spectrum, perhaps a shooter was wide open on a counterattack, the models would not likely recognize that situation and would undervalue the likelihood of a goal being scored. But I may have found something that will help in these instances.

I recently created a score that attempted to numerically define extreme styles of play. On the one end of the score are extreme counterattacking teams (score of 1) and on the other end are extreme possession-oriented teams (score of 7). The question is, if I overlay this score on top of expected goals models, will I find any opportunities like those mentioned above? It appears there are indeed places where looking at style will help.

I have only scored one full MLS season with the Proactive Score (PScore) so I’ll start with MLS in 2014, where I found two expected goals models with sufficient data. There is the model managed here by the American Soccer Analysis team (us!) and there is the publicly available data compiled by Michael Caley (@MC_of_A). Here is a chart of the full season’s average PScore and the difference between goals scored and expected goals scored for the ASA model and Michael Caley’s model.

Both models are pretty similar. If you were to draw a straight line regression through this data you would find nothing in particular. But allowing a polynomial curve to find a best fit reveals an interesting pattern in both charts. When the Pscores are below 3, indicating strong counterattacking play, the two models consistently under predict the number of goals scored. This makes sense given what I mentioned above; teams committed to the counterattack should find more space when shooting and should have a better chance of making their shots. Michael Caley’s model does a better job handling it, but there is still room for improvement.

It’s worth pointing out that teams that rely on the counterattack tend to be teams that consider themselves to be less talented (I repeat, tend to be). But you would think that less-talented teams would also be teams that would have shooters that are worse than average. The fact that counterattacking teams outperform the model indicates they might also be overcoming a talent gap to do so.

On the other hand, when the PScore is greater than 4, the models also underpredict the actual performance. This, however, might be for a different reason. Usually possession-oriented teams are facing more defenders when shooting. The bias here may be a result of the fact that teams that can outpossess their opponent to that level may also have the shooting talent to outperform the model.

Notice also where most teams reside, between 3 and 4. This appears to be no man’s land; a place where the uncommitted or incapable teams underperform.

Looking at teams in aggregate, however, comes with its share of bias, most notably the hypothesis I suggested for possession-oriented teams. To remove that bias, I looked at each game played in MLS in 2014, home and away, and plotted those same metrics. I did not have Michael Caley’s data by game, so I only looked at the ASA model.

For both home and away games there does appear to be a consistent bias against counterattacking teams. In games where teams produce strong counter-attacking Pscores of 1 or 2, we see them also typically outperforming expected goals (G - xG). Given that xG models are somewhat blind to defensive density it would make perfect sense that counterattacking teams shoot better than expected. By design they should have more open shots than teams that play possession soccer. It definitely appears to me that xG models should somehow factor in teams that are playing counterattacking soccer or they will under estimate goals for those teams.

What’s interesting is that same bias does not reveal itself as clearly at the other end of the spectrum, like we saw in the first graph. When looking at the high-possession teams -- the sixes and sevens -- the teams' efficiencies become murkier. If anything, it appears that being more proactive to an extreme is detrimental to efficiency (G - xG), especially for away teams. The best fit line doesn’t quite do the situation justice. When away teams are very possession-oriented with a PScore of 6 or 7, they actually underperform the ASA xG model by an average of 0.3 goals per game. That seems meaningful, and might suggest that gamestates are playing a role in confusing us. With larger samples sizes this phenomenon could be explored further, but for now it's safe to say that when a team plays a counter-attacking game, it tends to outperform its expected goals.

Focusing on home teams with high possession over the course of the season, we saw an uptick to goals minus expected goals. But It doesn’t appear the case that possession-oriented teams shoot better due to possession itself, based on the trends we saw from game to game. It seems that possession-oriented teams play that way because they have the talent to, and it’s the talent on the team that is driving them to outperform their expected goals.

So should xG models make adjustments for styles of play? It really depends on the goal of the model. If the goal is to be supremely accurate then I would say that the xG models should look at the style of play and make adjustments. However, style is something that is not specific to one shot, it looks over an entire game. Will modelers want to overlay macro conditions to their models rather than solely focus on the unique conditions of each shot?

Perhaps the model should allow this bias to continue. After all, it could reveal that counterattacking teams have an advantage in scoring as one would expect.

If the xG models look to isolate shots based on certain characteristics, perhaps they should strive to add data to each particular moment. Perhaps an aggregate overlay on counterattacks would be counterproductive as it would take the foot off the pedal of collecting better data for each shot taken. Perhaps this serves as inspiration to keep digging, keep mining for the data that helps fix this apparent bias. Perhaps it’s the impetus to shed the sweater vest and find an old worn-in pair of boots. Something a little more hip to match the intellect.

Visualizing MLS Salaries Compared to Other U.S. Leagues

By Drew Olsen (@drewjolsen)

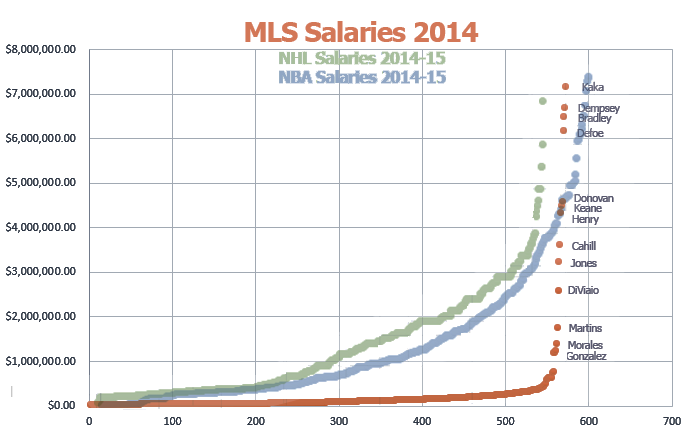
With the MLS season rapidly approaching and players talking tougher about their demands for the new collective bargaining agreement (CBA), it helps to give some context for where MLS players stand compared to other leagues. Data is hard to come by for foreign leagues because they don't disclose much about salaries, but the other major American sports leagues are more forthcoming. By looking at the other major US leagues, we can examine how MLS wages match up against their fellow pro athletes.

There are many caveats to this comparison. To start, an increase in the minimum salary doesn’t even seem to be the MLS players’ major priority; that would be free agency. Second, MLS is famously secretive, and does not release the exact terms of any player contracts. We get these numbers from the Major League Soccer Players Union (MLSPU), which publicizes the cost against the salary cap of each MLS player a few times a season. Often, that number does not necessarily match the player's actual salary, as teams often use allocation money and other magic to limit their cap hit (a good example is David Villa, who made much more than the $60,000 he was listed at most recently). Indeed, league officials can be counted on to claim the inaccuracy of these salary releases each time they are published. But until they provide proof, claiming foul while also refusing to release the the “real” numbers reminds me of when I ask my baby cousin how he knows unicorns live in his backyard. He usually replies “because they do!”

With those limitations aside, below are presented the five major US sports with a variety of arbitrary bits of salary information, as determined to the best of my ability using public data. We've also got all MLS player salary information in a sortable table here.

League Average MedianAve-MedAve/MedMinSalaryMaxSalaryMax/MinTop salary as % of league totalTop salary > X lowest salaries combined
MLS $226,454$91,827$134,6272.47$36,500$7,167,500196.375.53160
NFL $1,900,000$770,000$1,130,0002.47$420,000$22,000,00052.380.68*‡
MLB $3,818,923$987,500†$2,831,4233.87$507,500$30,714,28660.520.88‡
NHL $2,696,069$2,000,000$696,0691.35$550,000$14,000,00025.450.7224
NBA $4,153,249$2,245,886$1,907,3641.85$507,336$20,644,40040.691.0877

There are a few things to note when looking at these numbers. MLS has a much smaller average wage and a much smaller total wage sum than all the other leagues; the $226,464 average wage is less than the minimum salary of all the other leagues. Conversely, MLS has no official maximum wage, which differs from leagues like the NHL, NBA or NFL, where there is a max possible salary and a harder and harsher salary cap. Furthermore, the other four leagues are the apex of talent and competition in the world for these sports, while the most generous MLS fan would be hard pressed to argue that the league is in the top five soccer leagues in the world.  Lastly, MLS is a league that continues to grow, entering 2015 with 20 teams. The NBA, NHL, and MLB all have 30 teams, and the NFL has 32. Perhaps MLS' comparatively small number of teams contributes to some of the difference. We could go on here, but these all essentially boil down to this: MLS doesn’t compare perfectly to the other American sports. But you already knew that.

That said, these are still the five major professional sports leagues in the US, and these are the leagues that we MLS fans are constantly measuring ourselves against. It’s also why this is still an interesting and valuable exercise.

In some areas, MLS falls in right among the other major sports, while in others it is a clear outlier. For instance, when dividing the average salary by the median salary across leagues, MLS is on par with the NFL and more equitable than MLB. This is one way to say that MLS salaries as a whole are not as skewed upwards as those of MLB. MLS’s major differences come in the income disparity at the extremes – those with the biggest salaries are simply making much more than those at the bottom, especially when compared to other leagues.

When an unheralded young player gets his first callup to the Majors, he is usually making around $500k, which is about 1/60th of the $30 million Clayton Kershaw will make in 2015. Similarly, the NBA has the highest average salary of any other league in the world (beating out the Indian Premier Cricket League. Who would have guessed?), and Kobe Bryant makes about 40 times the rookie minimum. While MLS has the shortest average career of the major sports at only about 2.5 years, the NFL is second shortest, and presumably comes with a more severe wear and tear on the body. In that league, Aaron Rodgers’ salary is 52 times the size of the league's lowest paid player. Kaka, the flashiest name on the roster of the newly promoted Orlando City, makes about $7 million per season, which is almost 200 times what players like Dylan Remick and Bradford Jamieson IV made last year. Indeed, Kaka alone made more than the 160 lowest paid players in MLS… combined, and he accounts for more than 5.5% of total league wages; next closest is the NBA where Bryant is at 1%.

*NBA and NHL Salaries were prorated linearly to fit on the graph. X-axis is reverse-ordered rank of individual player's salary.

*NBA and NHL Salaries were prorated linearly to fit on the graph. X-axis is reverse-ordered rank of individual player's salary.

To put this disparity in perspective, if all 145 players that made less than $50,000 last season were given a modest wage increase to $50k, it would cost MLS about $900,000. That sum is less than 1/7th what players like Defoe, Dempsey, and Bradley made last year, and pales in comparison to the $200 million that is about to be spent to build a new stadium for DC United.

These numbers help us paint a picture of what this small portion of the CBA means. They help explain why it just doesn’t ring true when Don Garber and the MLS ownership group claims poverty, even after they’ve signed a record-breaking TV deal and brought in the likes of Kaka, Dempsey, Bradley, Altidore, Villa, Giovinco, and Lampard for many millions of dollars each. Without a doubt, MLS is in a different place in its history, operates under different rules, and competes in a different market compared to the other four major American pro sports leagues. But it is still the apex of pro soccer talent in the USA and Canada, and so when the MLSPU asks for a raise in the minimum salary, it might be time for the league to listen.

*I wasn't able to find the number of players that are measured to create the published average NFL salary, but each team has 53 players, and there are 32 teams, so I multiplied by the average salary to estimate the sum of all NFL salaries (53*32*1900000=3,222,400,000).

† Because of the majors/minors aspect of MLB, median is a bit hard to judge. This article states the average salary and the number of players (910) that played last year. The median would be the 455th, player, which I found here, a list that only goes through 468. This obviously presumes that the 400 or so players not listed made less than those who are listed. In other words, this estimate may not be exact but it's probably pretty close.

‡ I couldn't find a comprehensive list of all NFL and MLB contracts and their sums, and so was unable to estimate how many of the lowest salaries were roughly equivalent to the biggest in those leagues.