
Winter Is Coming
/
For reasons unbeknownst to me, the algorithm decided to surface a lot of people talking about the upcoming change in the MLS schedule for the 2027/28 season recently. Maybe it’s the crisp fall air, the departure from the hottest summer I’ve ever experienced, people excited for a super El Nino, I don’t know.
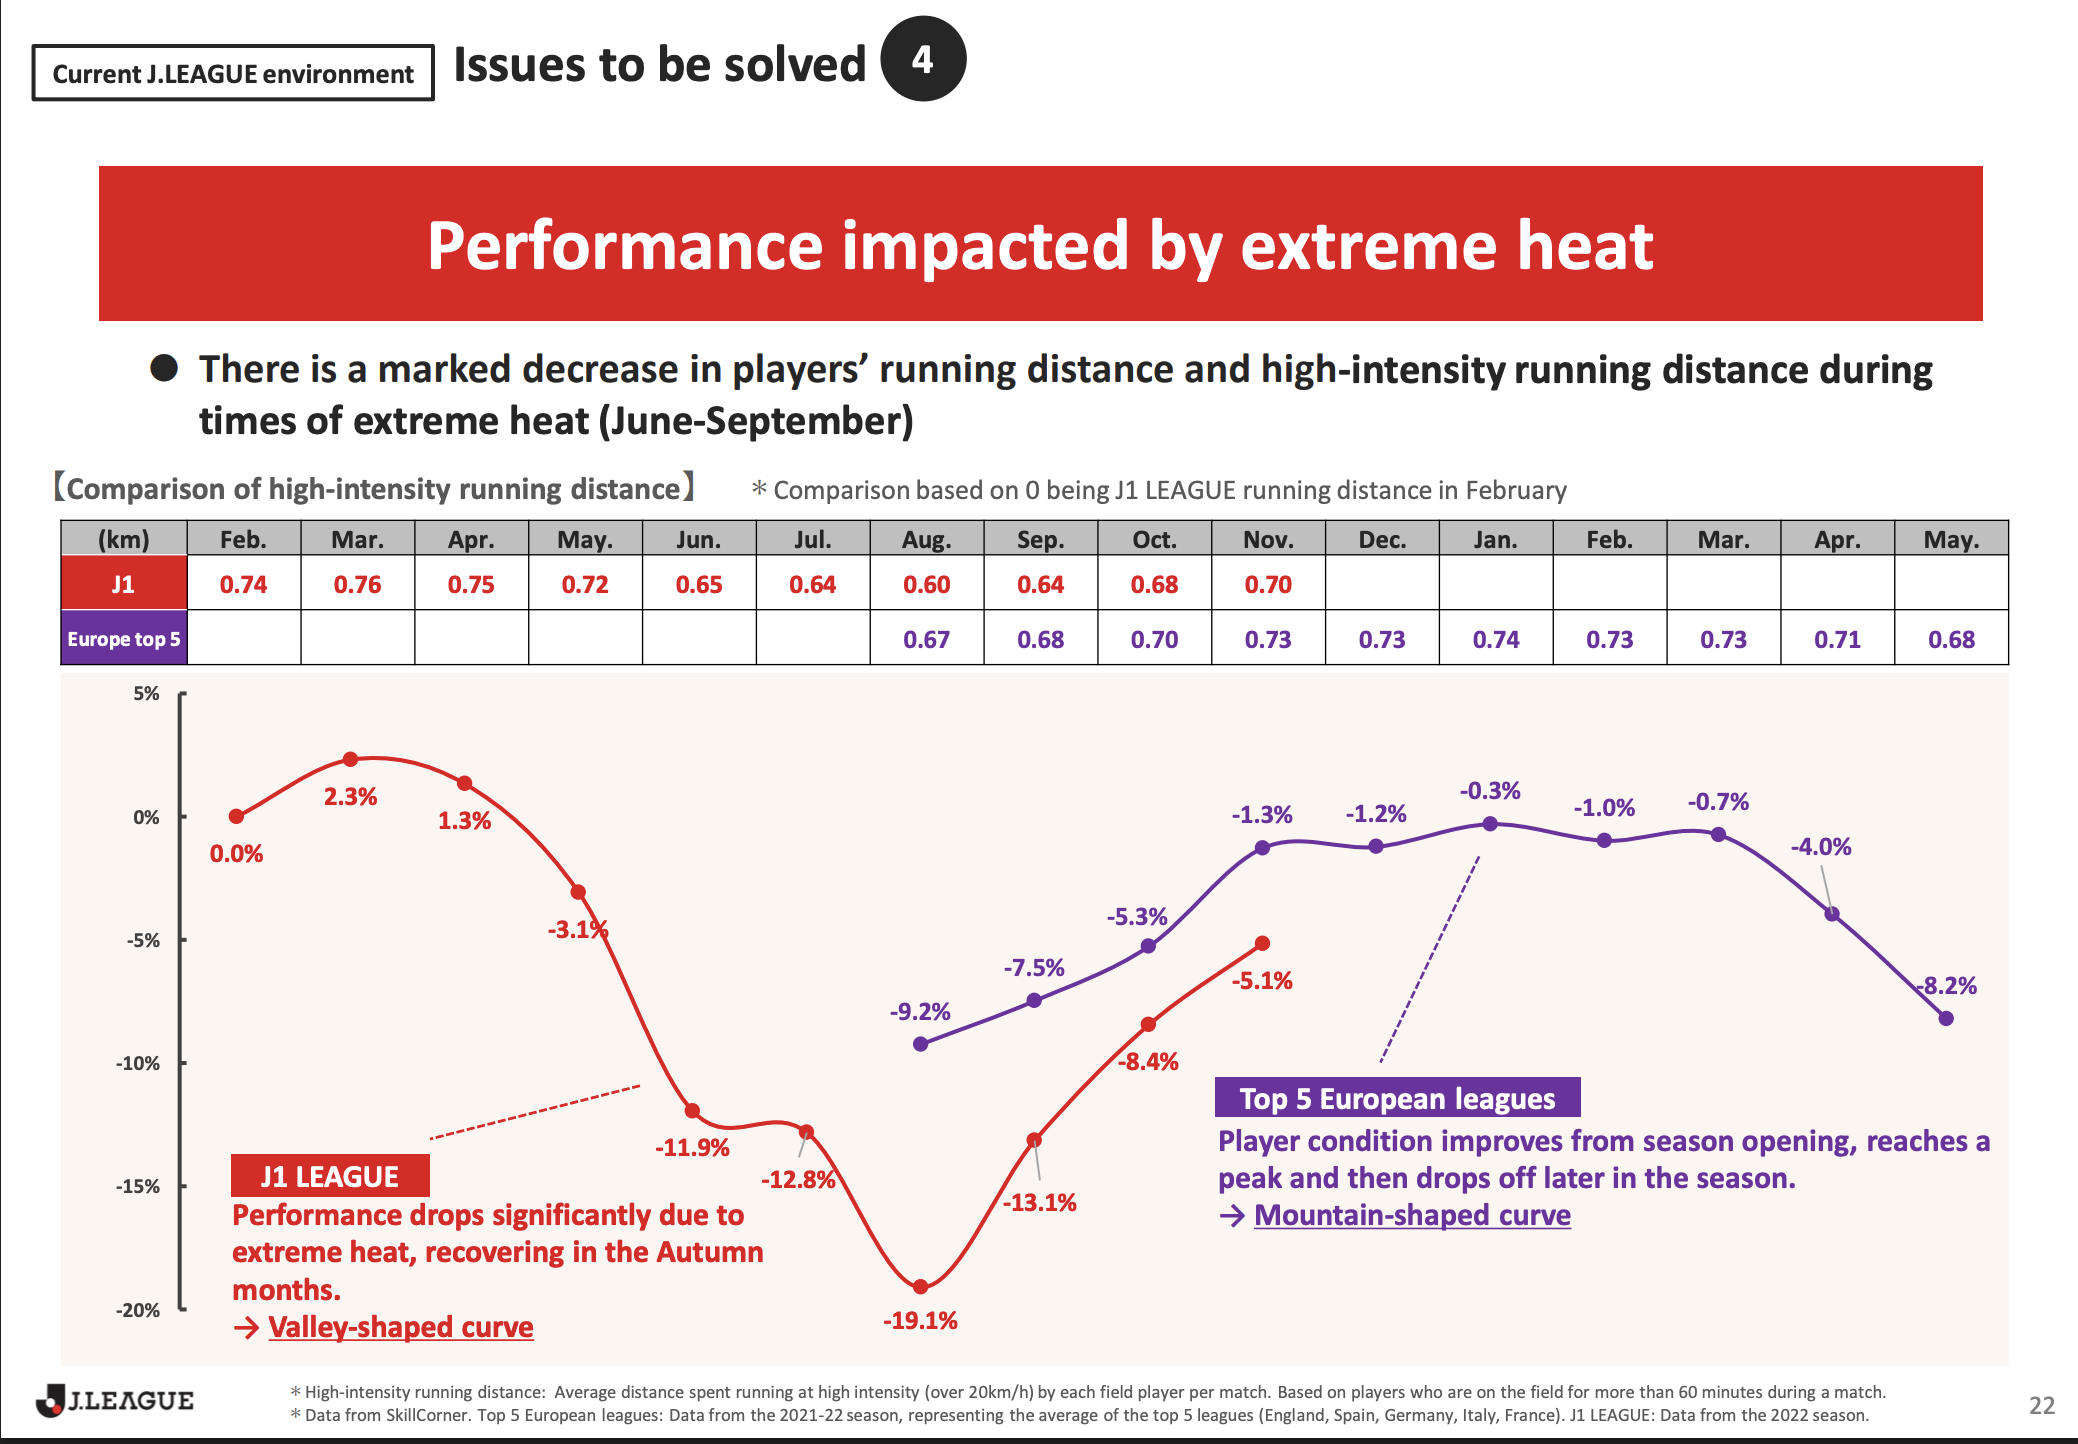
But this is a thing that is knowable. Namely: how does this schedule change actually change the league? The talk from league brass is about the alignment with the European transfer markets and the ability to run the playoffs without a fat international break in the middle. The J-League of Japan, who also adjusted their schedule, cited the alignment with the European windows as a key driver for them as well in a report published about their schedule change.
These two things are objectively true. Everyone hated the big international break in the middle of the playoffs, and any solution that moved the playoffs entirely after the break was dumb, and entirely before the November FIFA window took too many games off the table. Not very maximizing shareholder value of you to suggest such a thing. The thing we’re going to spend today talking about is the other reason that doing this move made sense for Japan, and has been a big cause for concern amongst MLS fans, but hasn’t really been mentioned by the league: the weather.
On slide 22 of the J League deck I shared above, they show the huge impact to physical metrics during the season. August, peak heat and humidity in Japan, shows a 19% reduction in high intensity running per SkillCorner data in the 2022 season. We don’t have access to SkillCorner, but we can probably approximate physical exertion with a number of event metrics.
The Dog Days of Summer
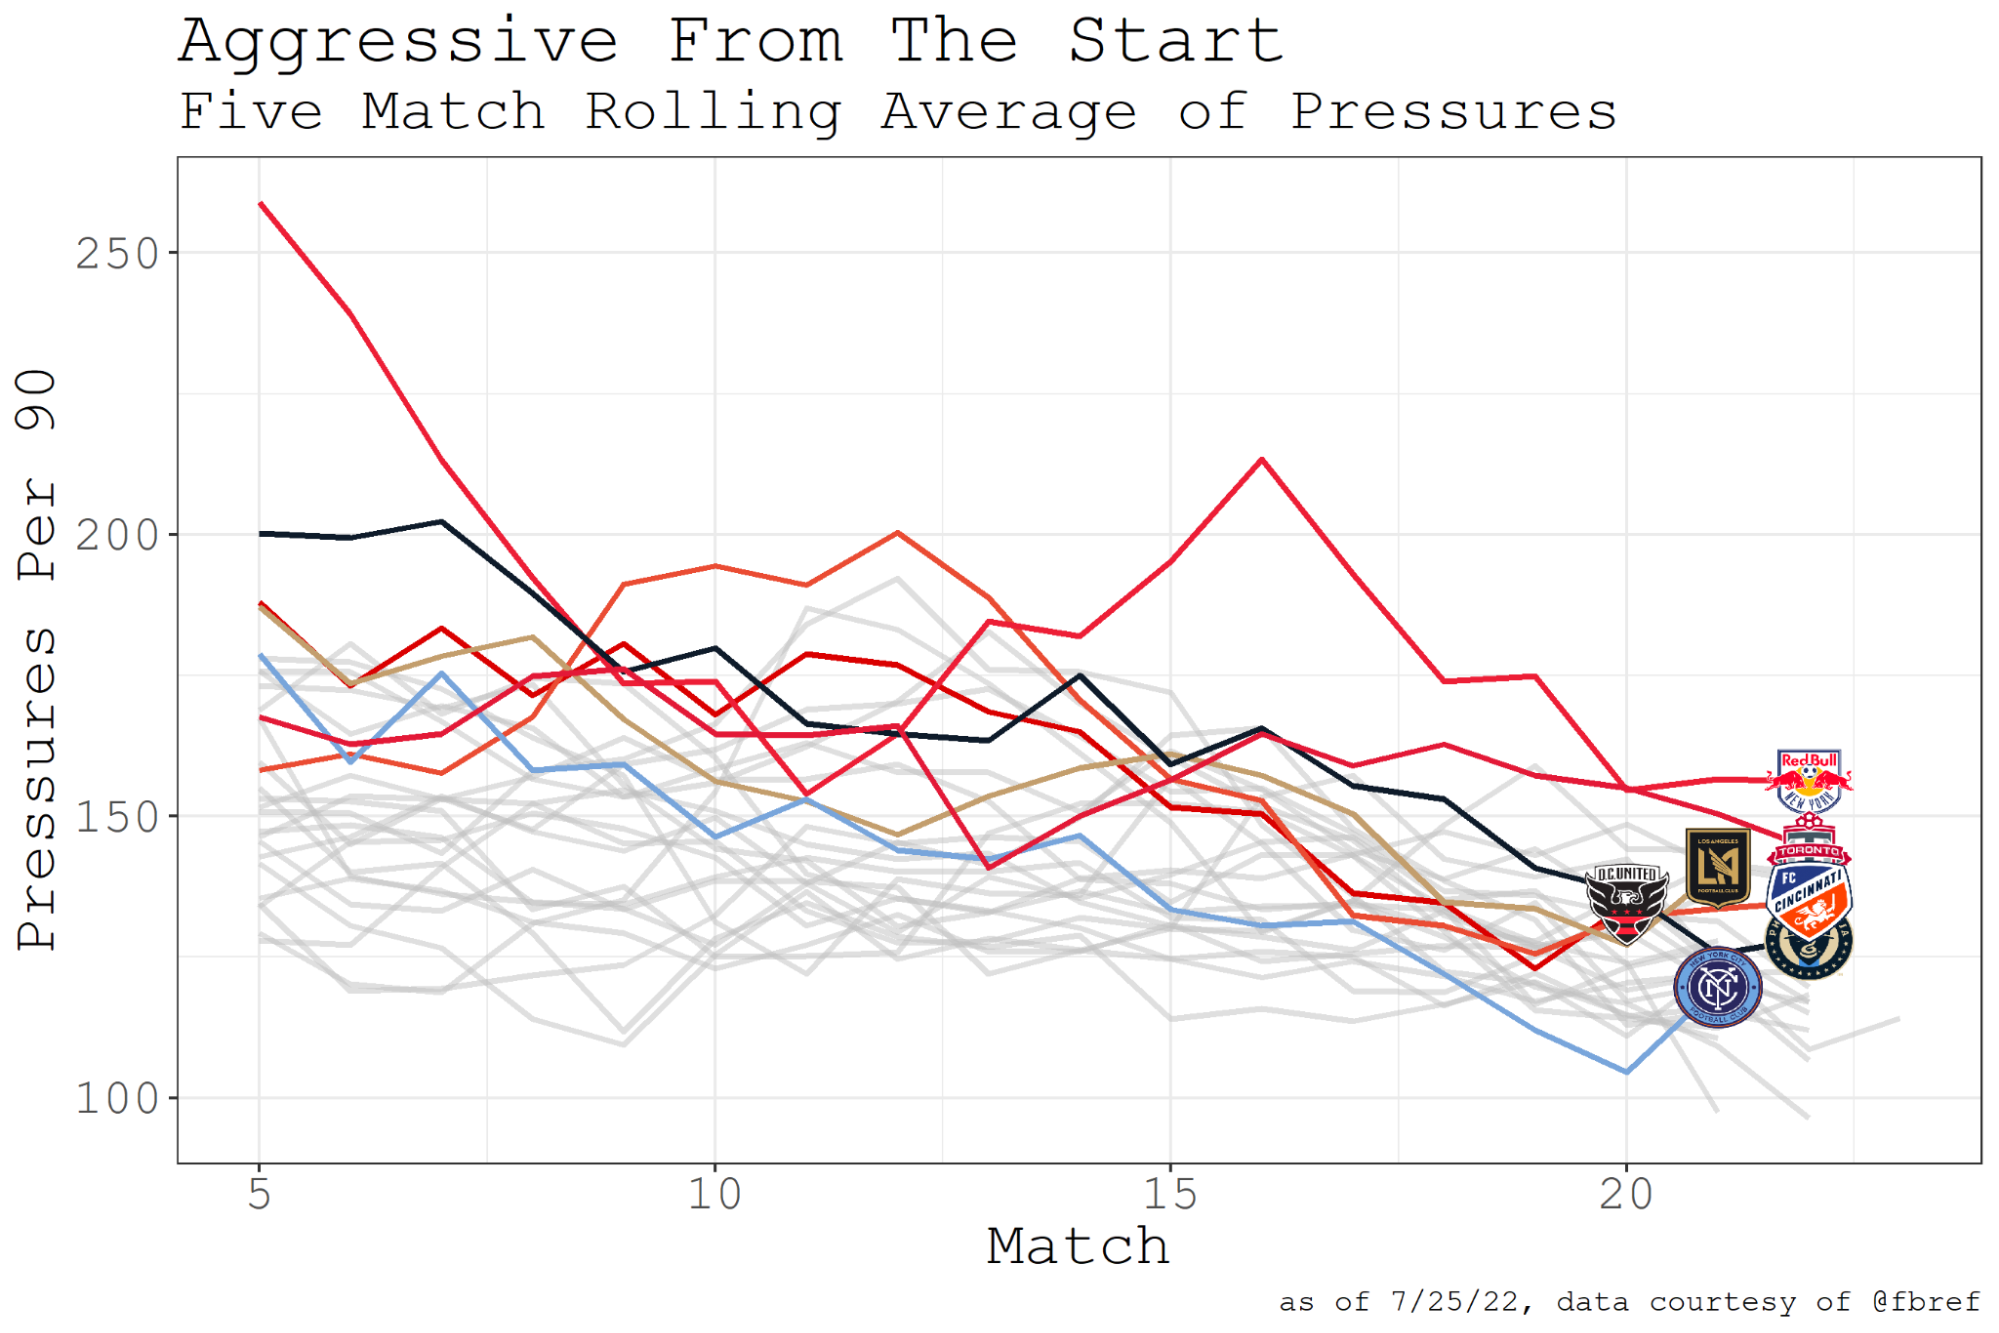
Nate Gilman wrote a great piece in 2022 at ASA, back when Statsbomb pressure data was freely available on FBRef, about how teams just died pressing in the summer. I’ll crib one of his figures here: almost every single team pressed less in July than they did in March. The league average dropped from something like 150-160 pressures per team per 90 to 120-130 pressures per 90. That’s HUGE.
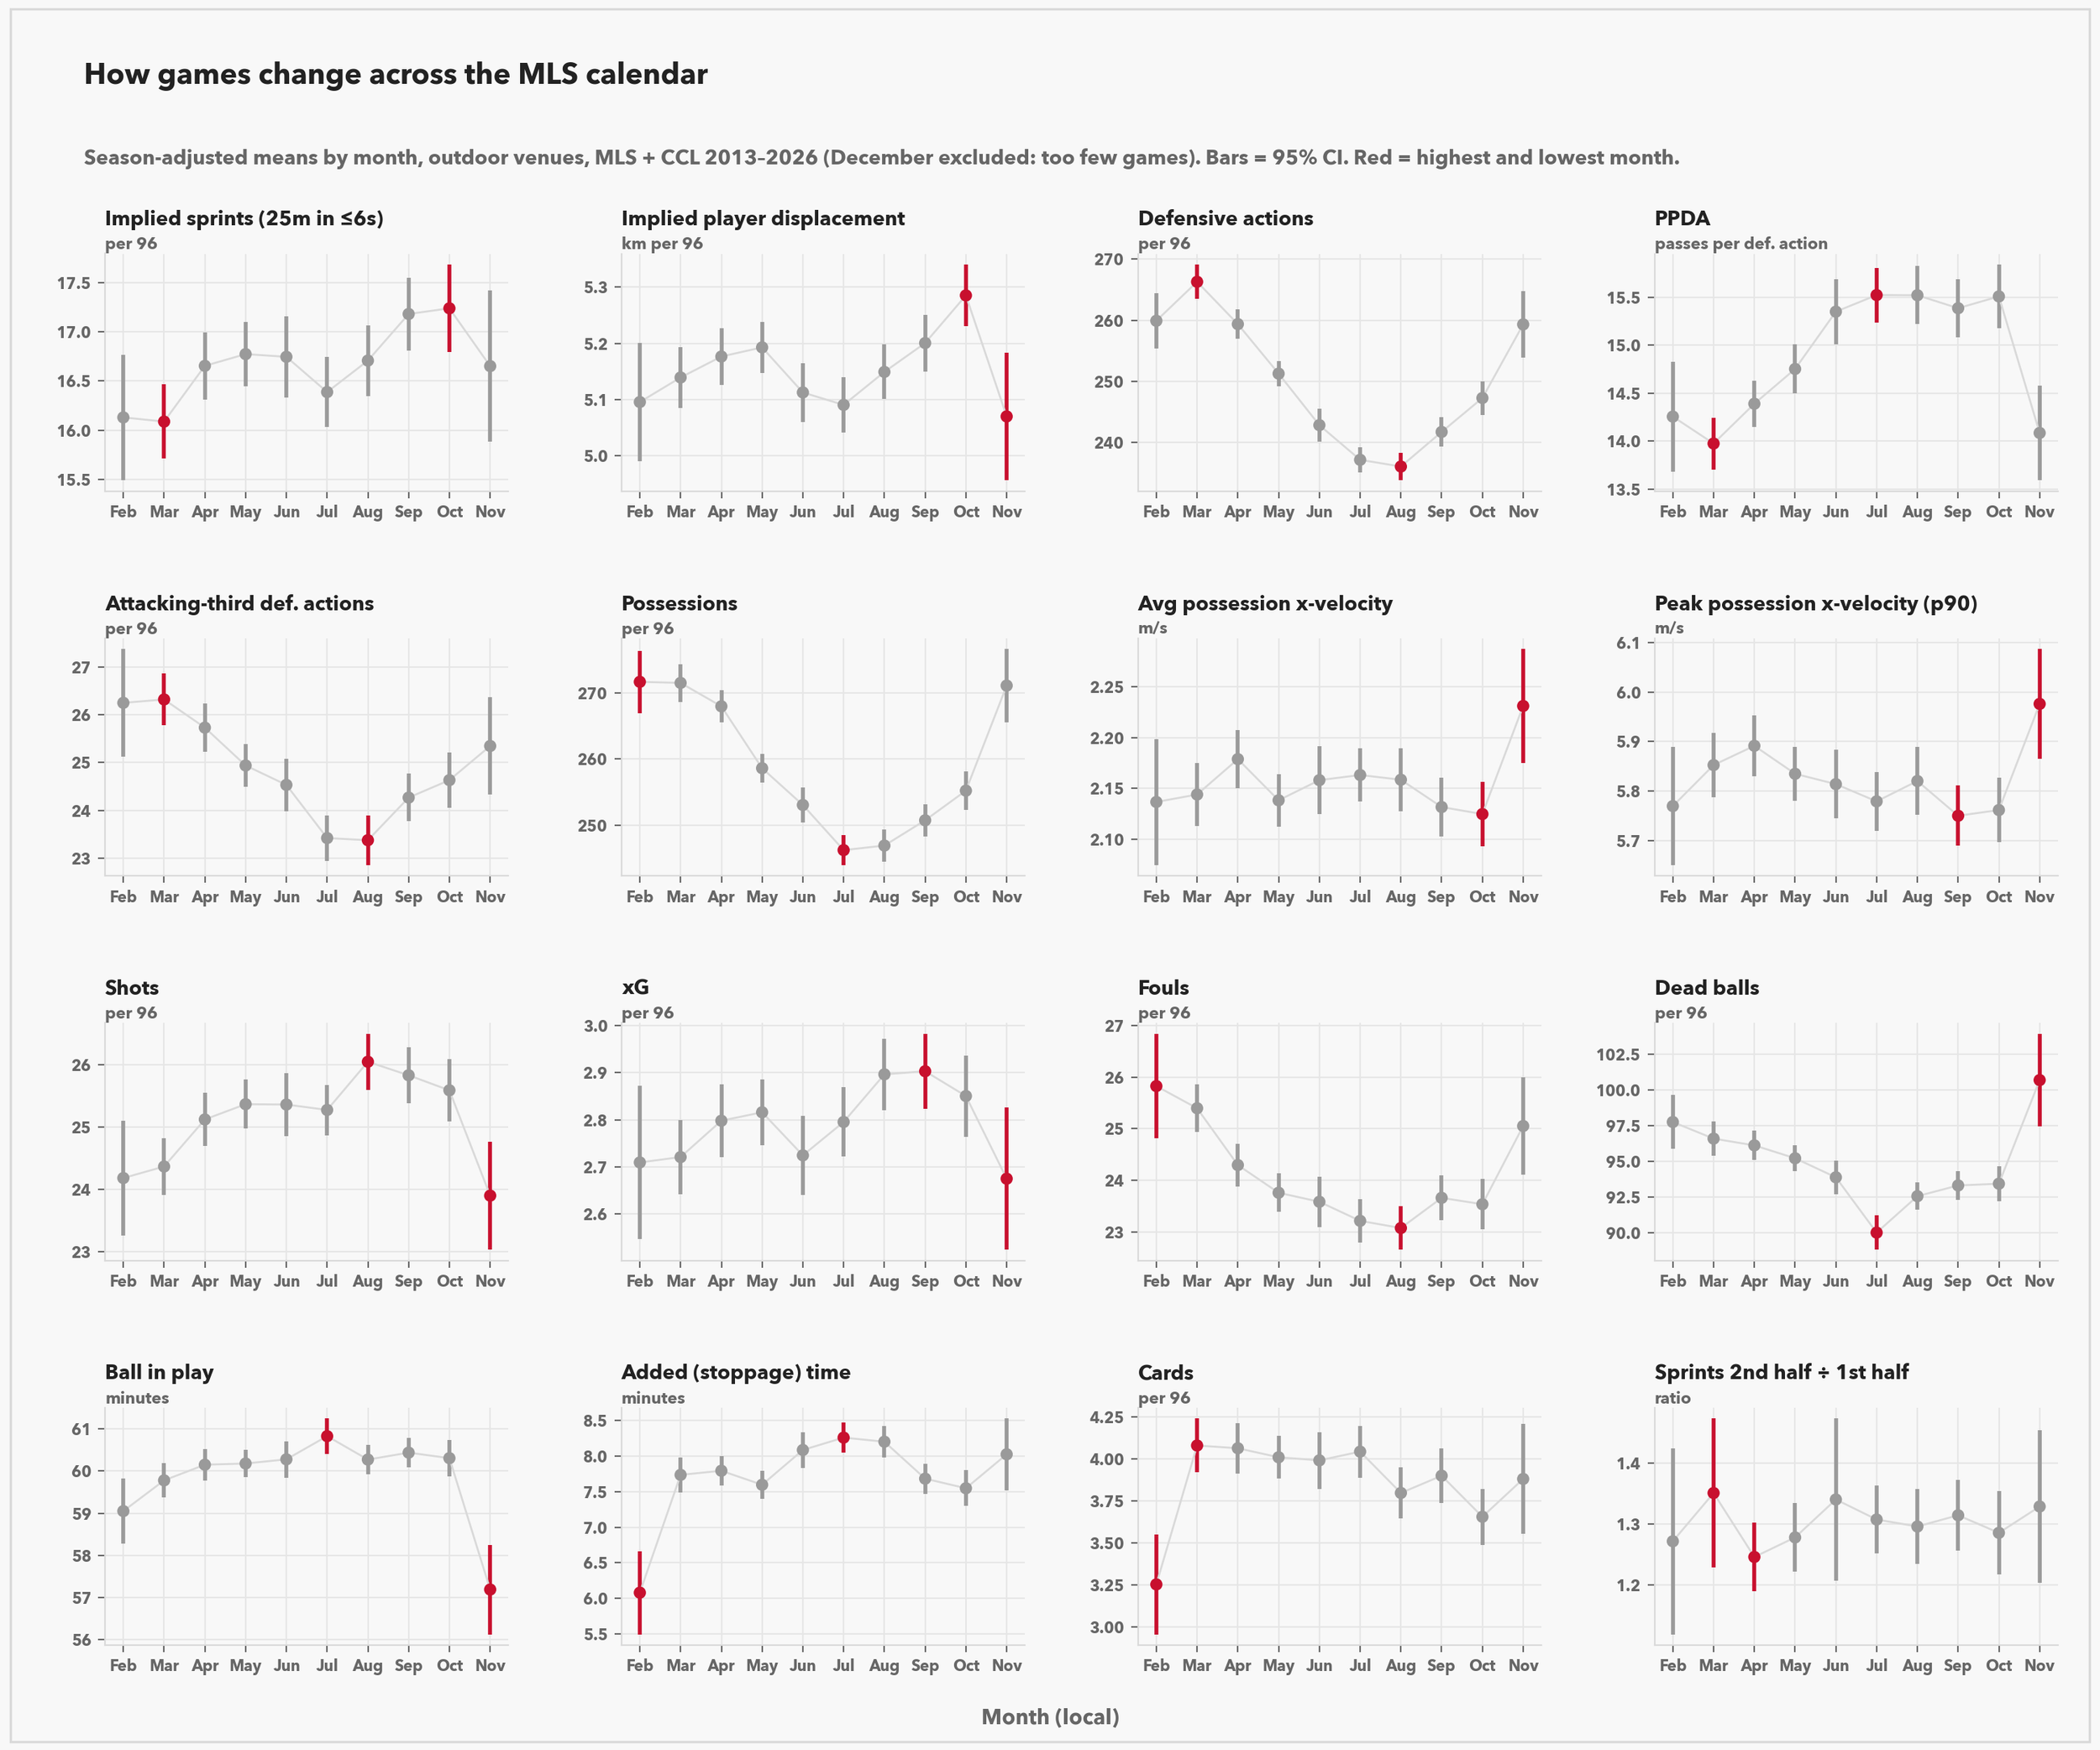
We don’t have that data anymore, but we do have a bunch of data that can maybe approximate something like physical exertion. There are a bunch I tried here by month of the season, some worked, some didn’t. The main takeaway: summer in North America is hot. For each of these metrics I took everything relative to their individual season (MLS teams press much more in 2026 than they did in 2013 and it made the plots look weird), and removed December because it’s only MLS Cup games, but the finding is very clear. Any metric that measures defensive effort dies in the summer. Total defensive actions drop from 265 per 96 in the spring to fewer than 240 by August. PPDA increases (less pressy) from 14 to 16 from March to July. Attacking third defensive actions, by definition pressing and counter pressing moments, 26 per 96 down to 23 per 96. Total possessions in a game! 270 down to fewer than 250. Across all the metrics that matter there’s a somewhere between 10 and 20% reduction from spring/fall to the heat of summer.
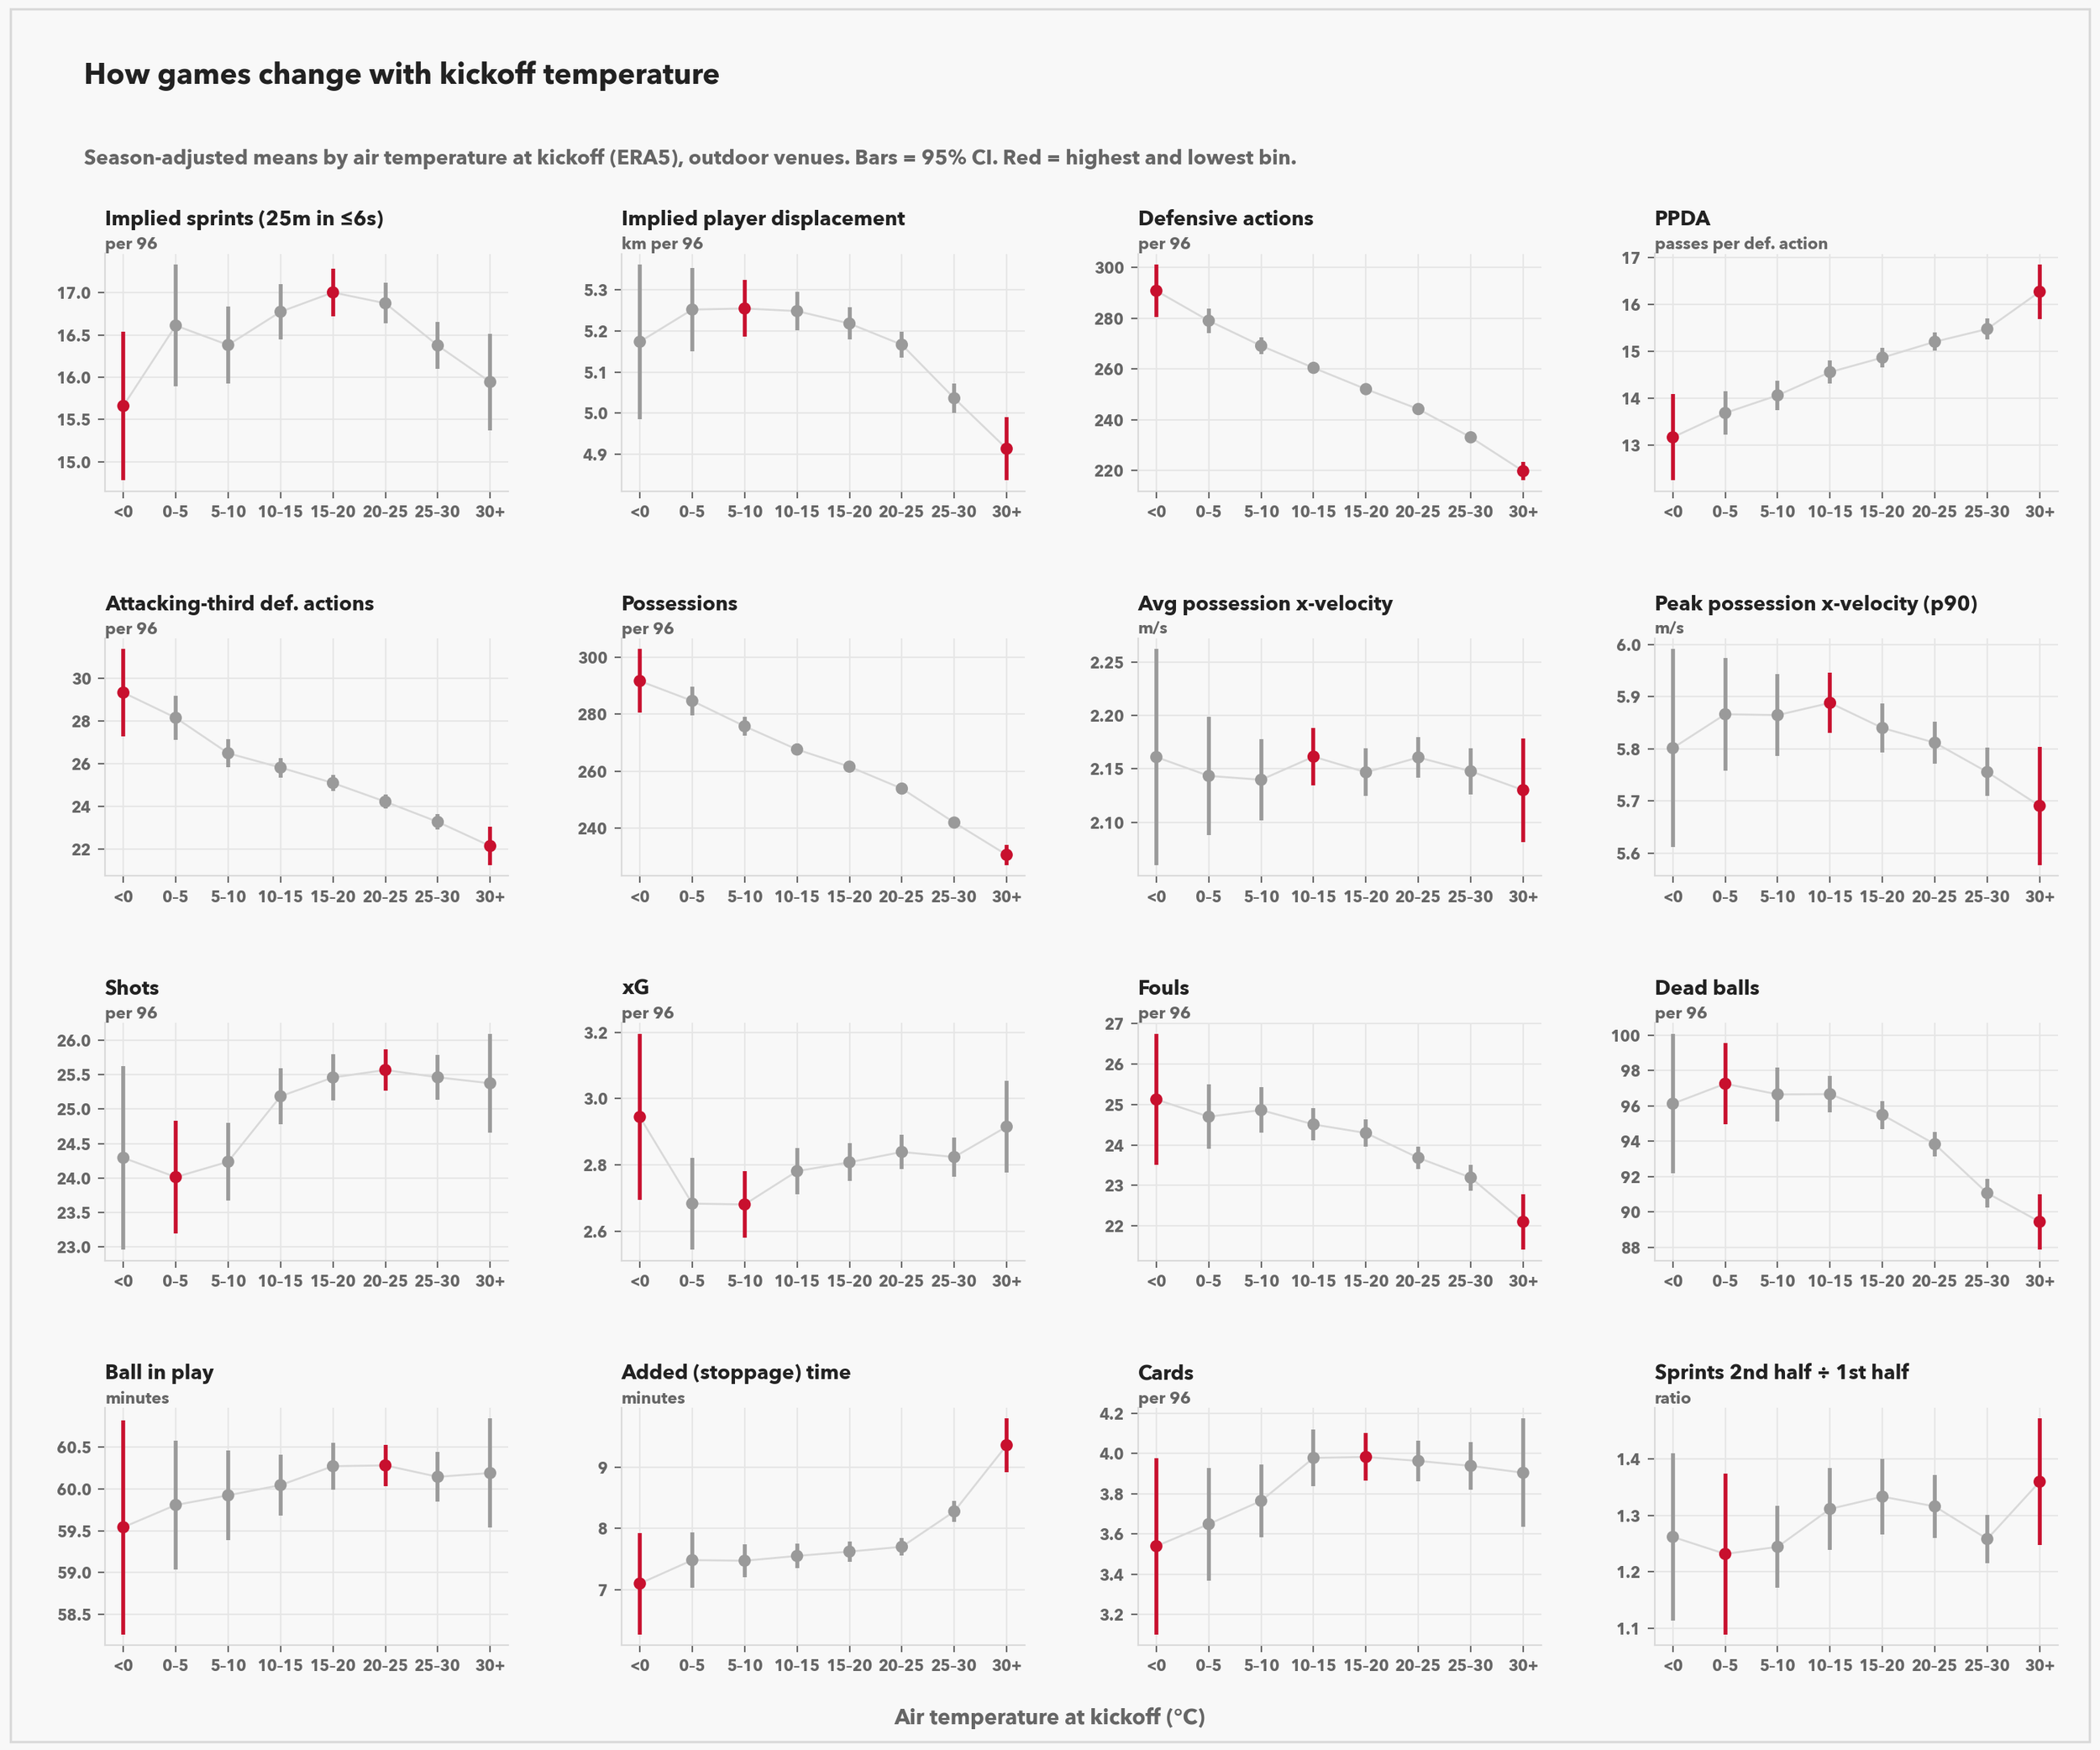
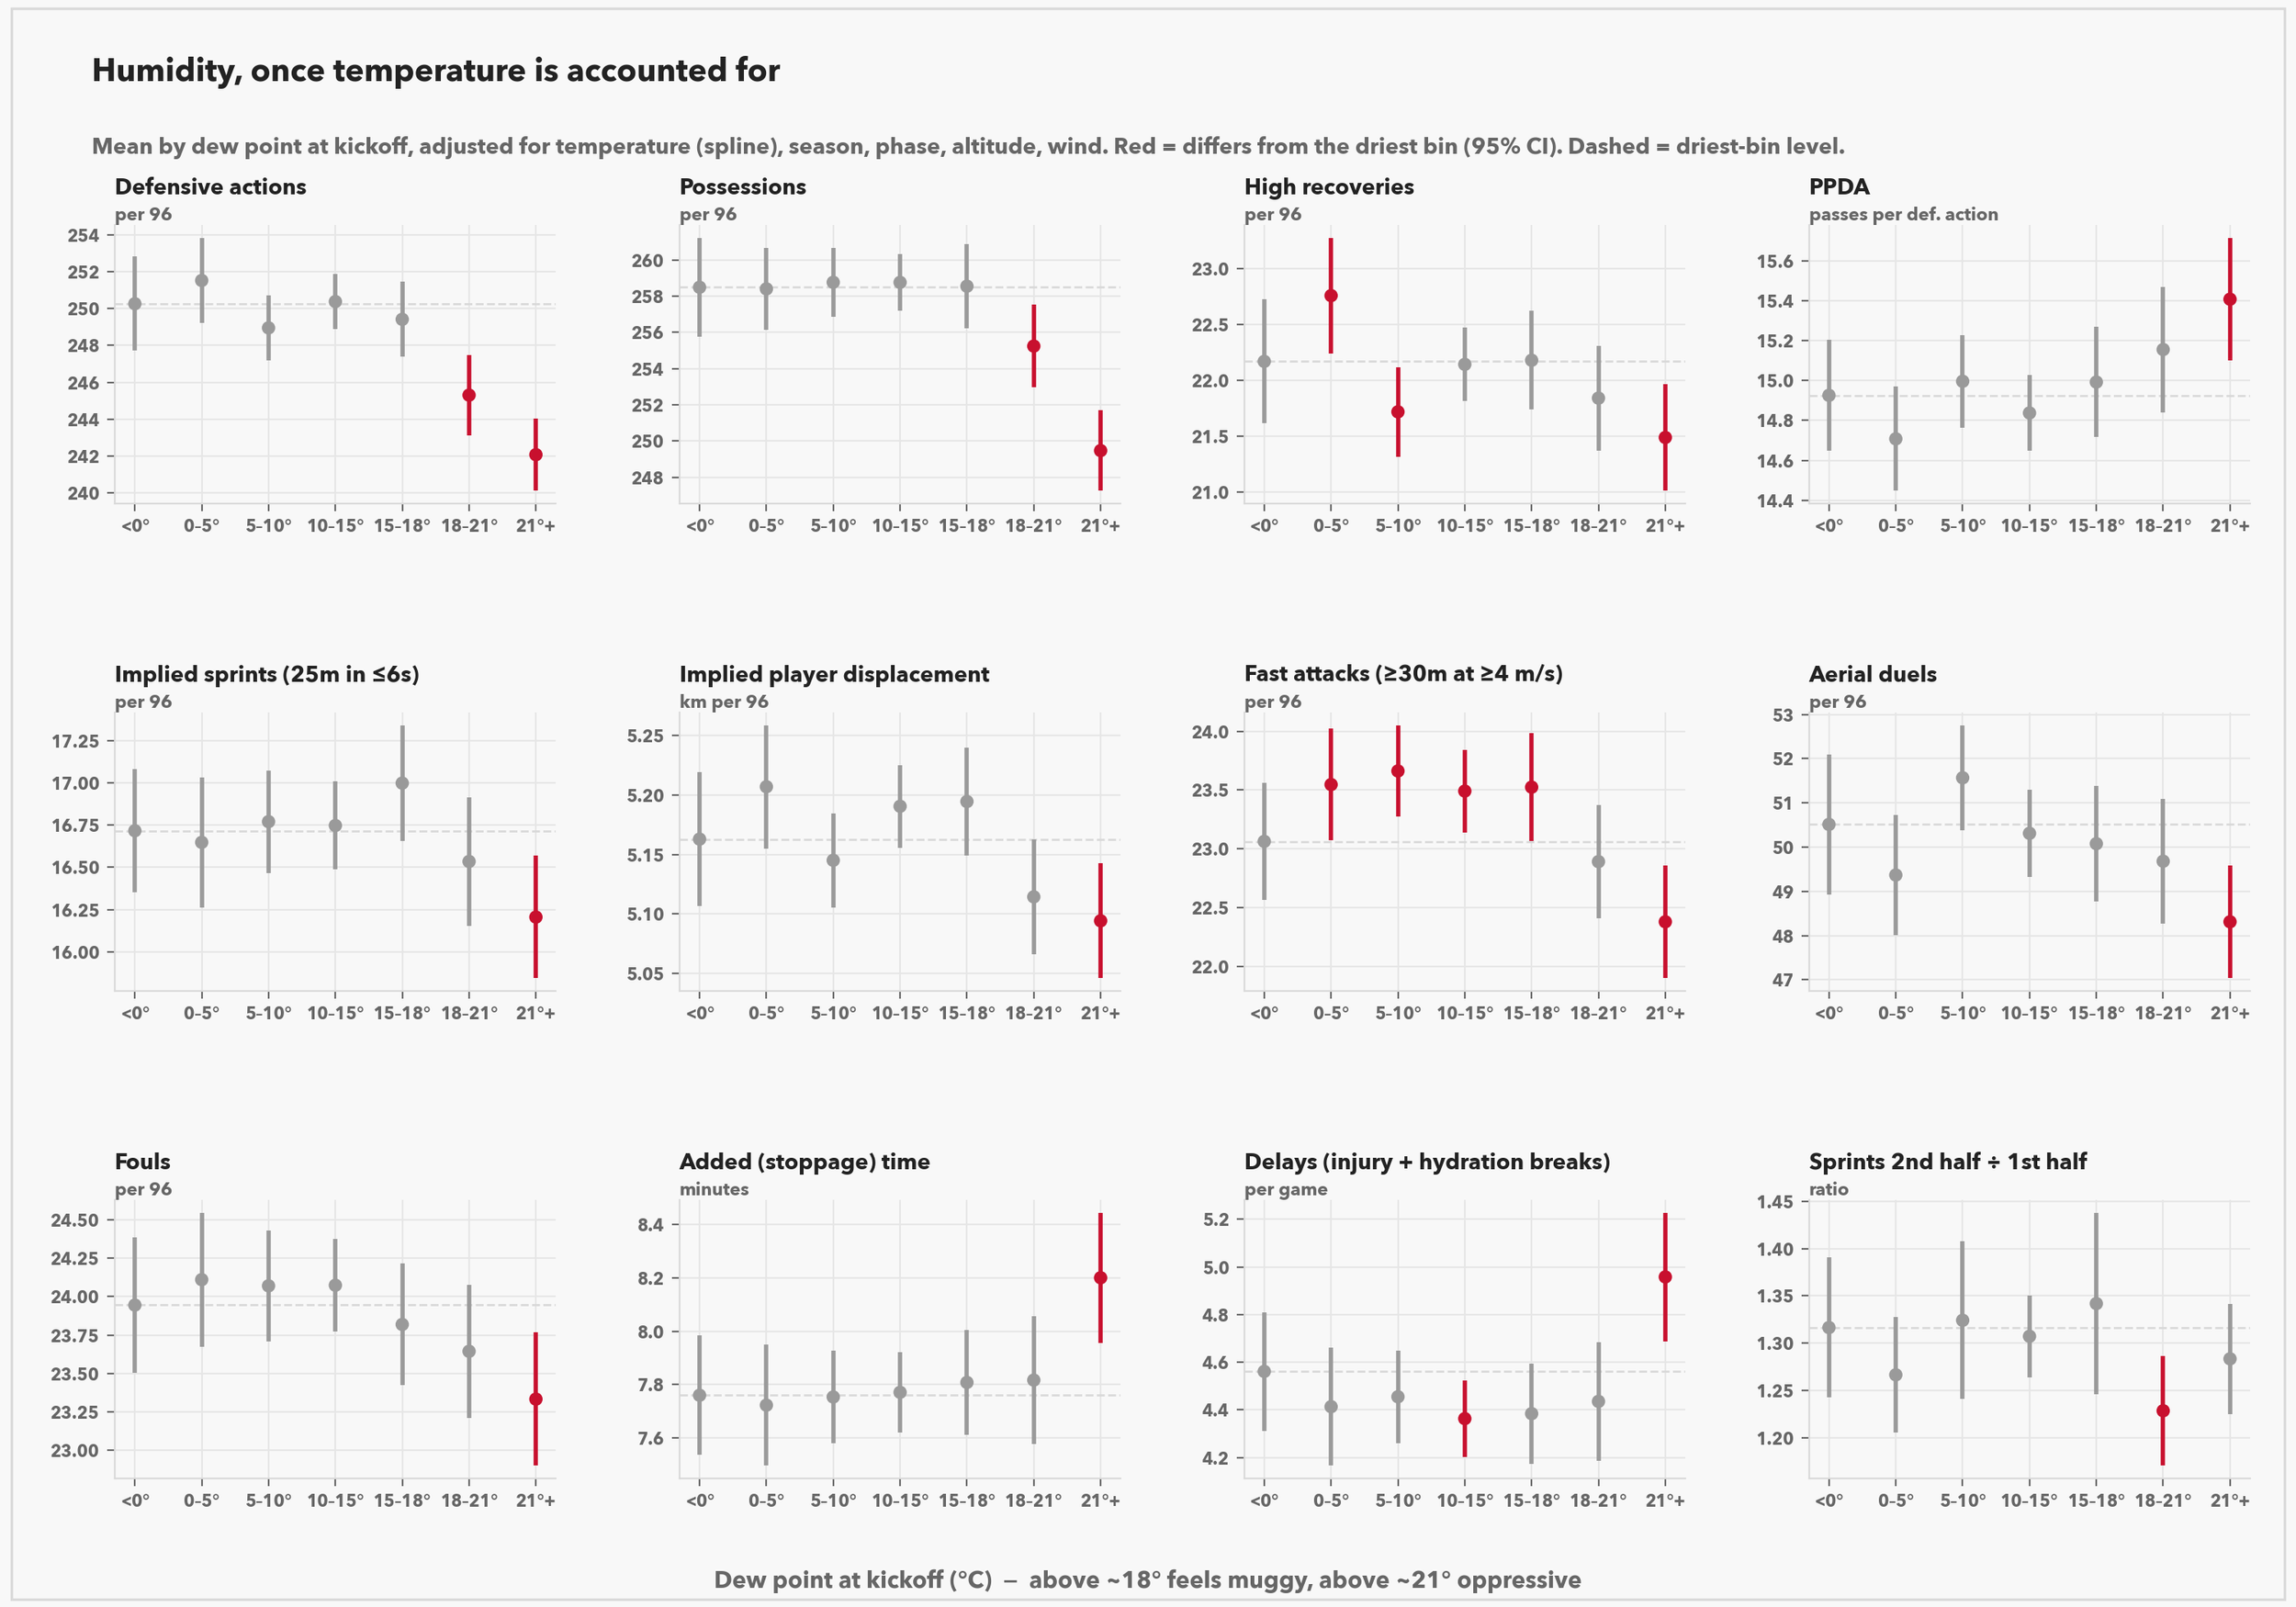
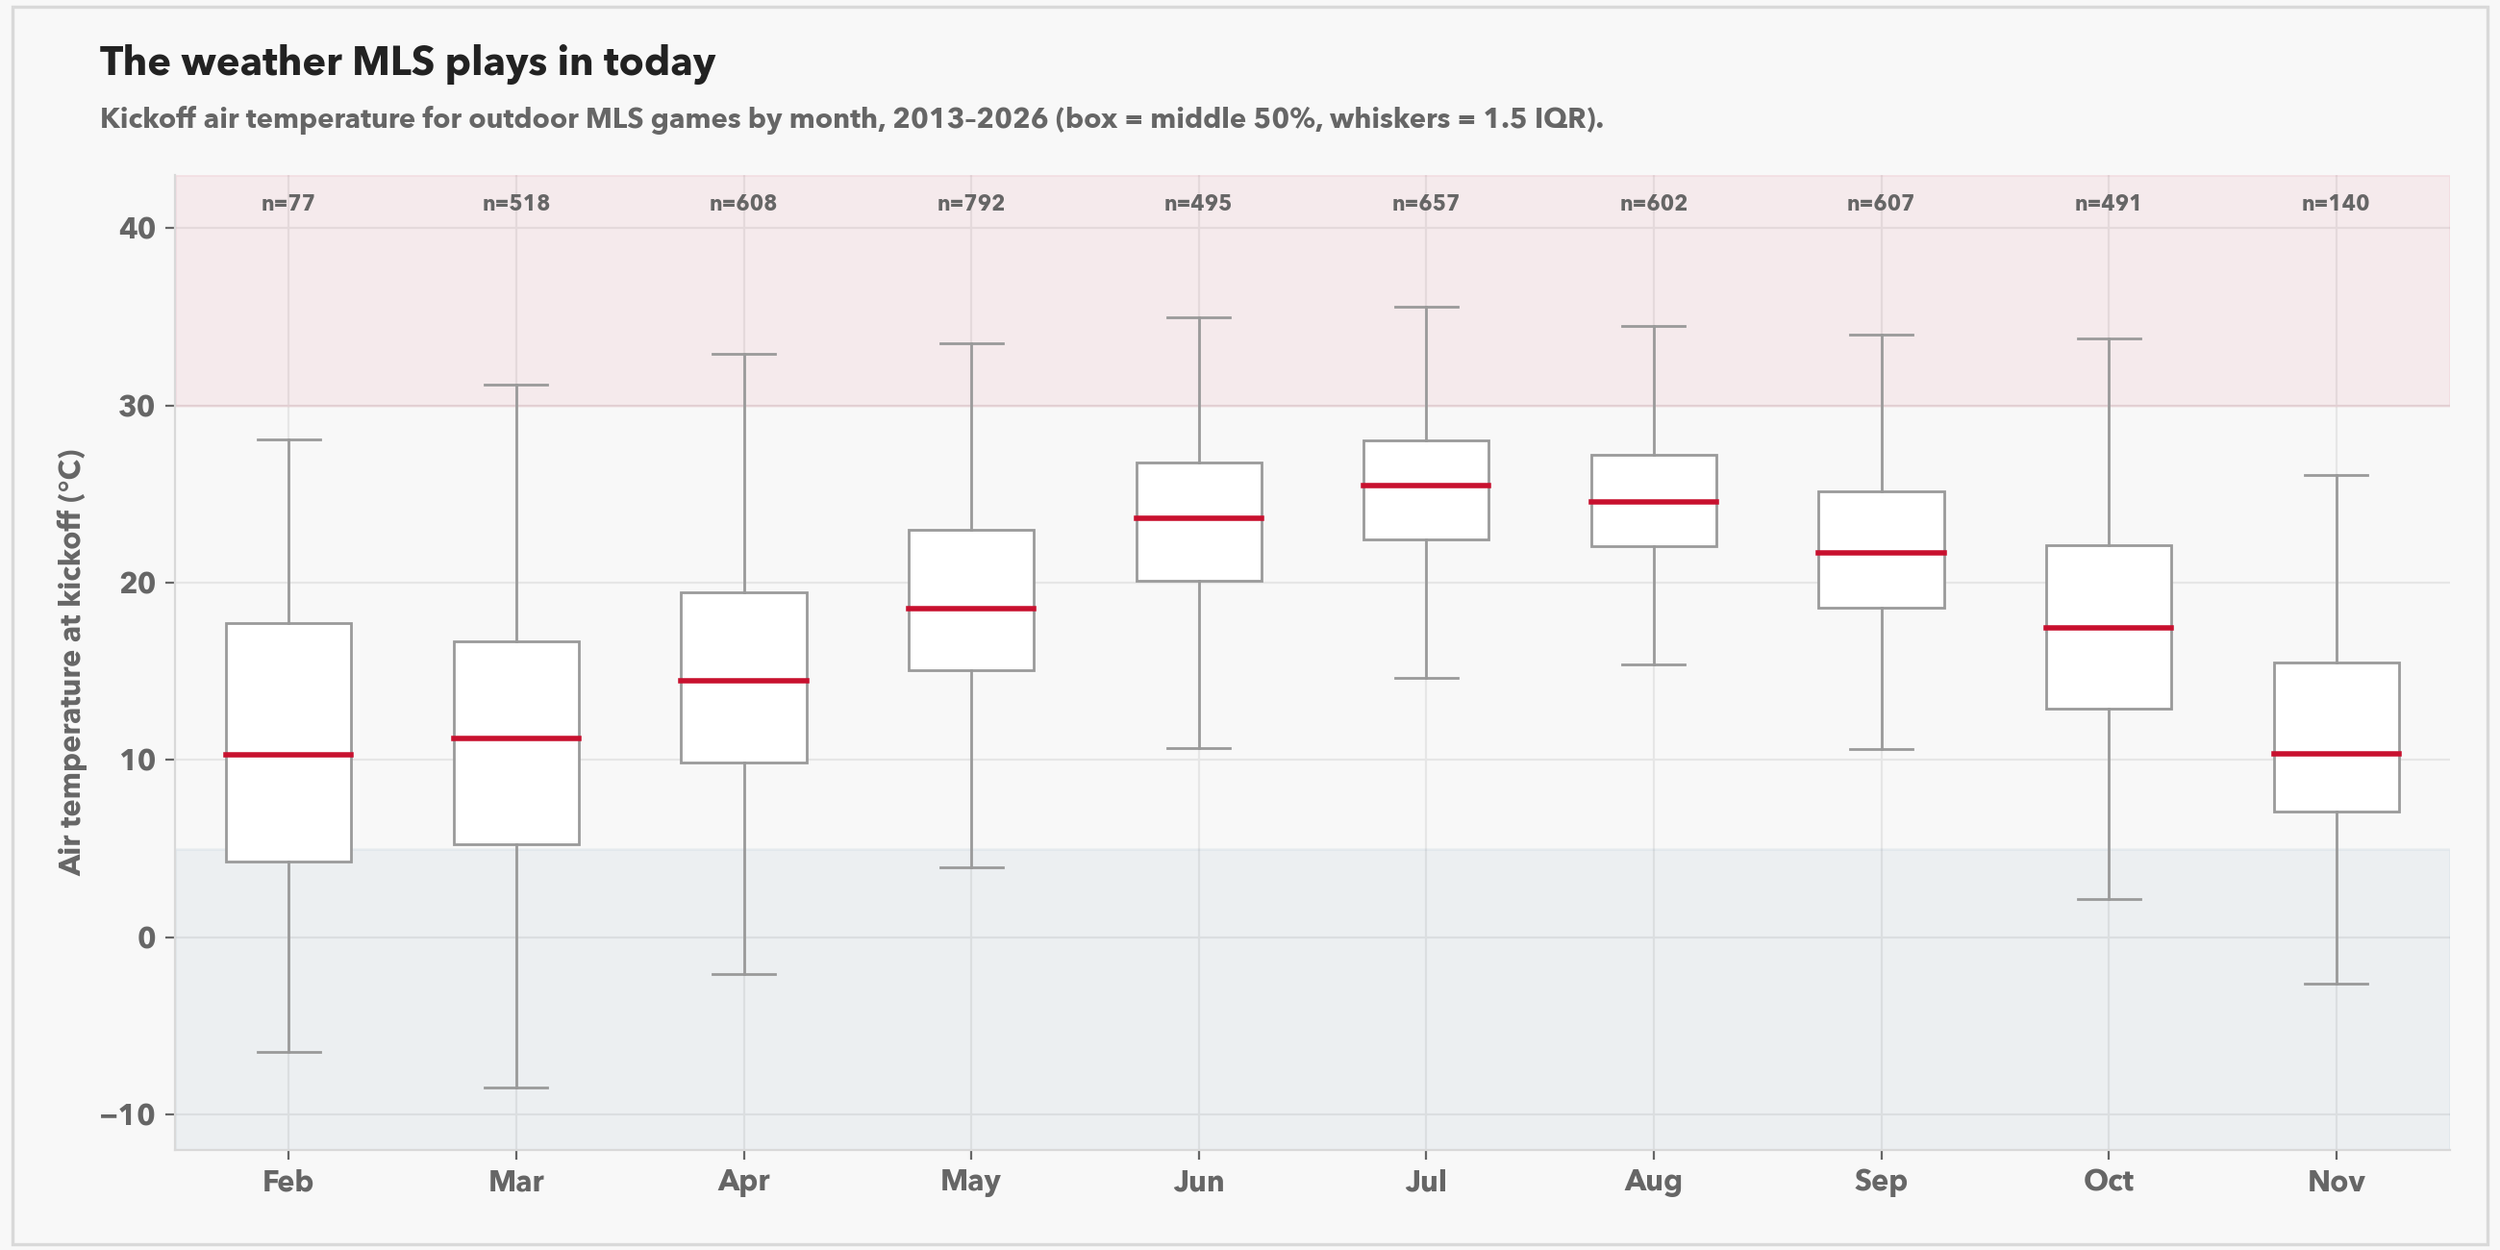
We can do the exact same thing for temperature (in Celsius, because I’m not a God-less heathen) and humidity. All the weather data comes from ERA5 reanalysis (Copernicus Climate Change Service / ECMWF), accessed through Open-Meteo.com: hourly temperature, humidity, precipitation and wind at each stadium, averaged over the two hours from kickoff.
Those are some awfully straight lines. Hot bad for soccer. It is hilarious how correlated it getting hotter and people not wanting to defend is. I get it. On the flip side, there doesn’t appear to be any appreciable downside to cold matches, at least in terms of the “intensity” of matches. We see the same trend with humidity, when it’s hot and humid and wet you simply don’t want to do anything and when it’s dry it’s the same as everything else. This inherently makes sense to me, I played college soccer in Canada which plays a fall season. Our playoffs take place at the same time as the MLS playoffs, and our National Championship is in the middle of November. In most of Canada, that is frigid. When it’s cold, you run to warm up. You feel better by running!
Love Grows Colder in the Winter
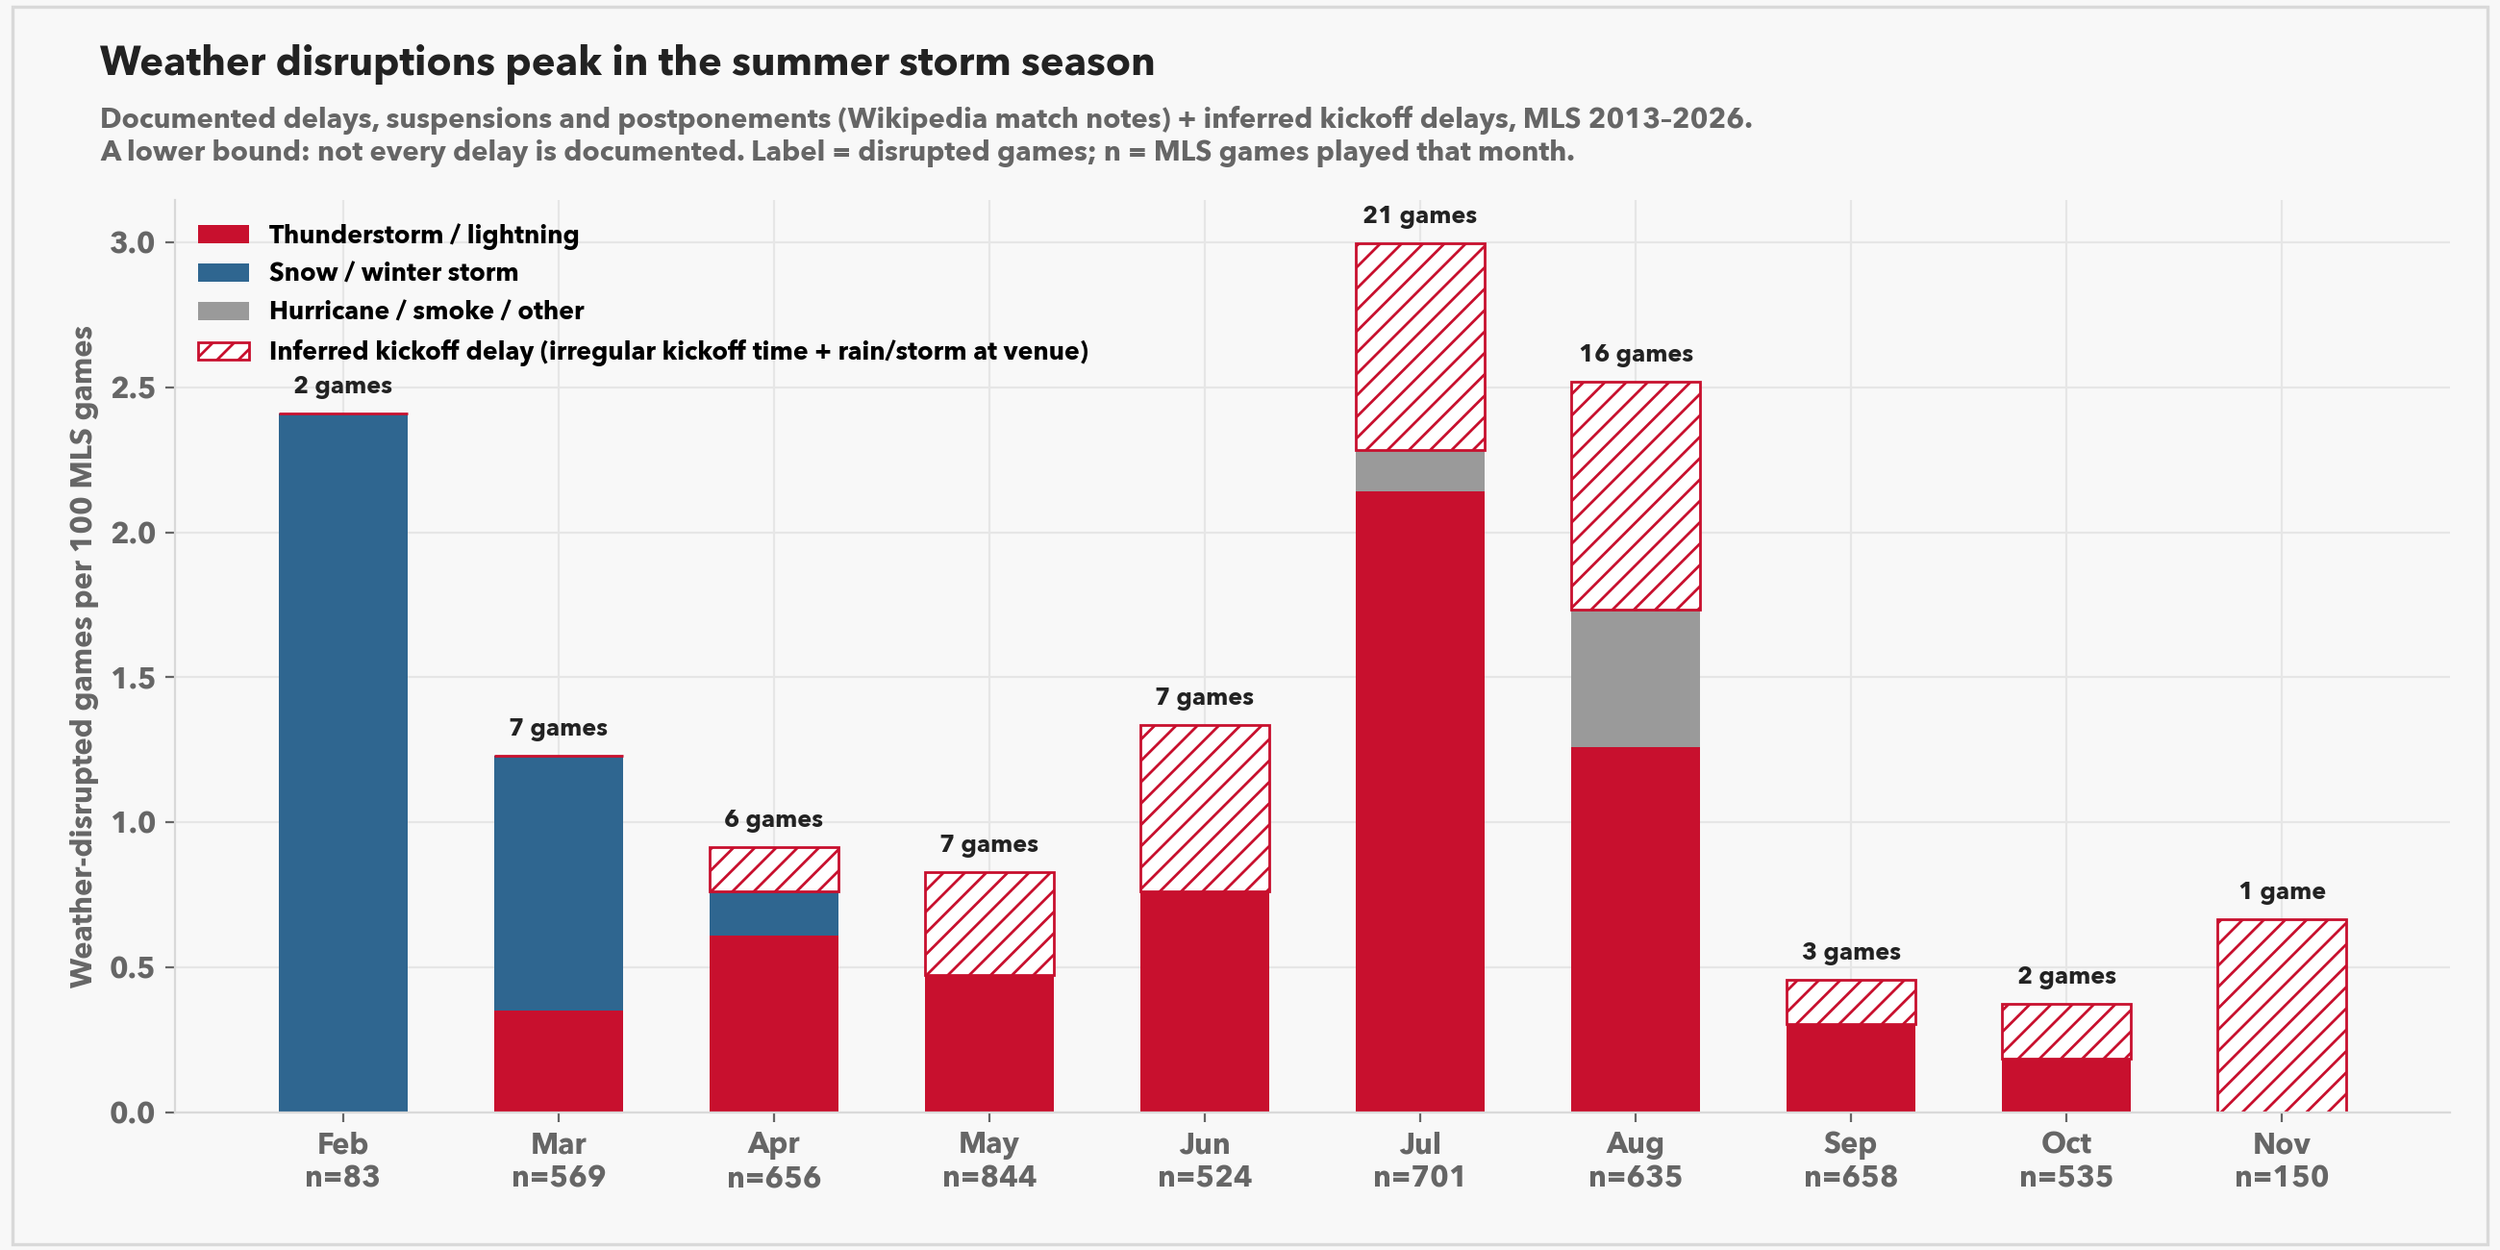
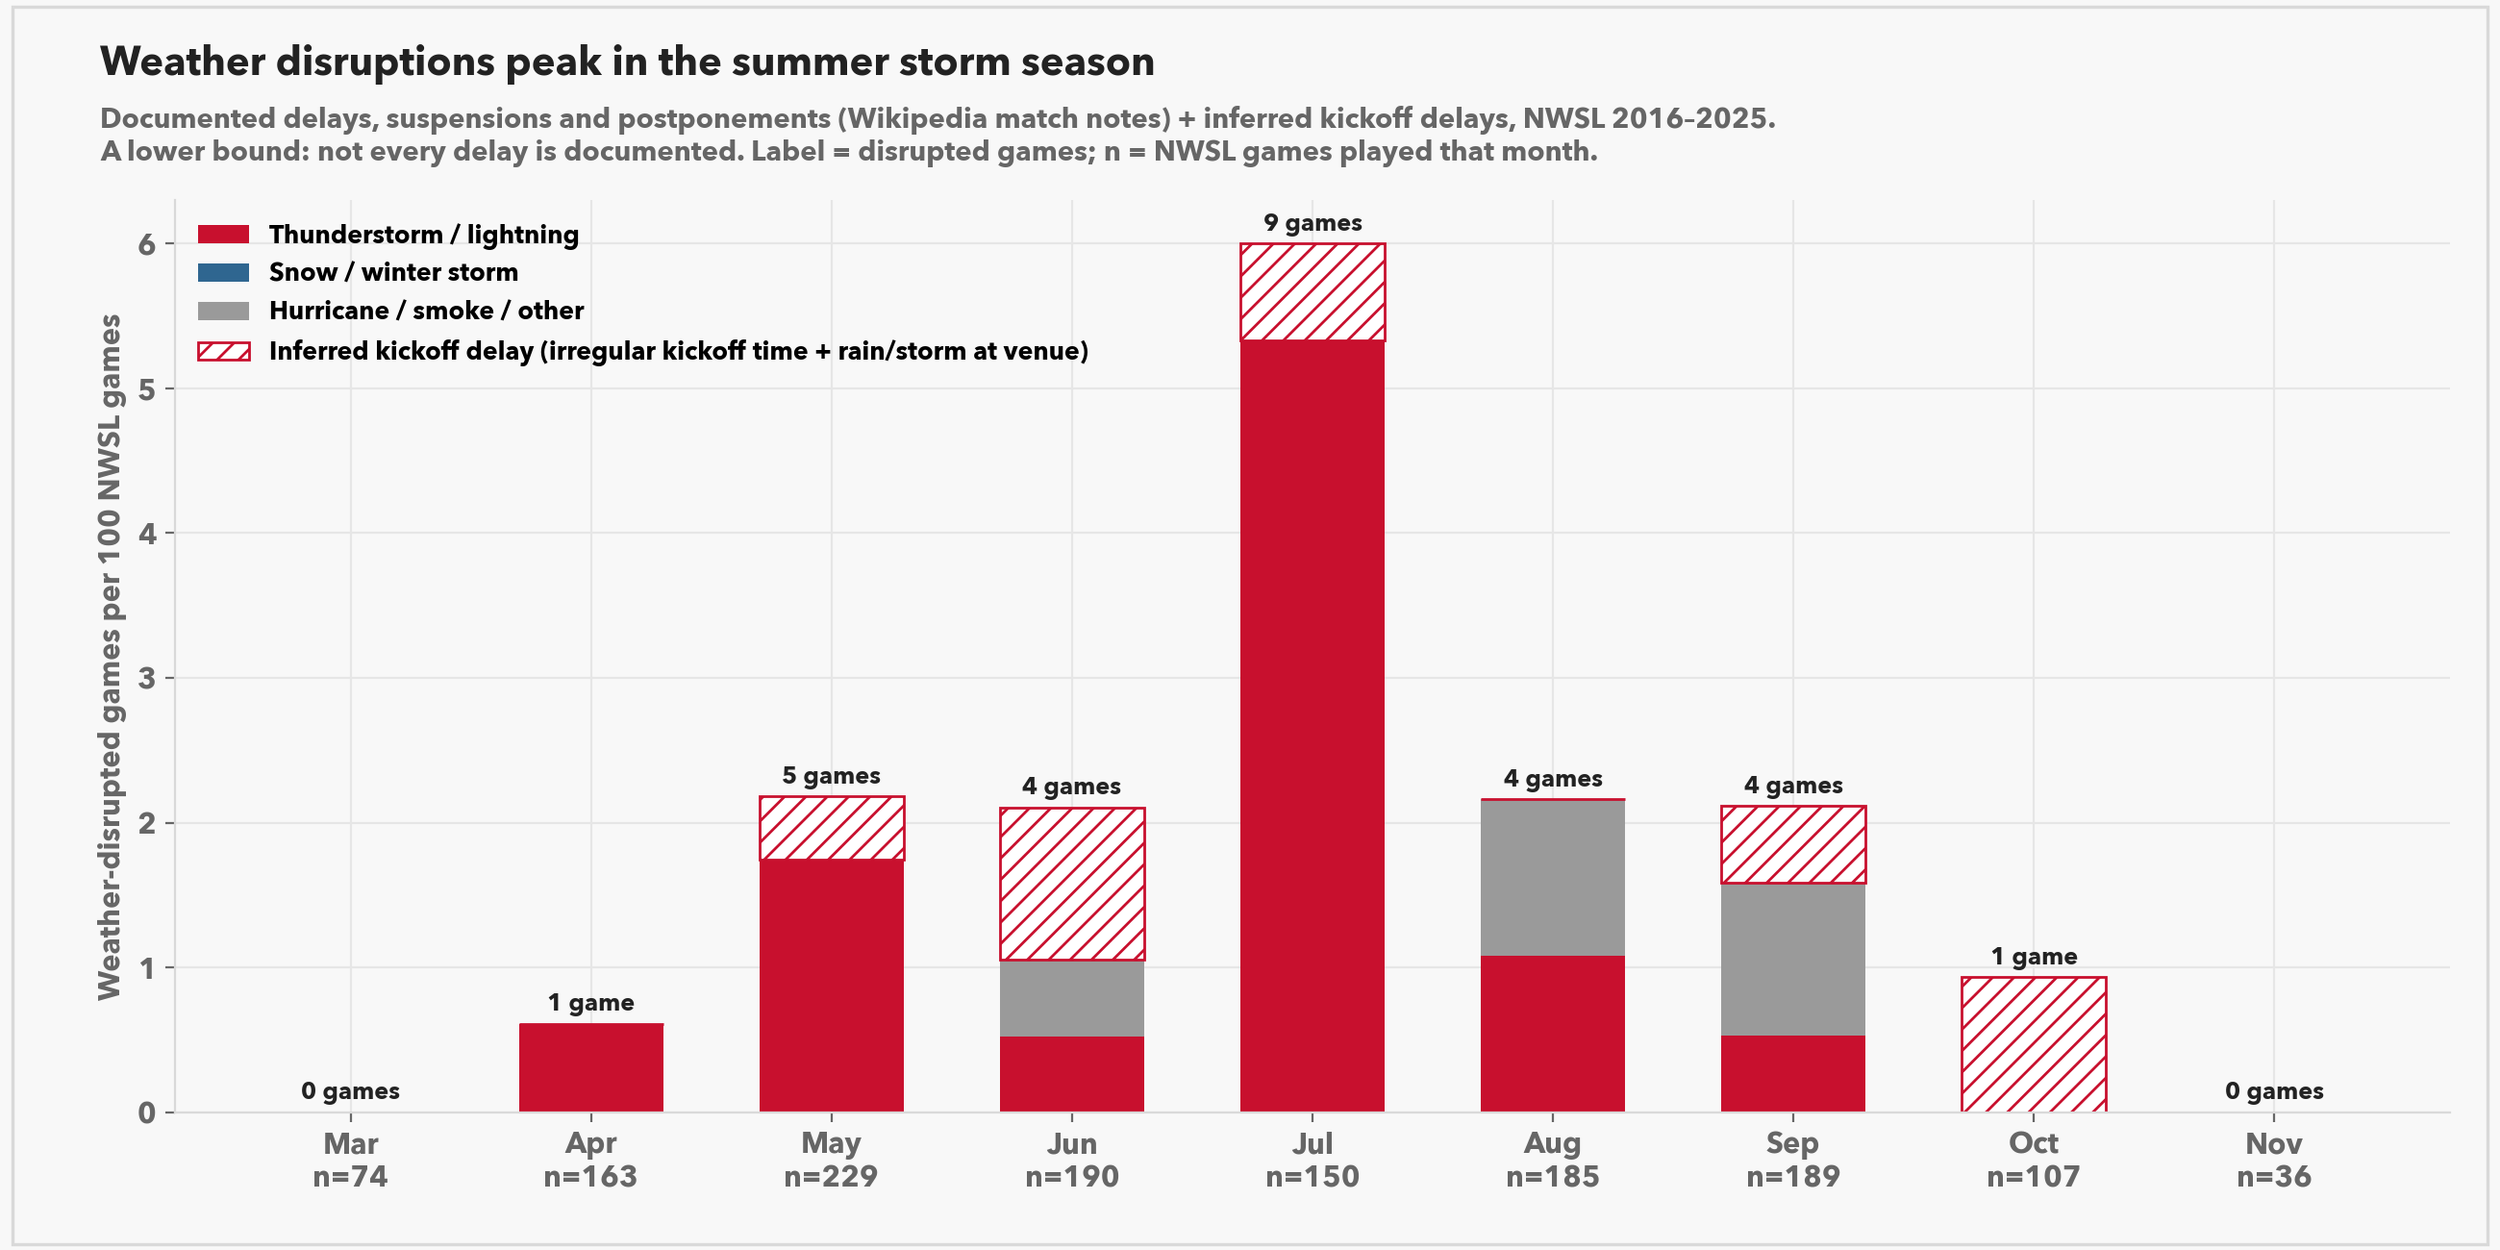
A frequently repeated argument against the cold winter games is that we’re going to get a plethora of snowed out games, and that’s going to cause fixture havoc later. This seems not really to be the case. Only eight matches have ever been snowed out (seven postponements, one delayed kickoff). Conversely, summer thunderstorms have been a real issue for MLS. More or less every fandom has a story tied to finishing a match at 3 AM in an empty stadium because of a lightning delay. I’ve plotted it here based on what I can pull from Wikipedia and unusual actual kickoff times plus the weather data we have, but I couldn’t figure out a way to see mid-match lightning delays - so I’d suspect those June/July/August numbers to be much higher in reality.
If we shift the calendar around accordingly, dropping part of May, all of June, and some of July and adding more December/February games, I project approximately three more weather disrupted games per season based on this data. In an ideal world, dropping July/August would probably be most beneficial in terms of avoiding weather disruptions, so the start date in July will be pretty critical.
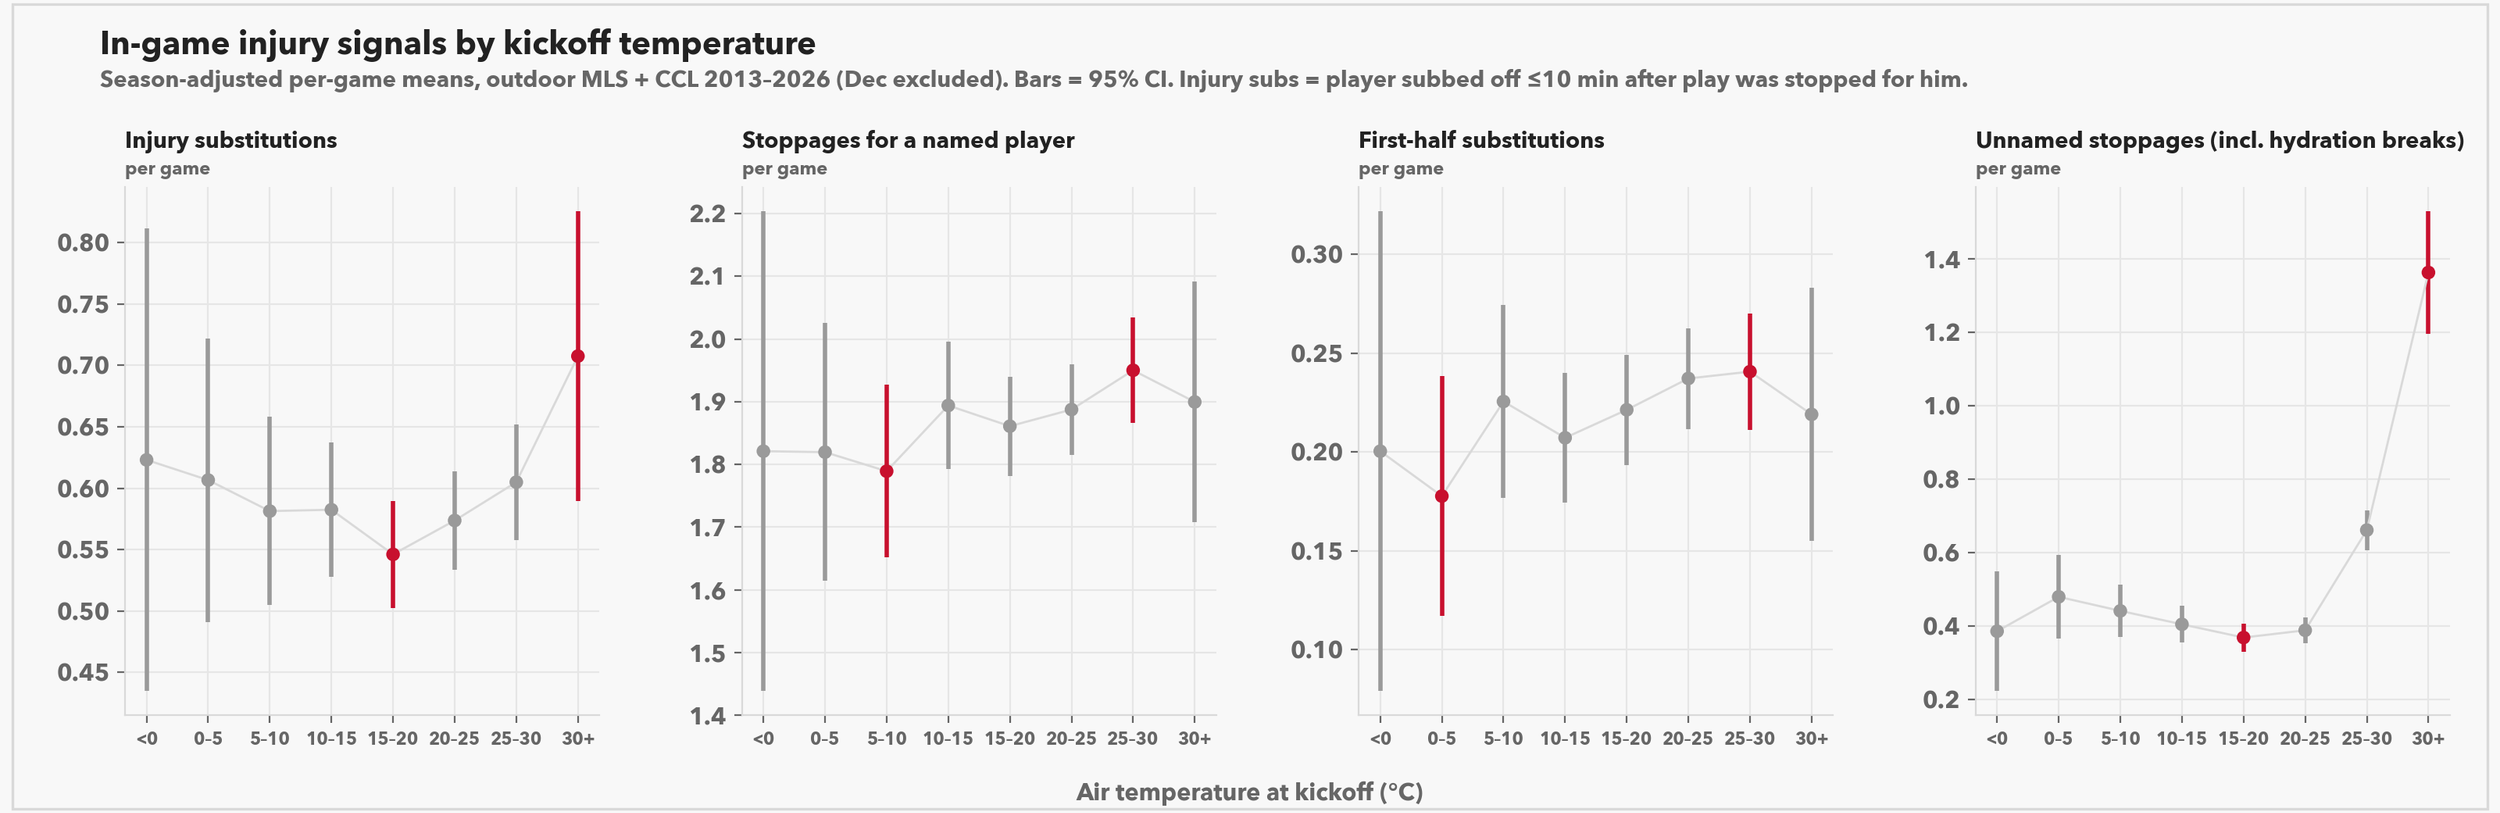
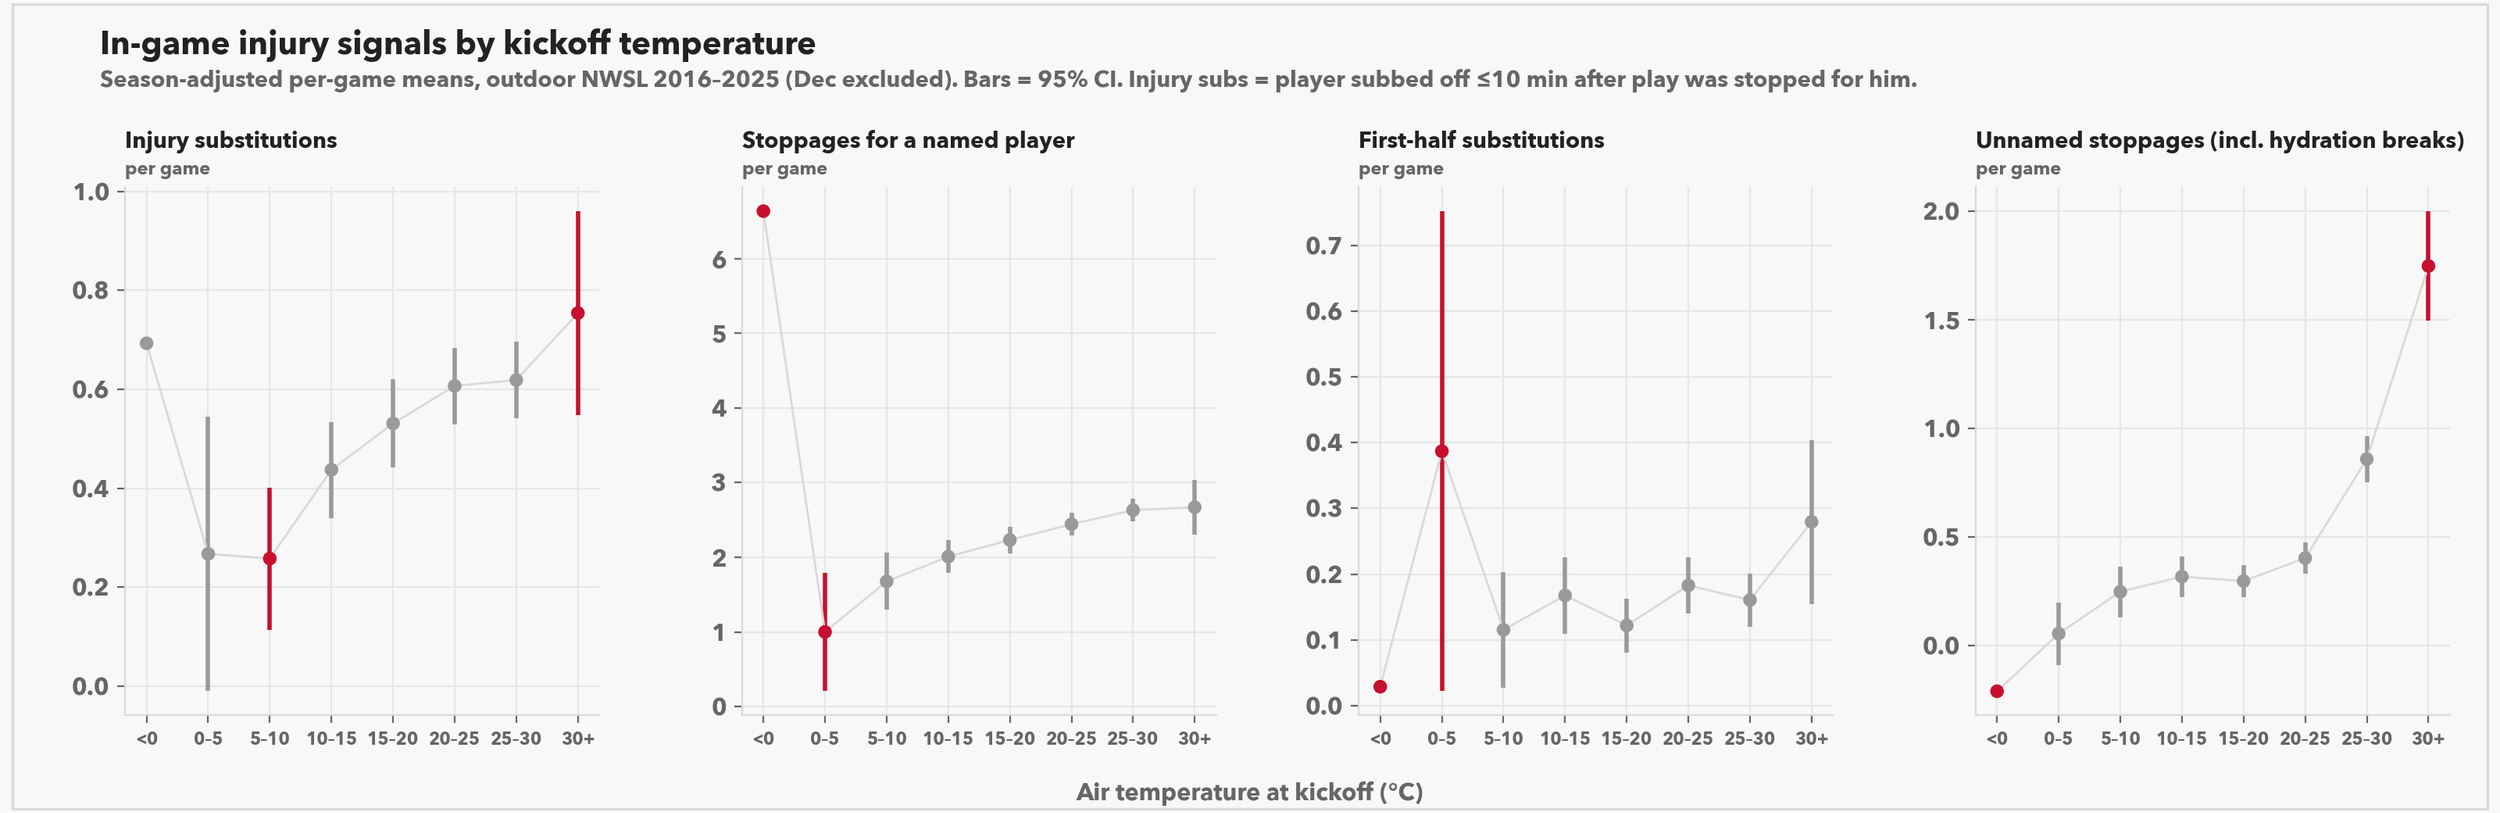
The other common refrain is that winter ball is dangerous. Players are going to get hurt. Pull muscles. Again, we’re somewhat limited by where to find injury data here. Transfermarkt has stuff by player but it’s kind of dubious. We can infer some injuries based on match context clues. For example, first half substitutions are almost always injury related, aside from a few players having howlers and getting yanked. Similarly, if a player goes down injured and there’s a delay to restarting play (the physios come out), that’s tagged in the event data. If that player is then immediately subbed, they’re actually injured.
Looking at the data this way, we see again, the heat is worse than the cold. The error bars are huge, but if you were going to take a trend it would be that hotter is worse and we don’t see meaningful signal that cold matches result in injuries.
The argument I can’t really refute with data is that watching matches in the cold is a worse fan experience. My personal politics are that you’re soft. Some of my fondest soccer memories are Canada 2-0 at Tim Horton’s Field, played at -11 ℃, Canada Mexico at the Iceteca was -17. Seattle’s victory over Toronto in 2016 was -12 with windchill. Cold! Put a toque on and enjoy the match.
Projecting the New Schedule
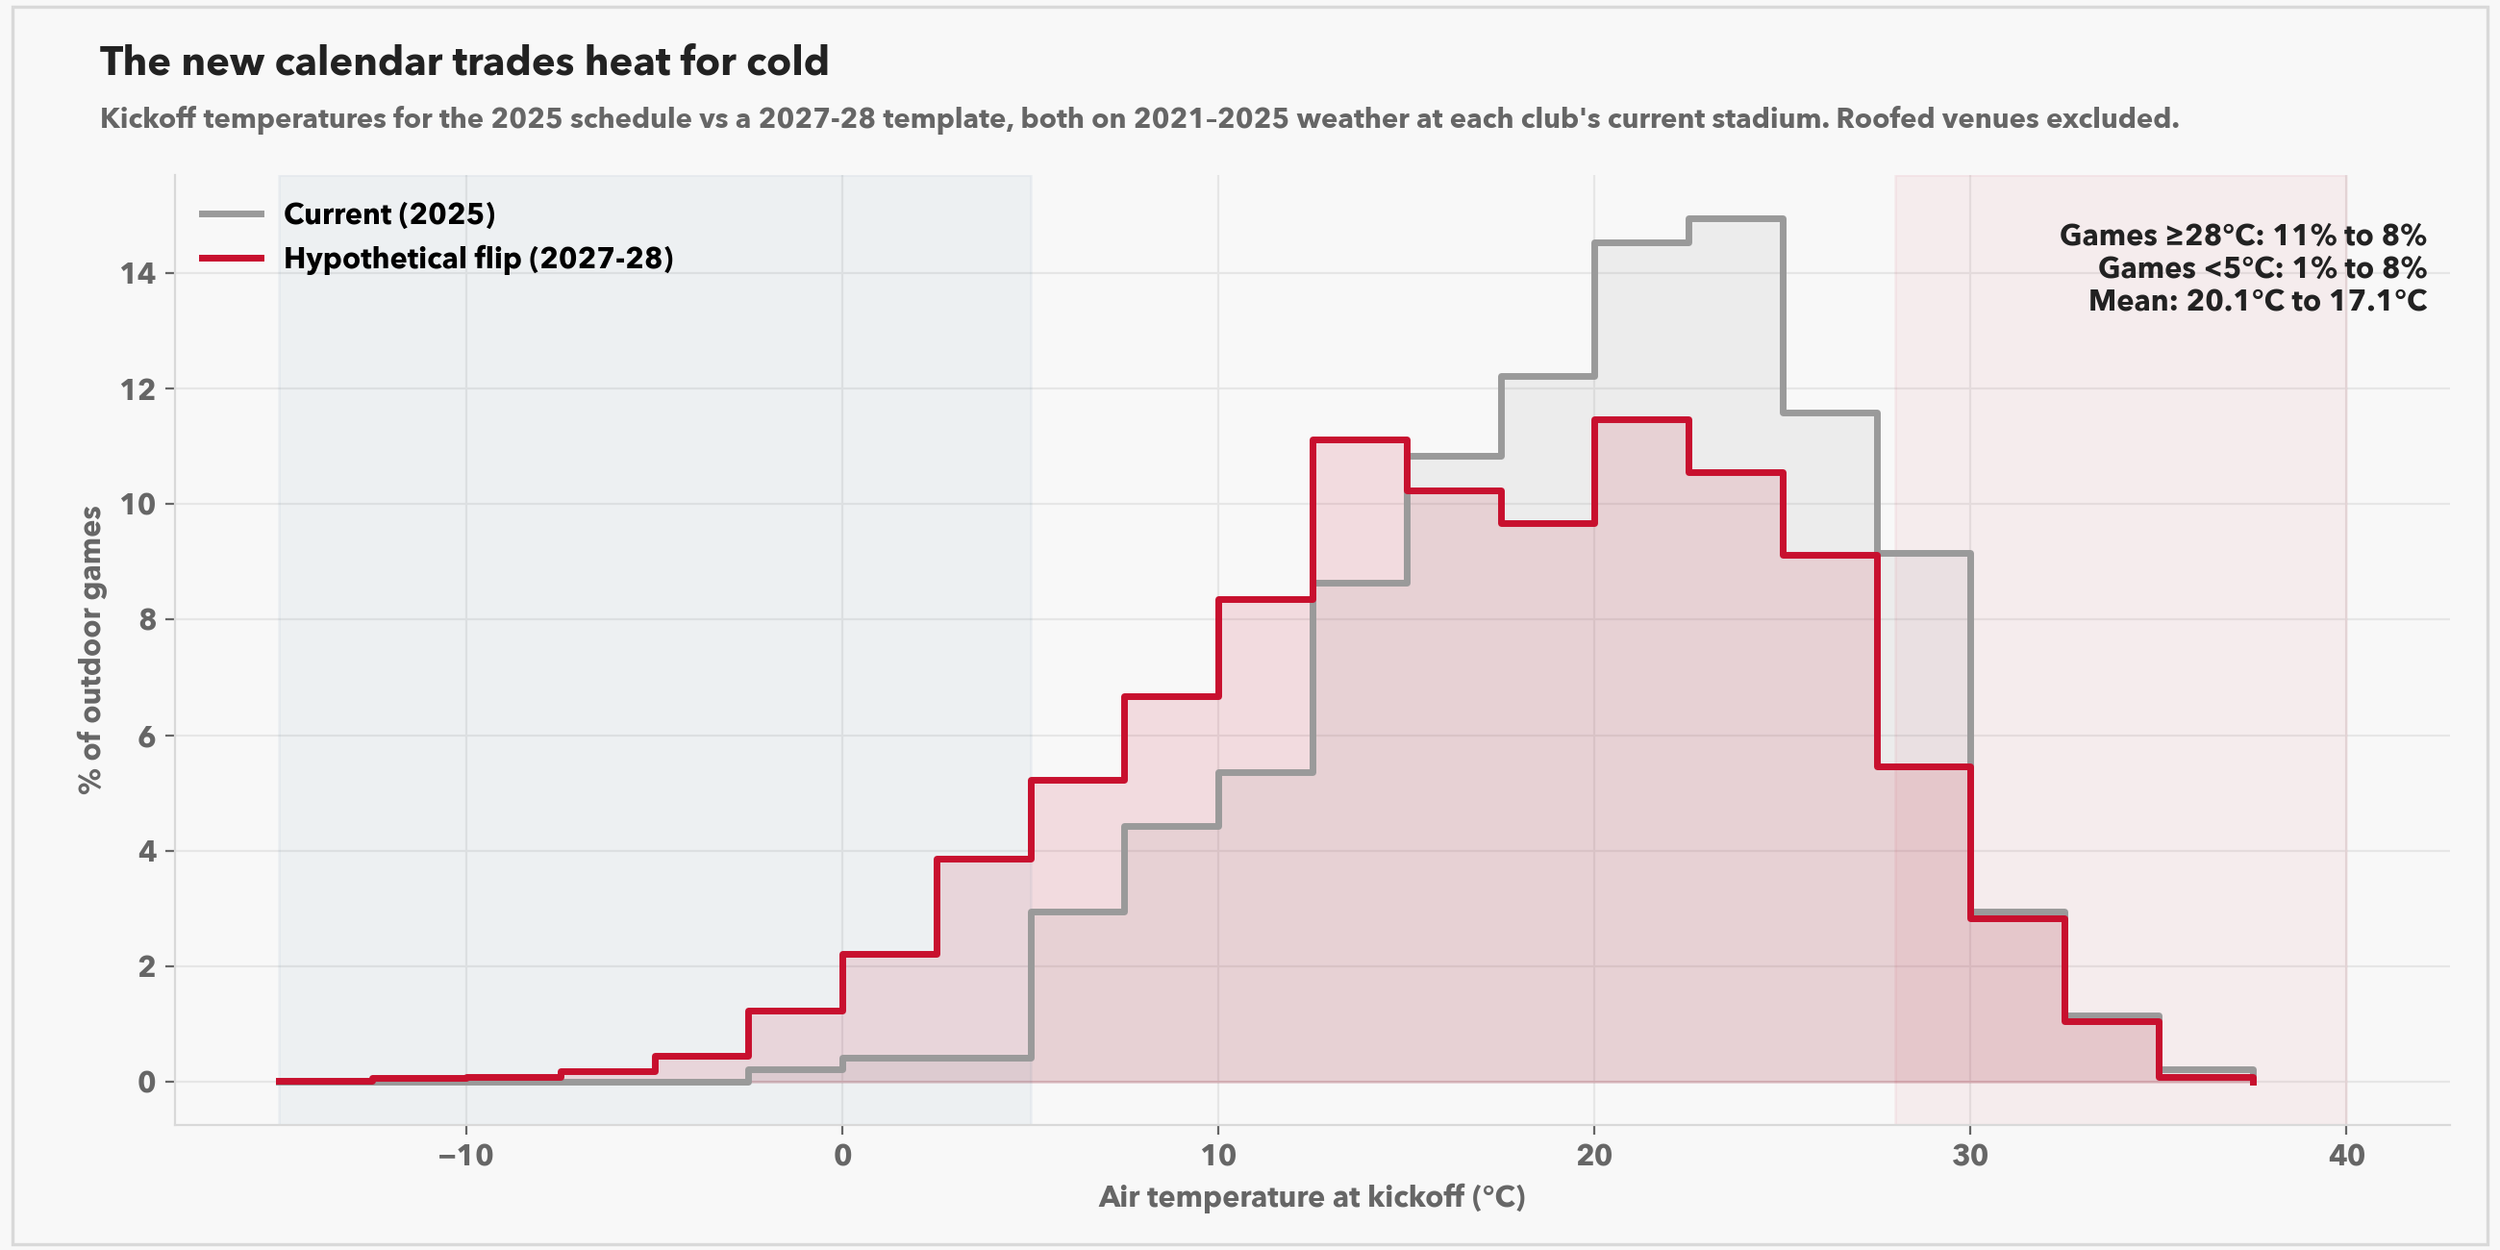
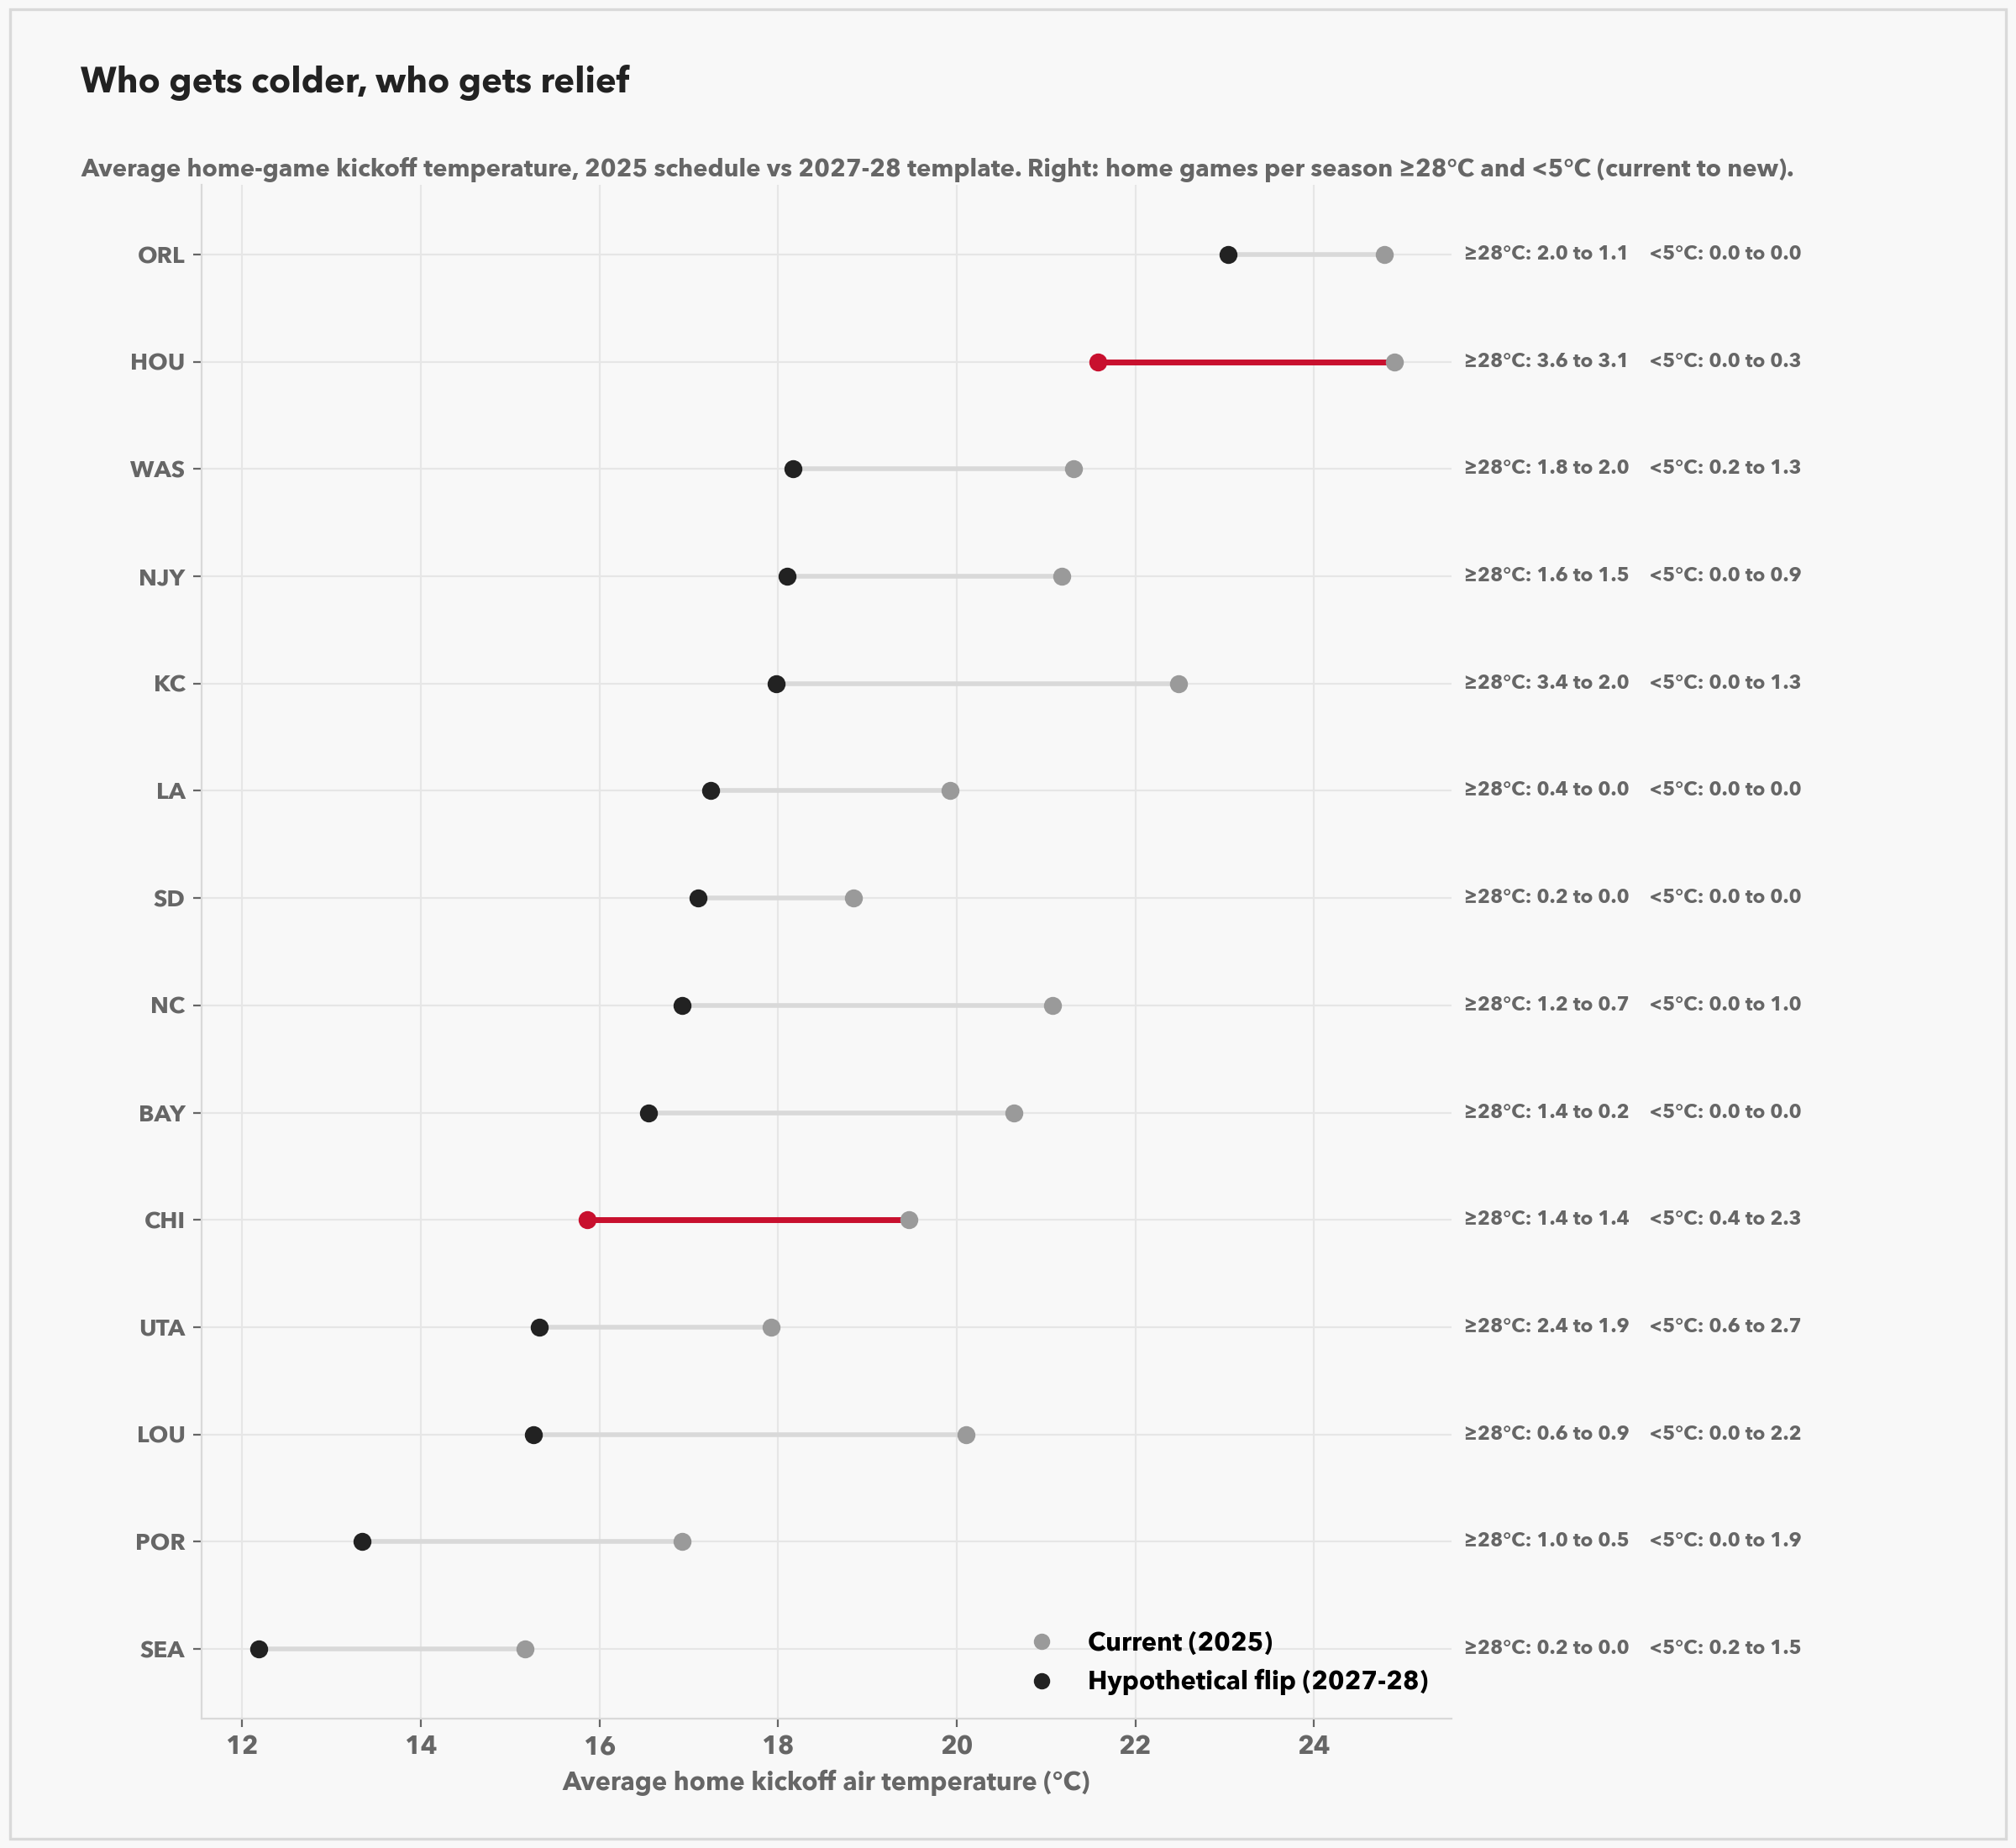
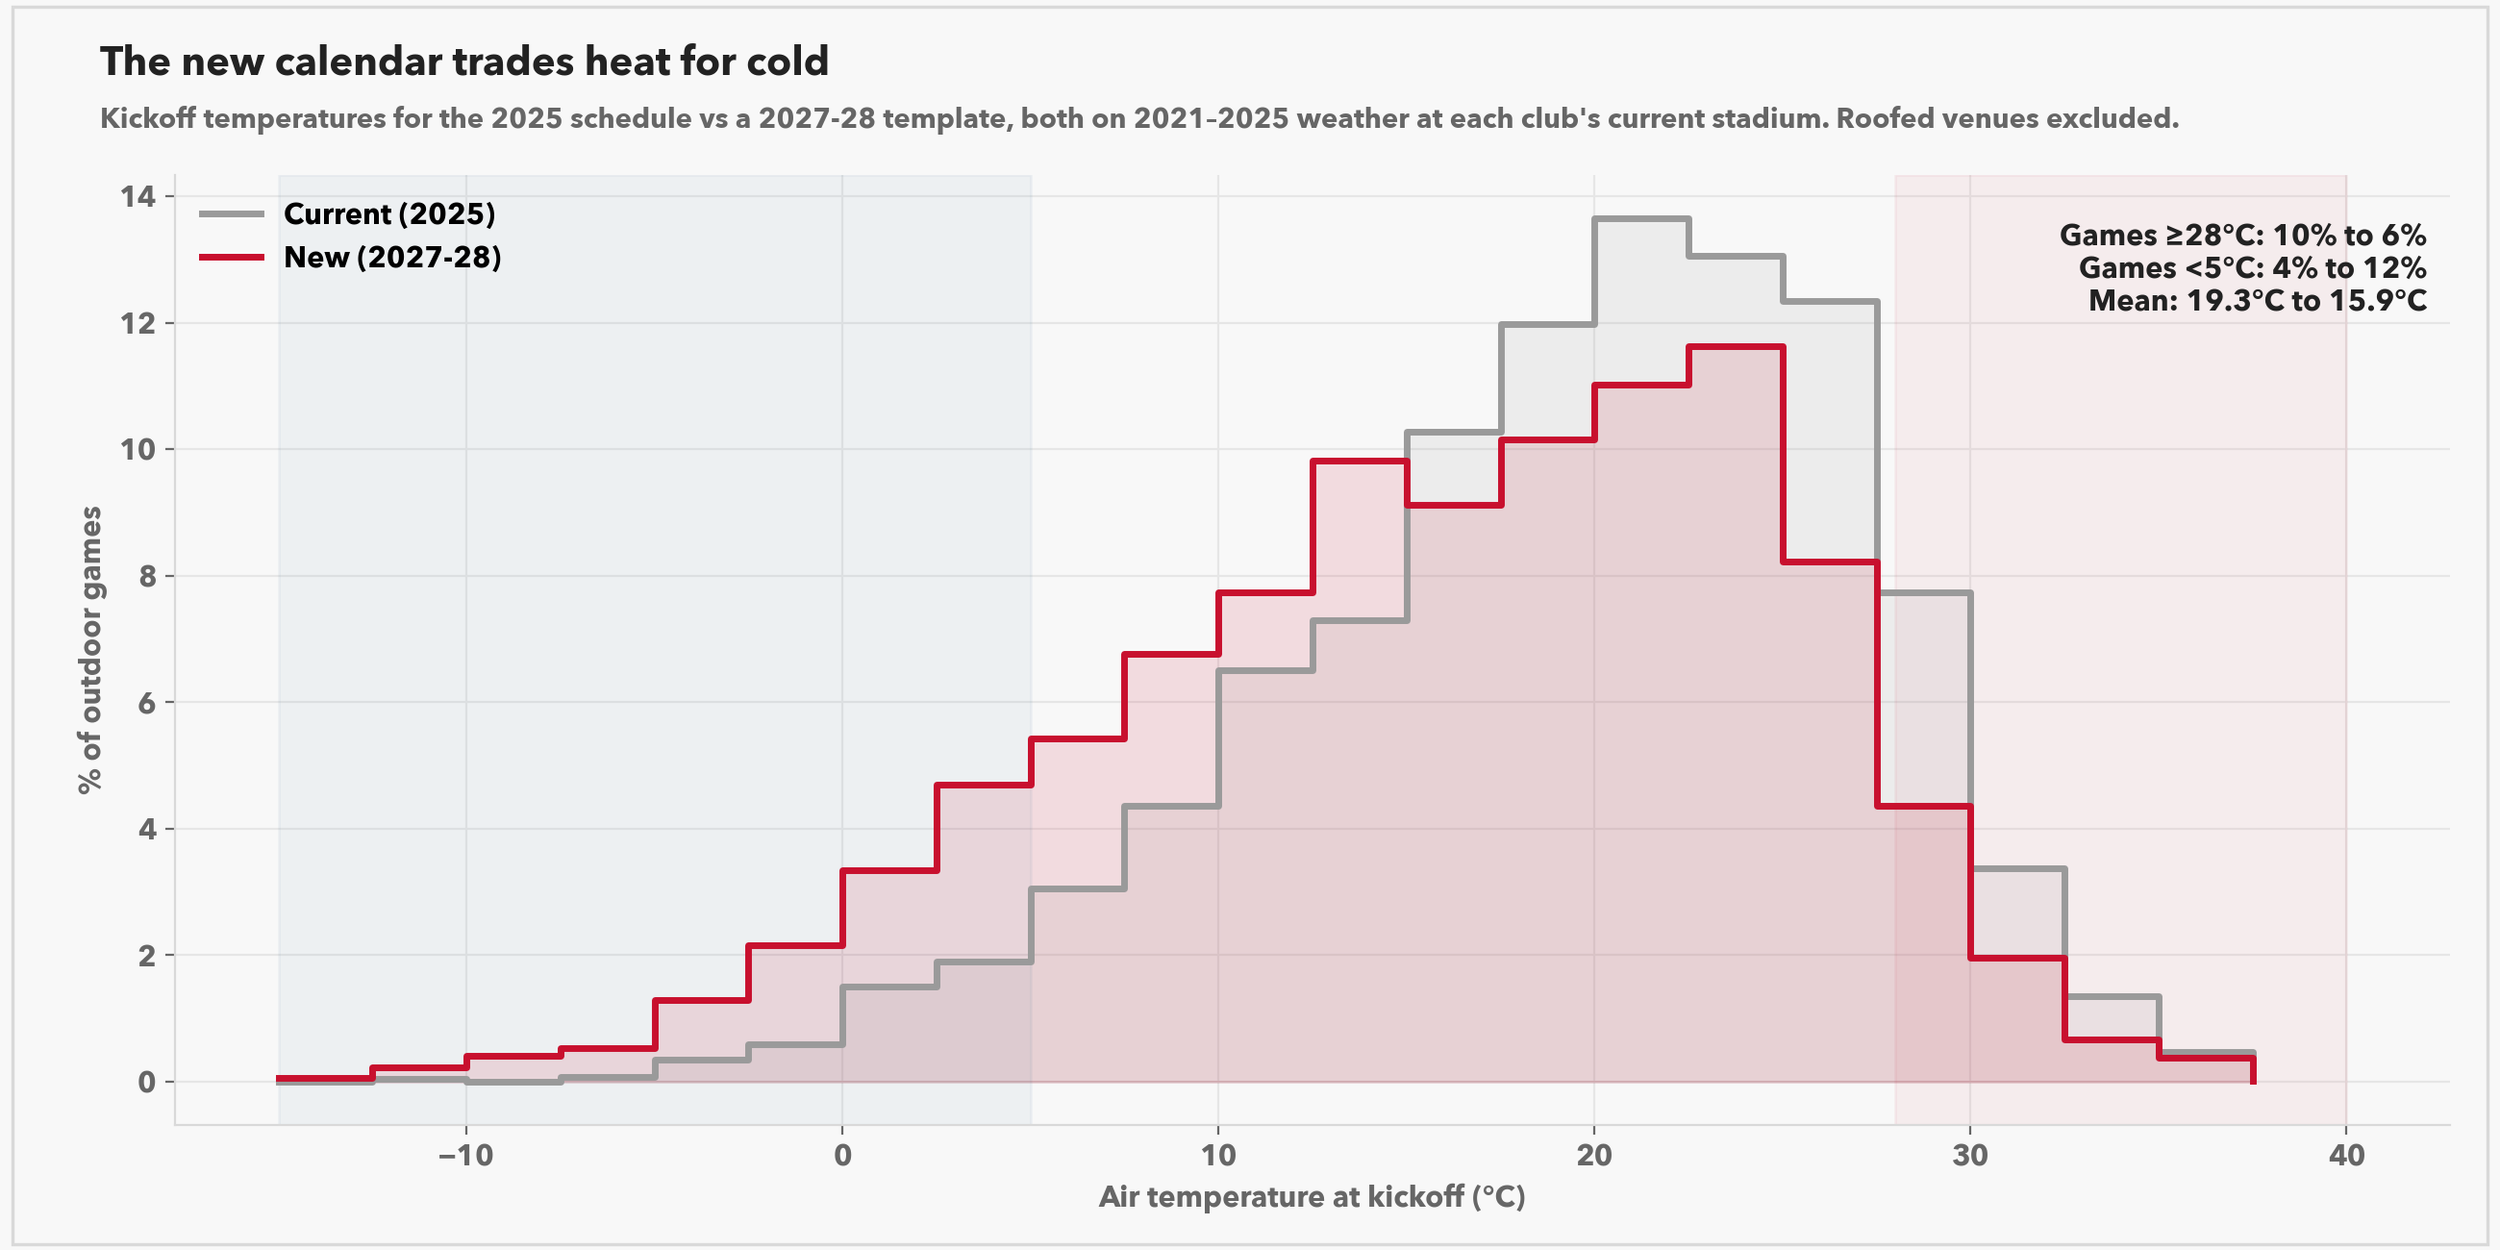
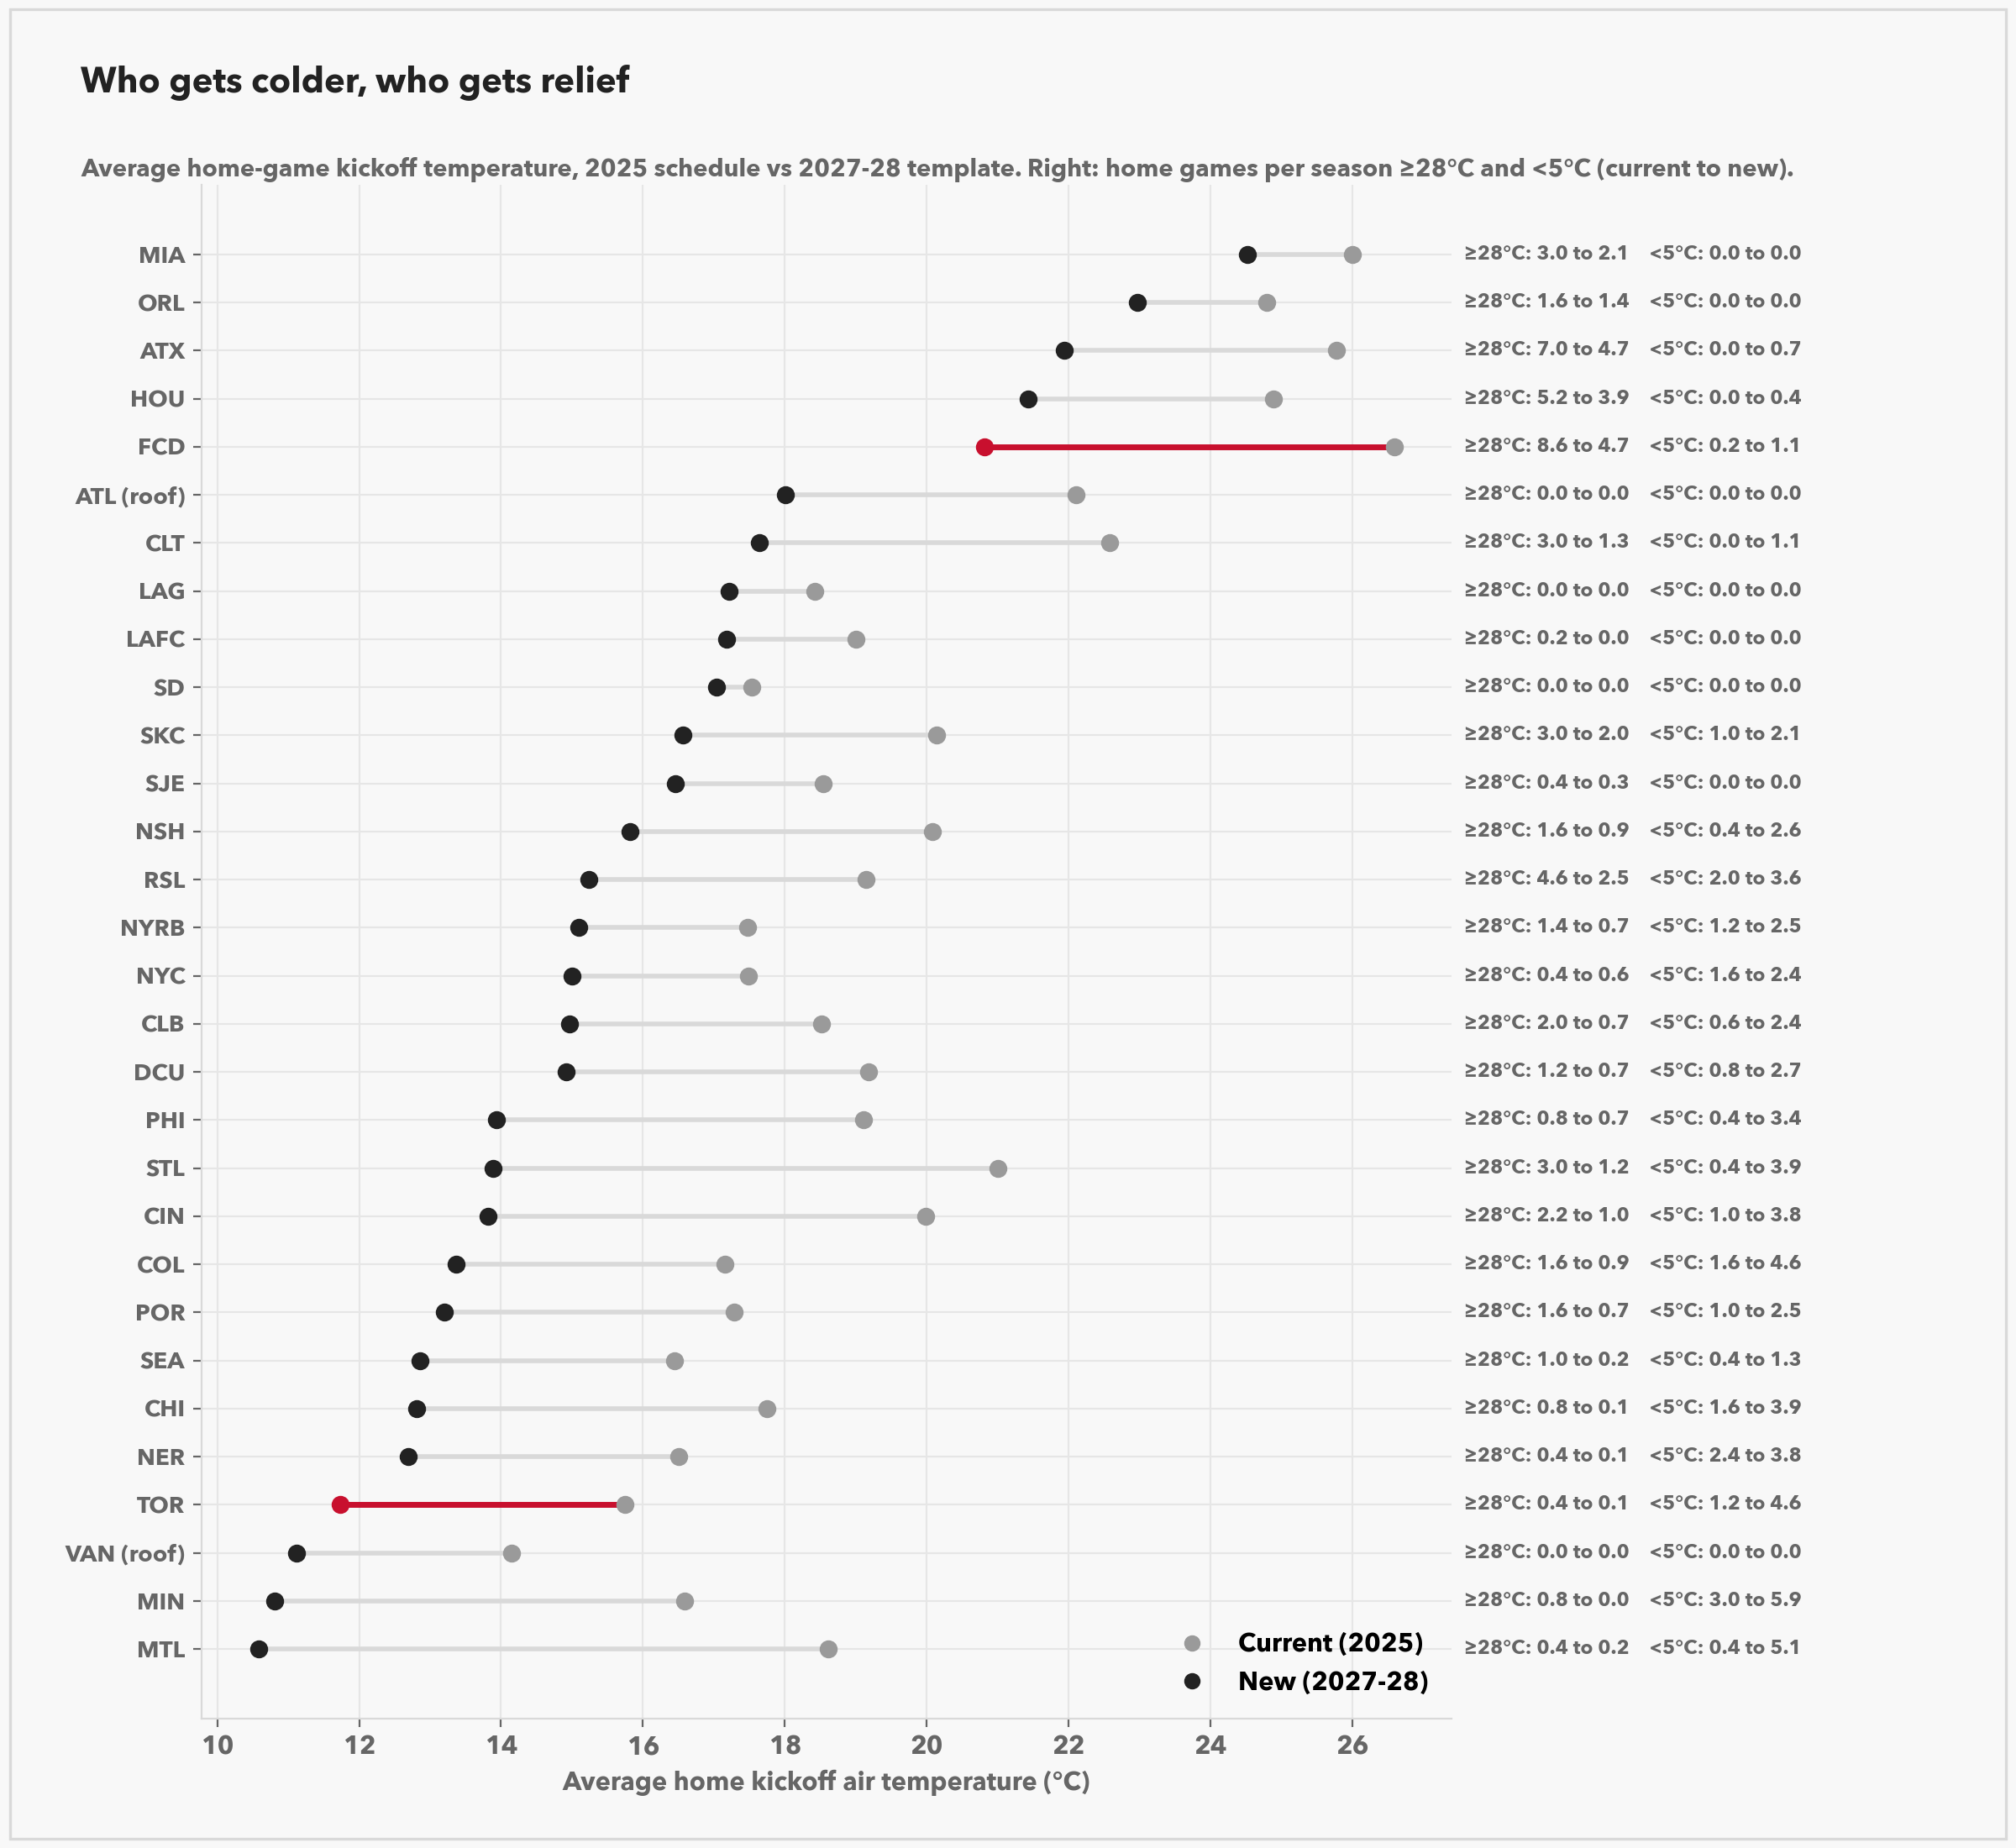
Based on roughly how the match counts need to adjust, we can project out how the weather that teams and the league as a whole will experience will change. You can see the league gets approximately 5 degrees C colder, with the most and least affected teams being common sense. Miami, Orlando, San Diego, and the two LA teams all stay more or less the same, the teams belonging to House Stark of Winterfell get a lot colder. This is something that can be minimized by clever league scheduling (or at least, being vaguely aware of the North American climate) but I didn’t really account for any creative schedules that see those teams play predominantly on the road here.
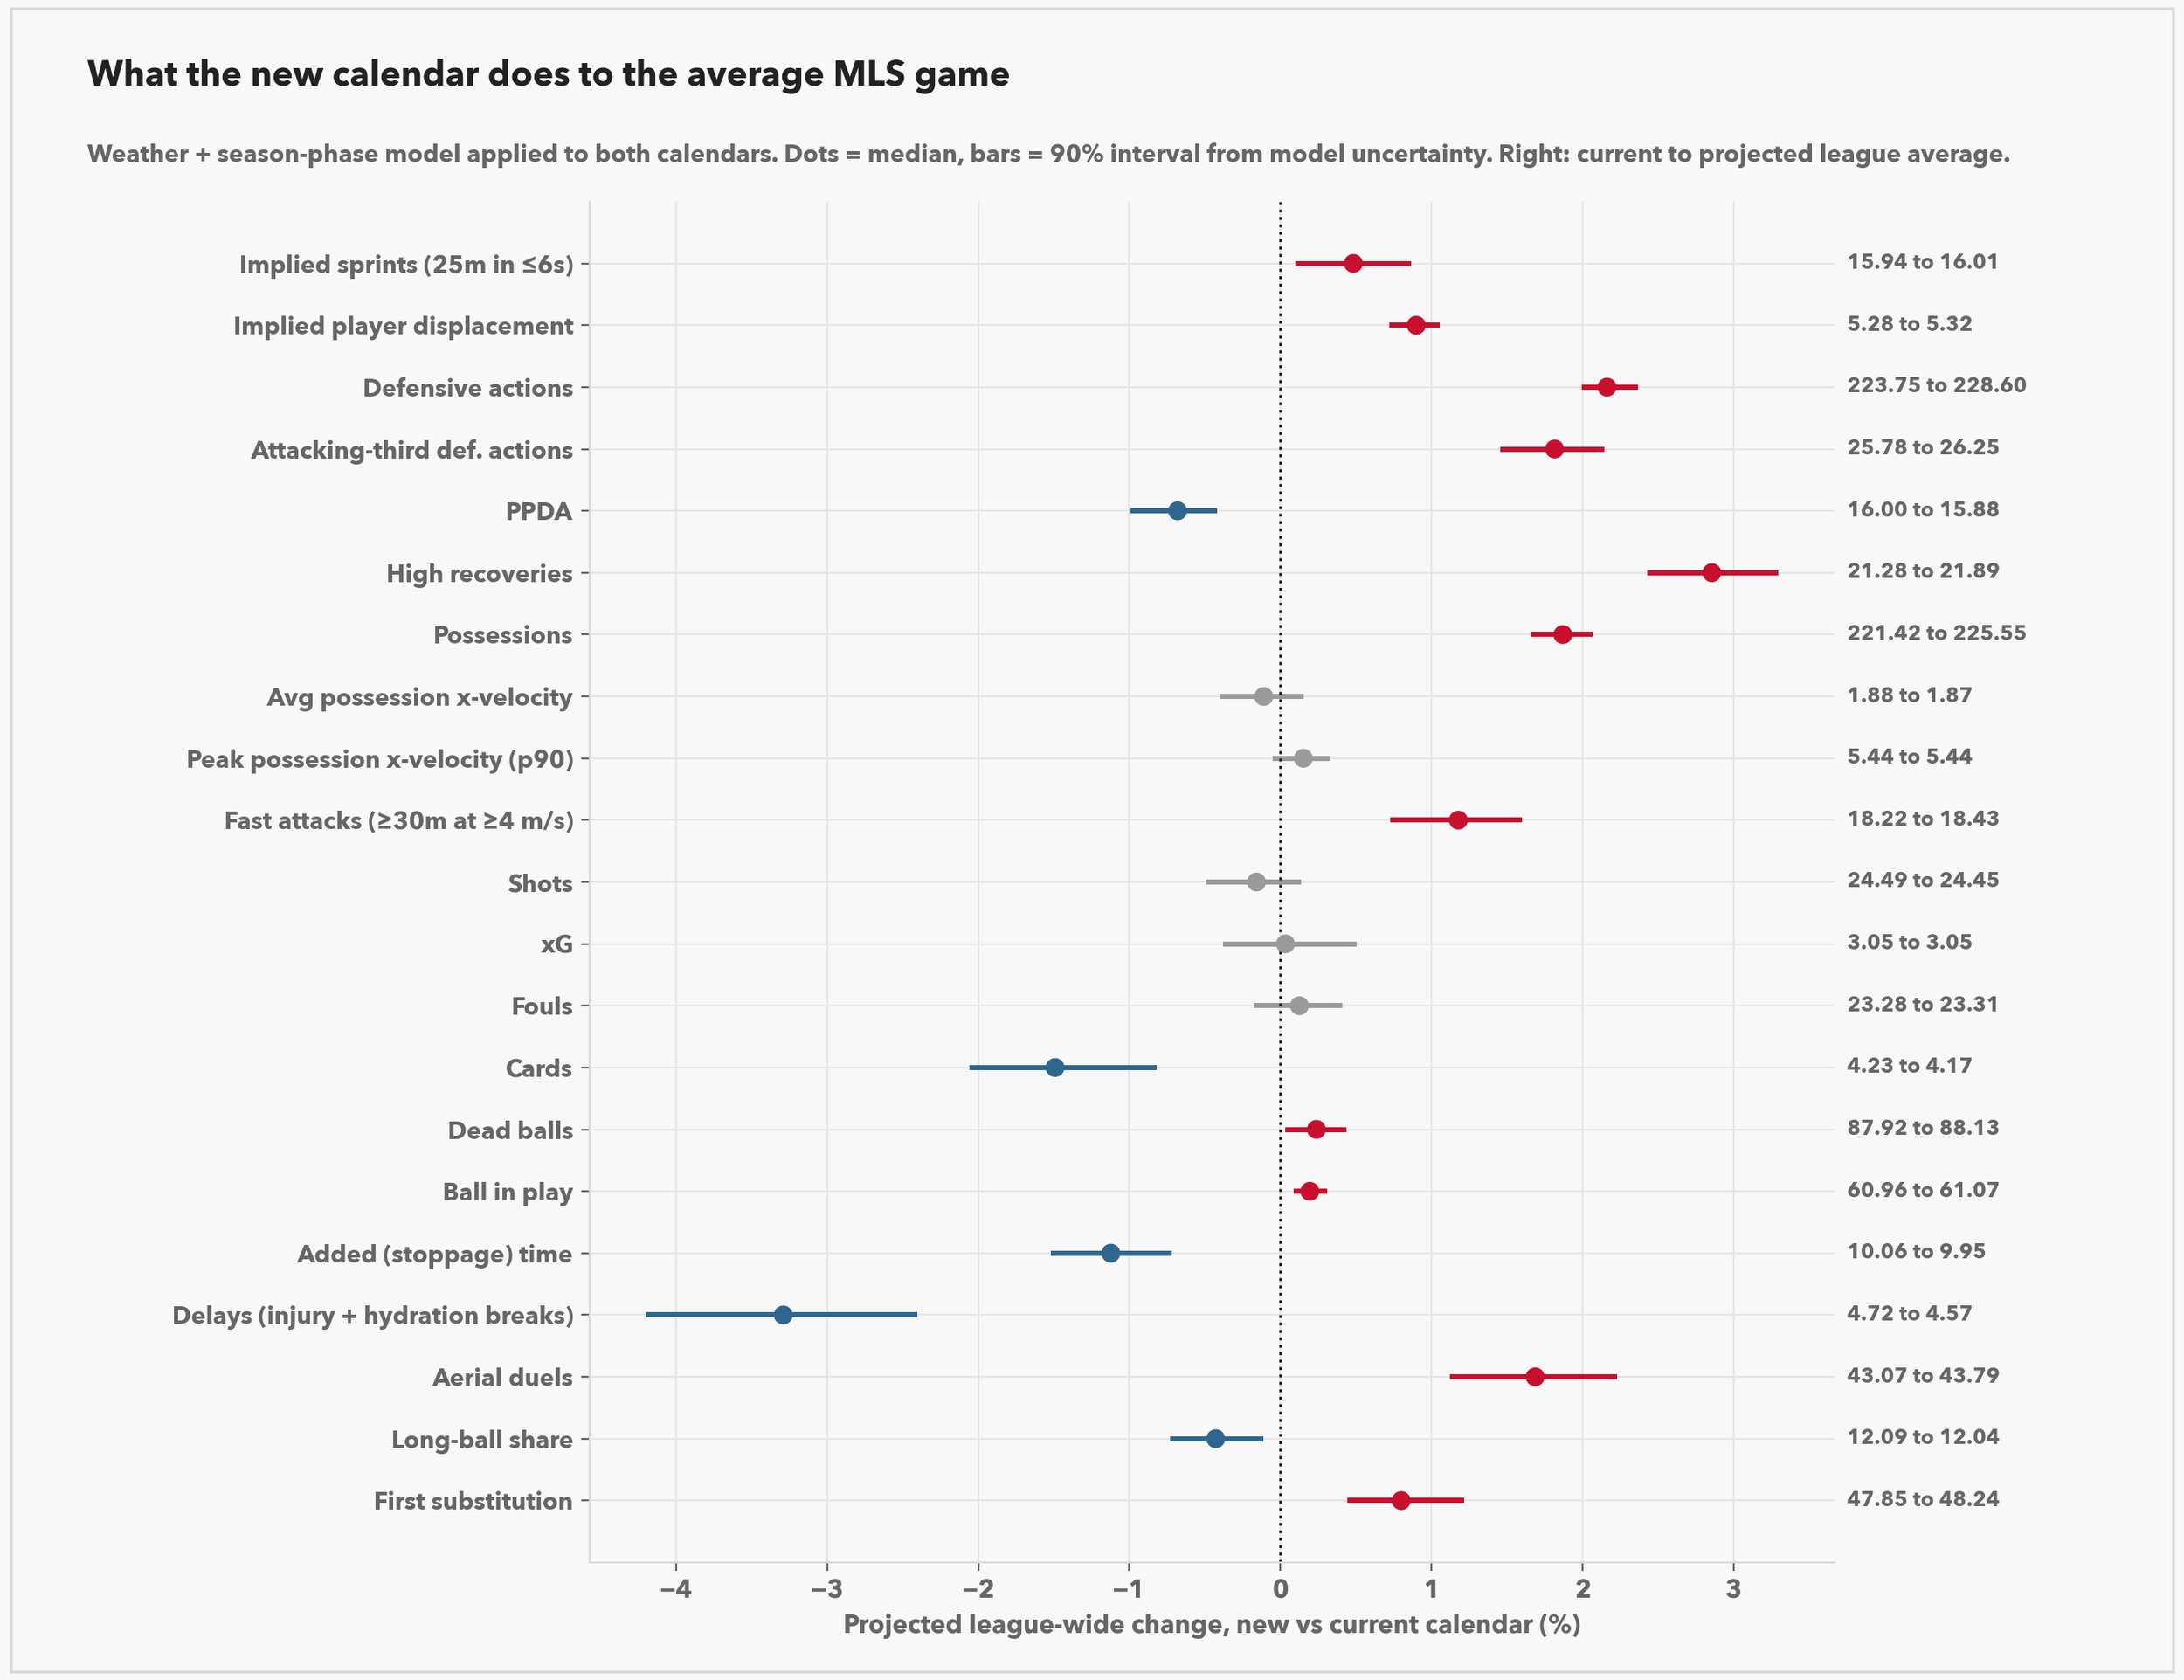
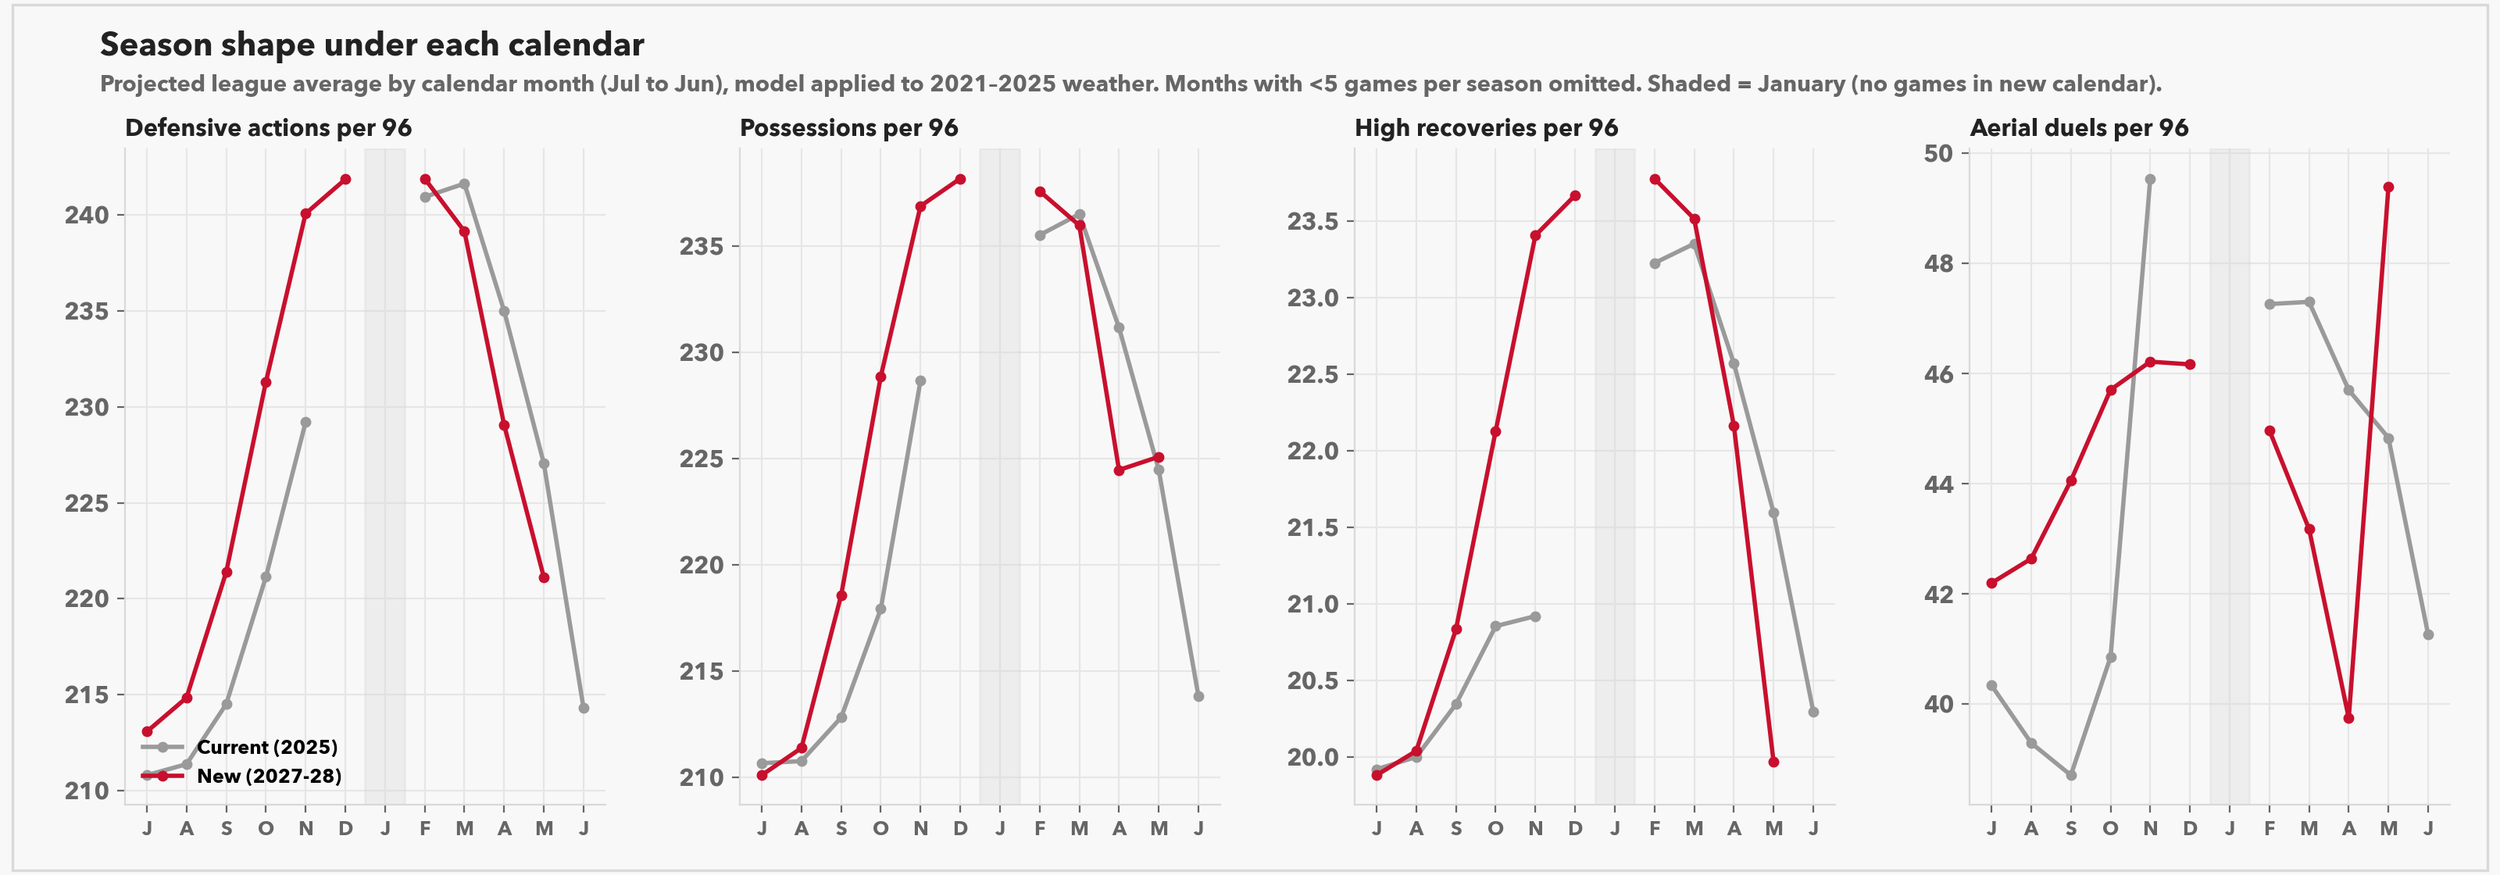
So how will the league change? I think largely for the better. Here’s that same list of metrics on the new schedule vs the old one. Running, pressing, high defending all up. Attacking metrics about the same. Stoppages, cards, injury delays all down 2-3%. I have actual injuries going down approximately 1%, but the error bars are big. Getting rid of as many of the brutally hot games as possible I think is a big step for the league, the transfer window alignment is definitely beneficial operationally, I’m happy with it. Let me know what you think.
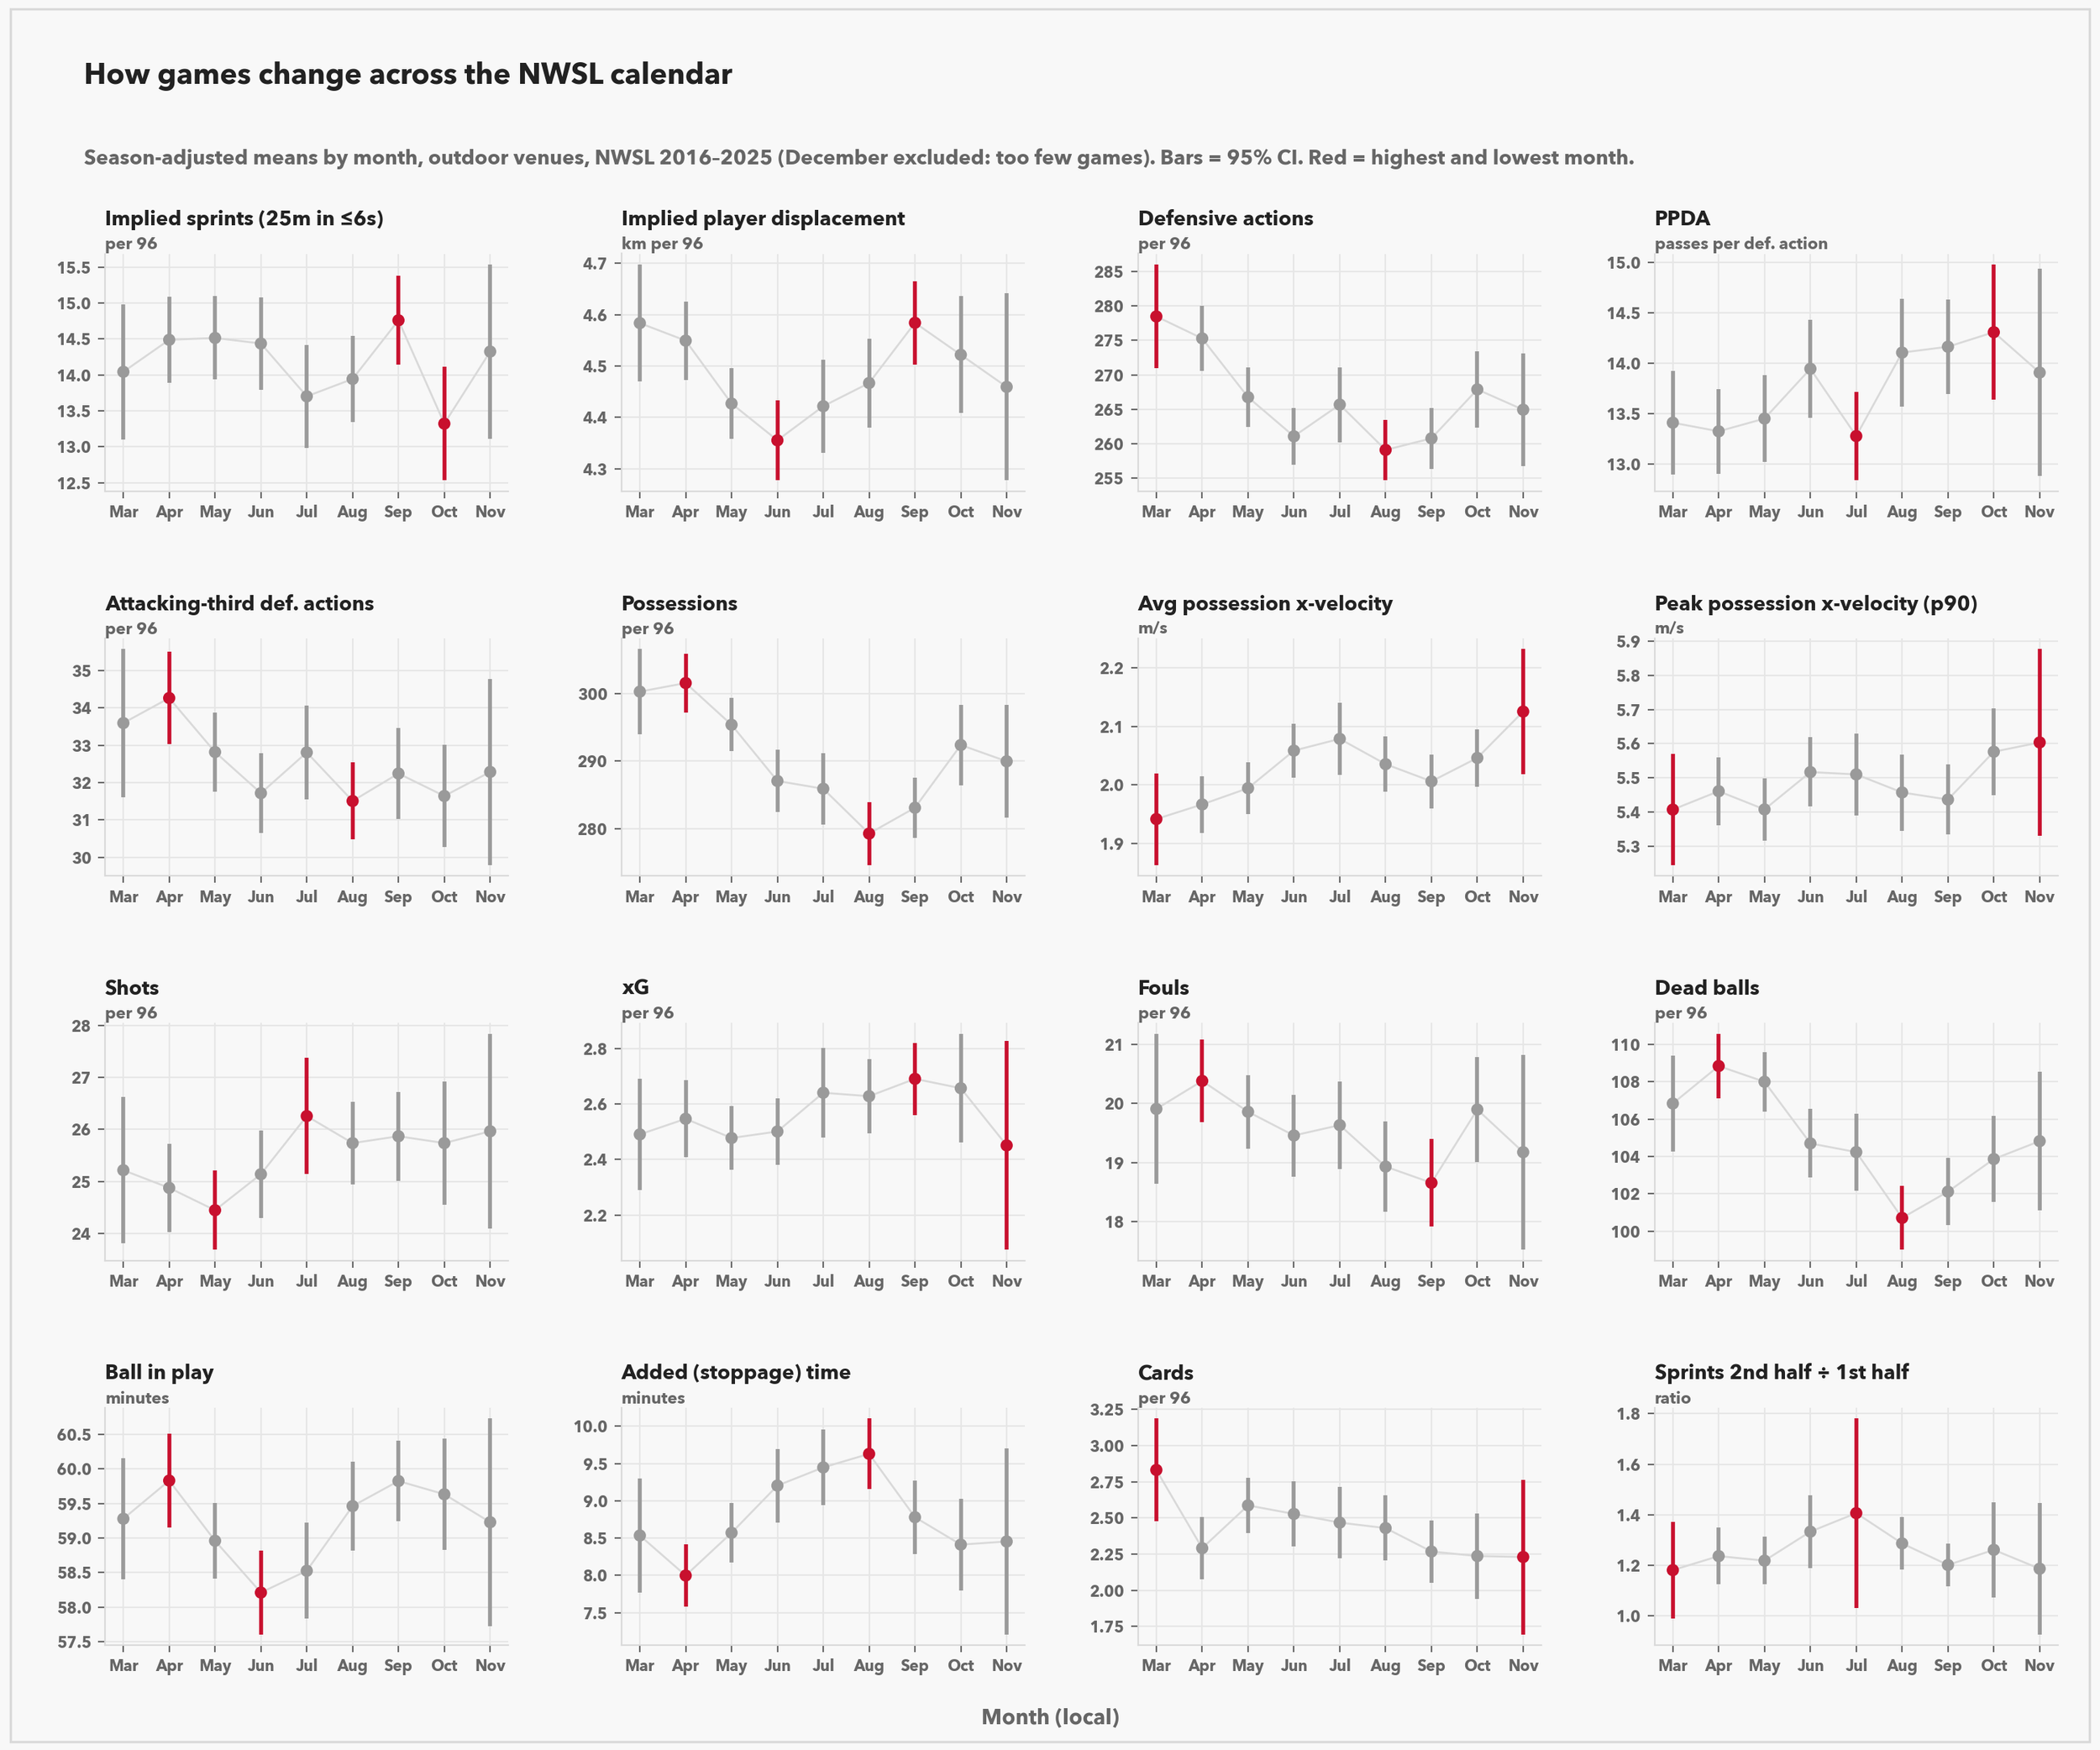
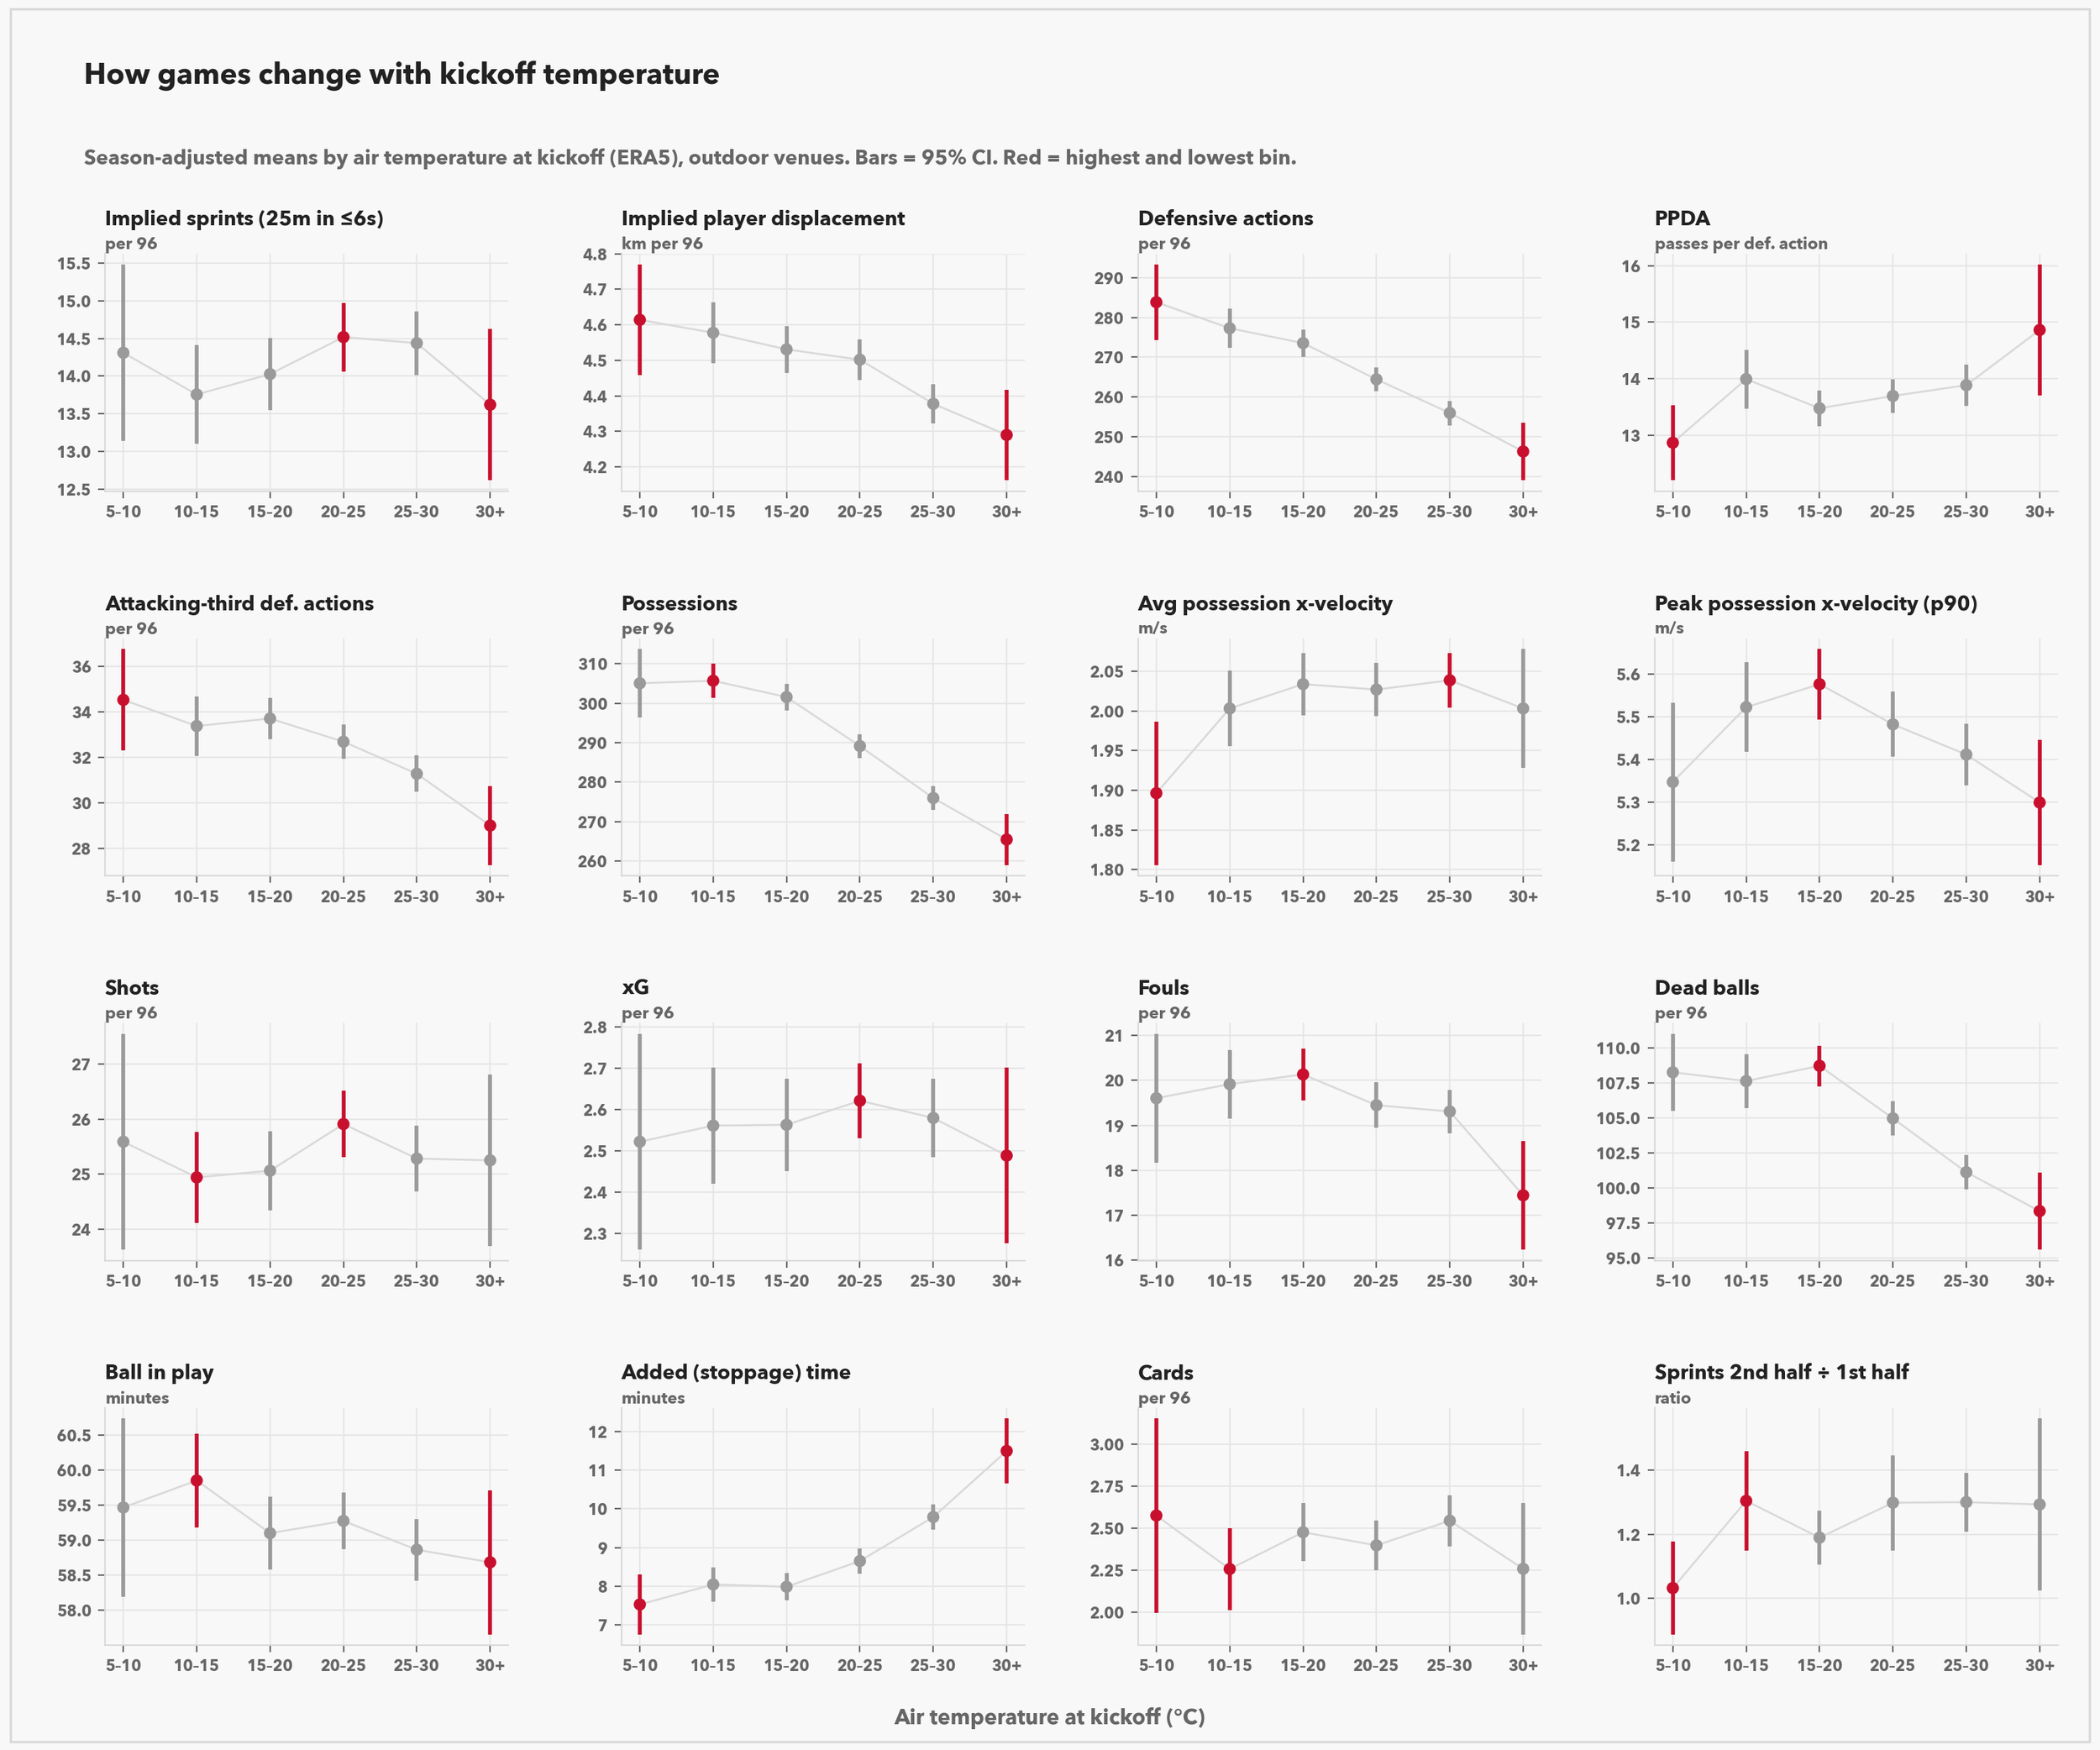
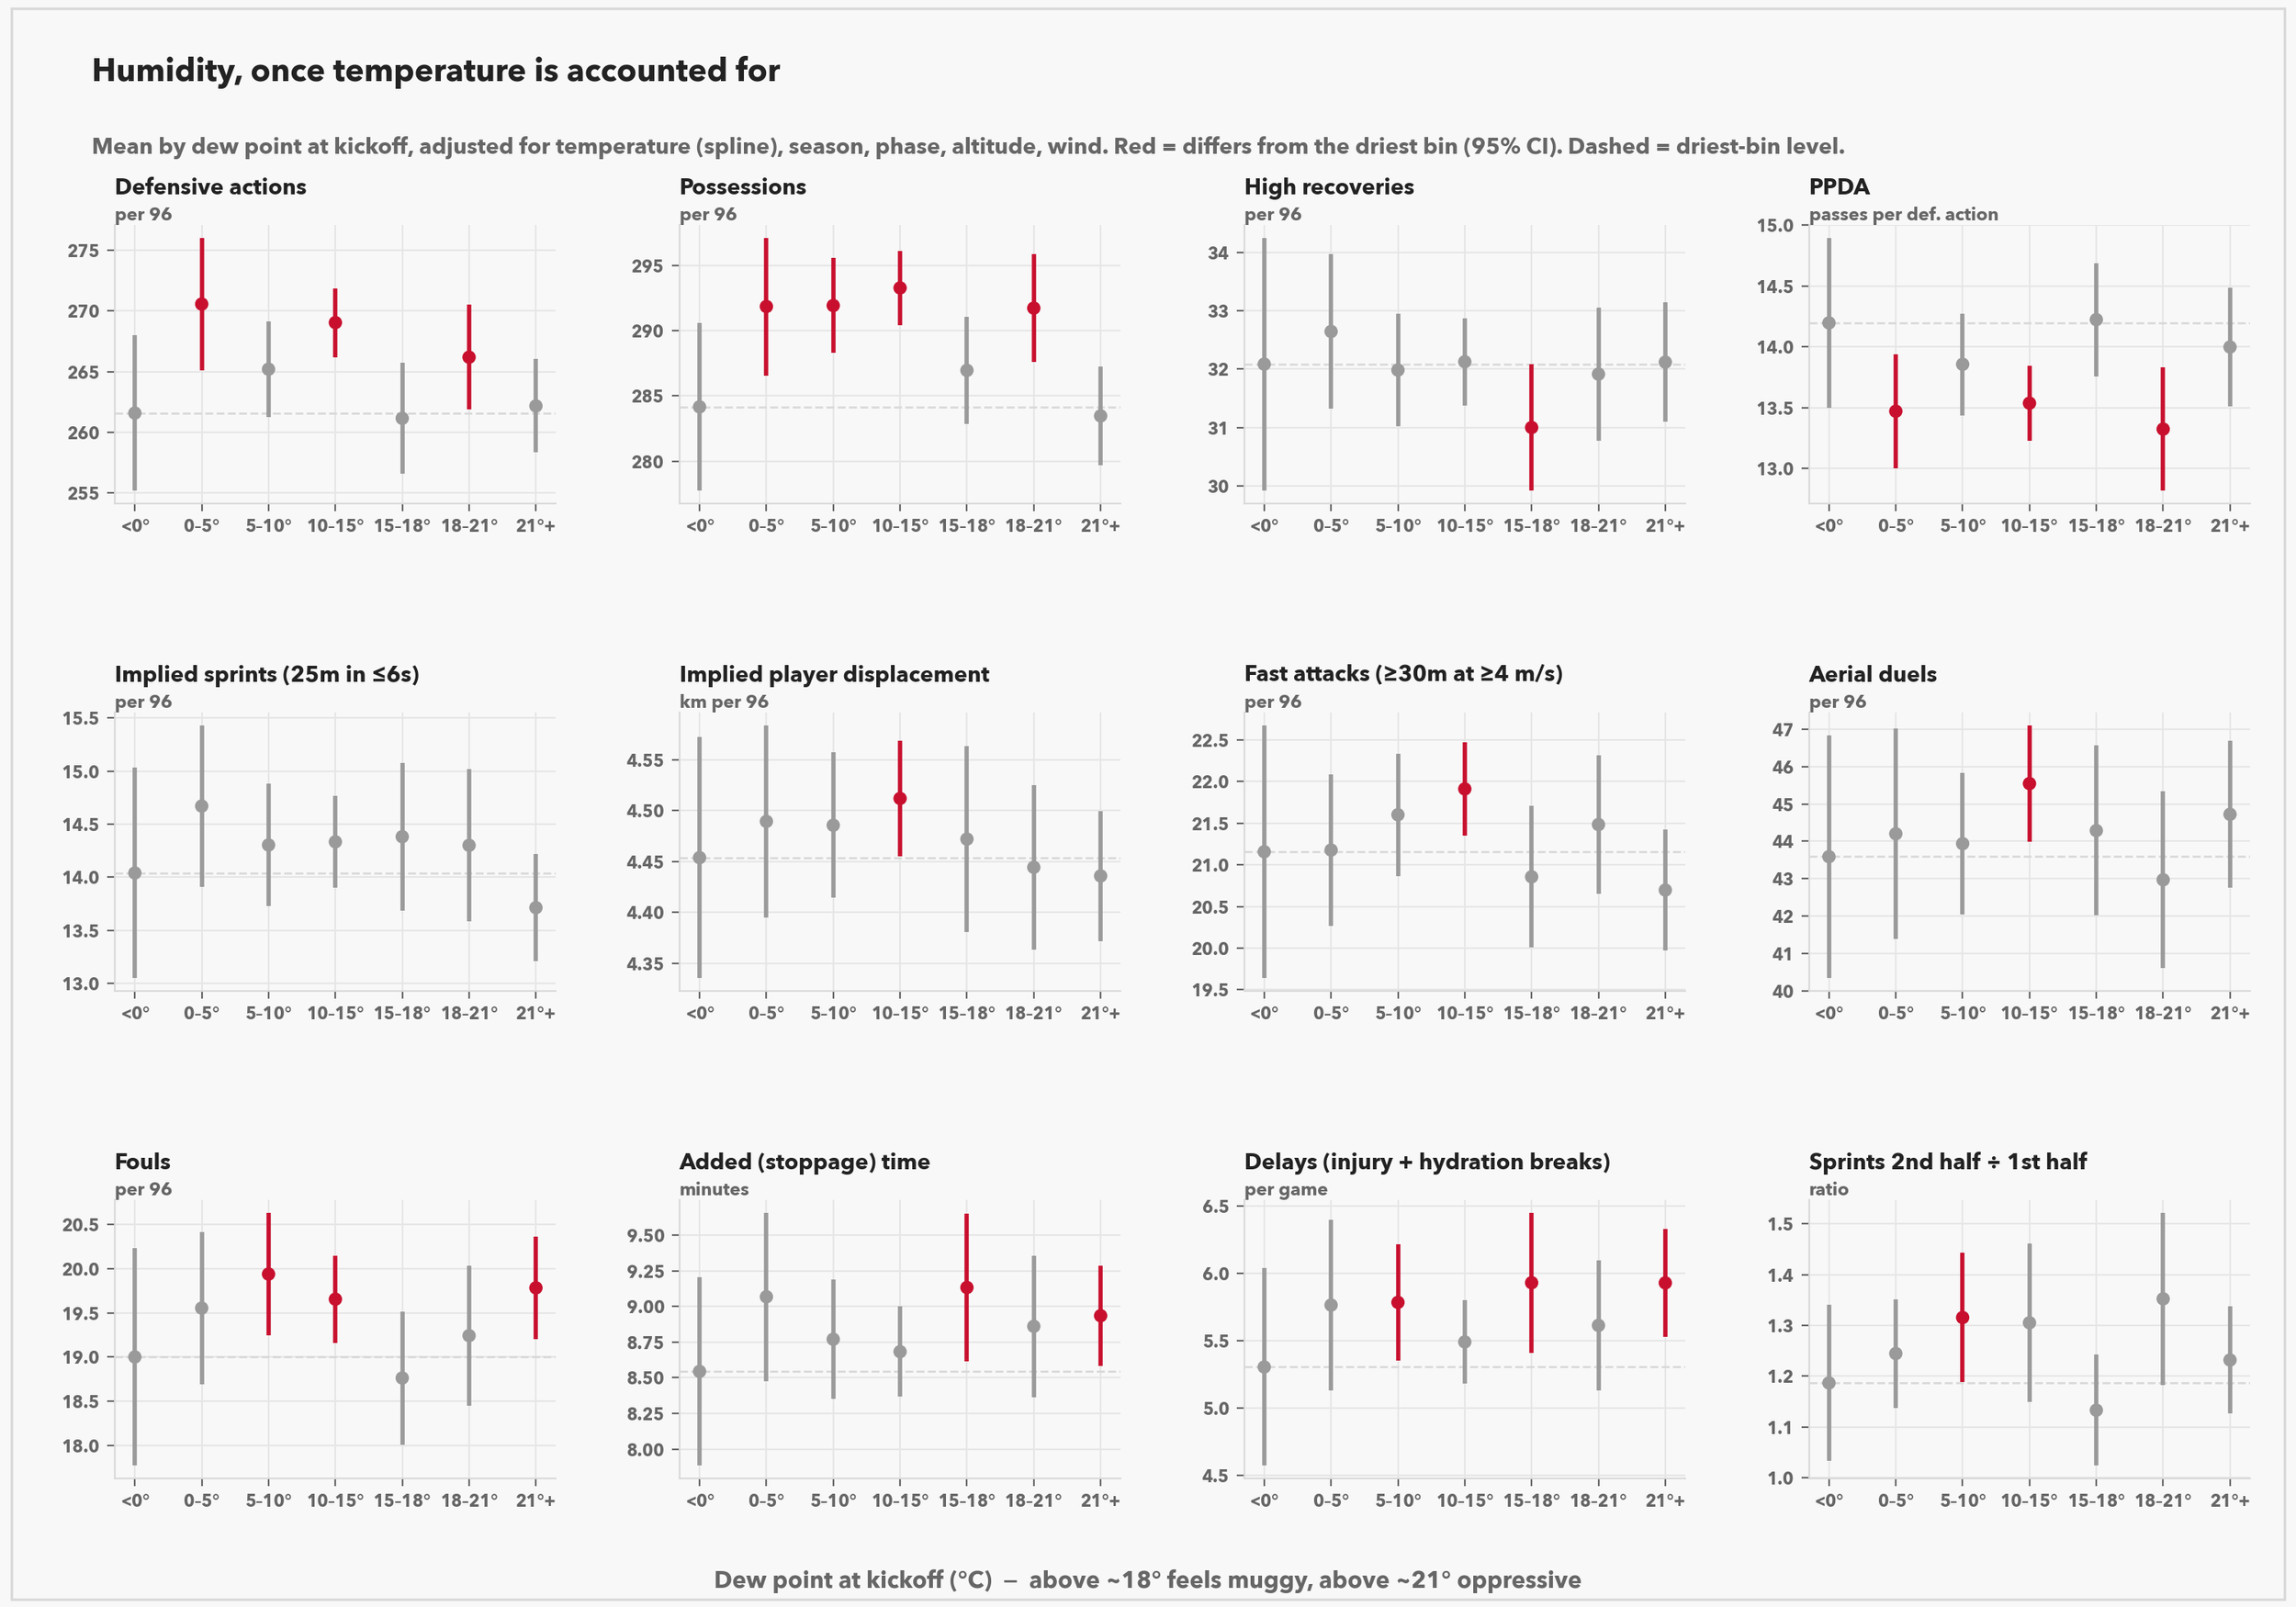
NWSL
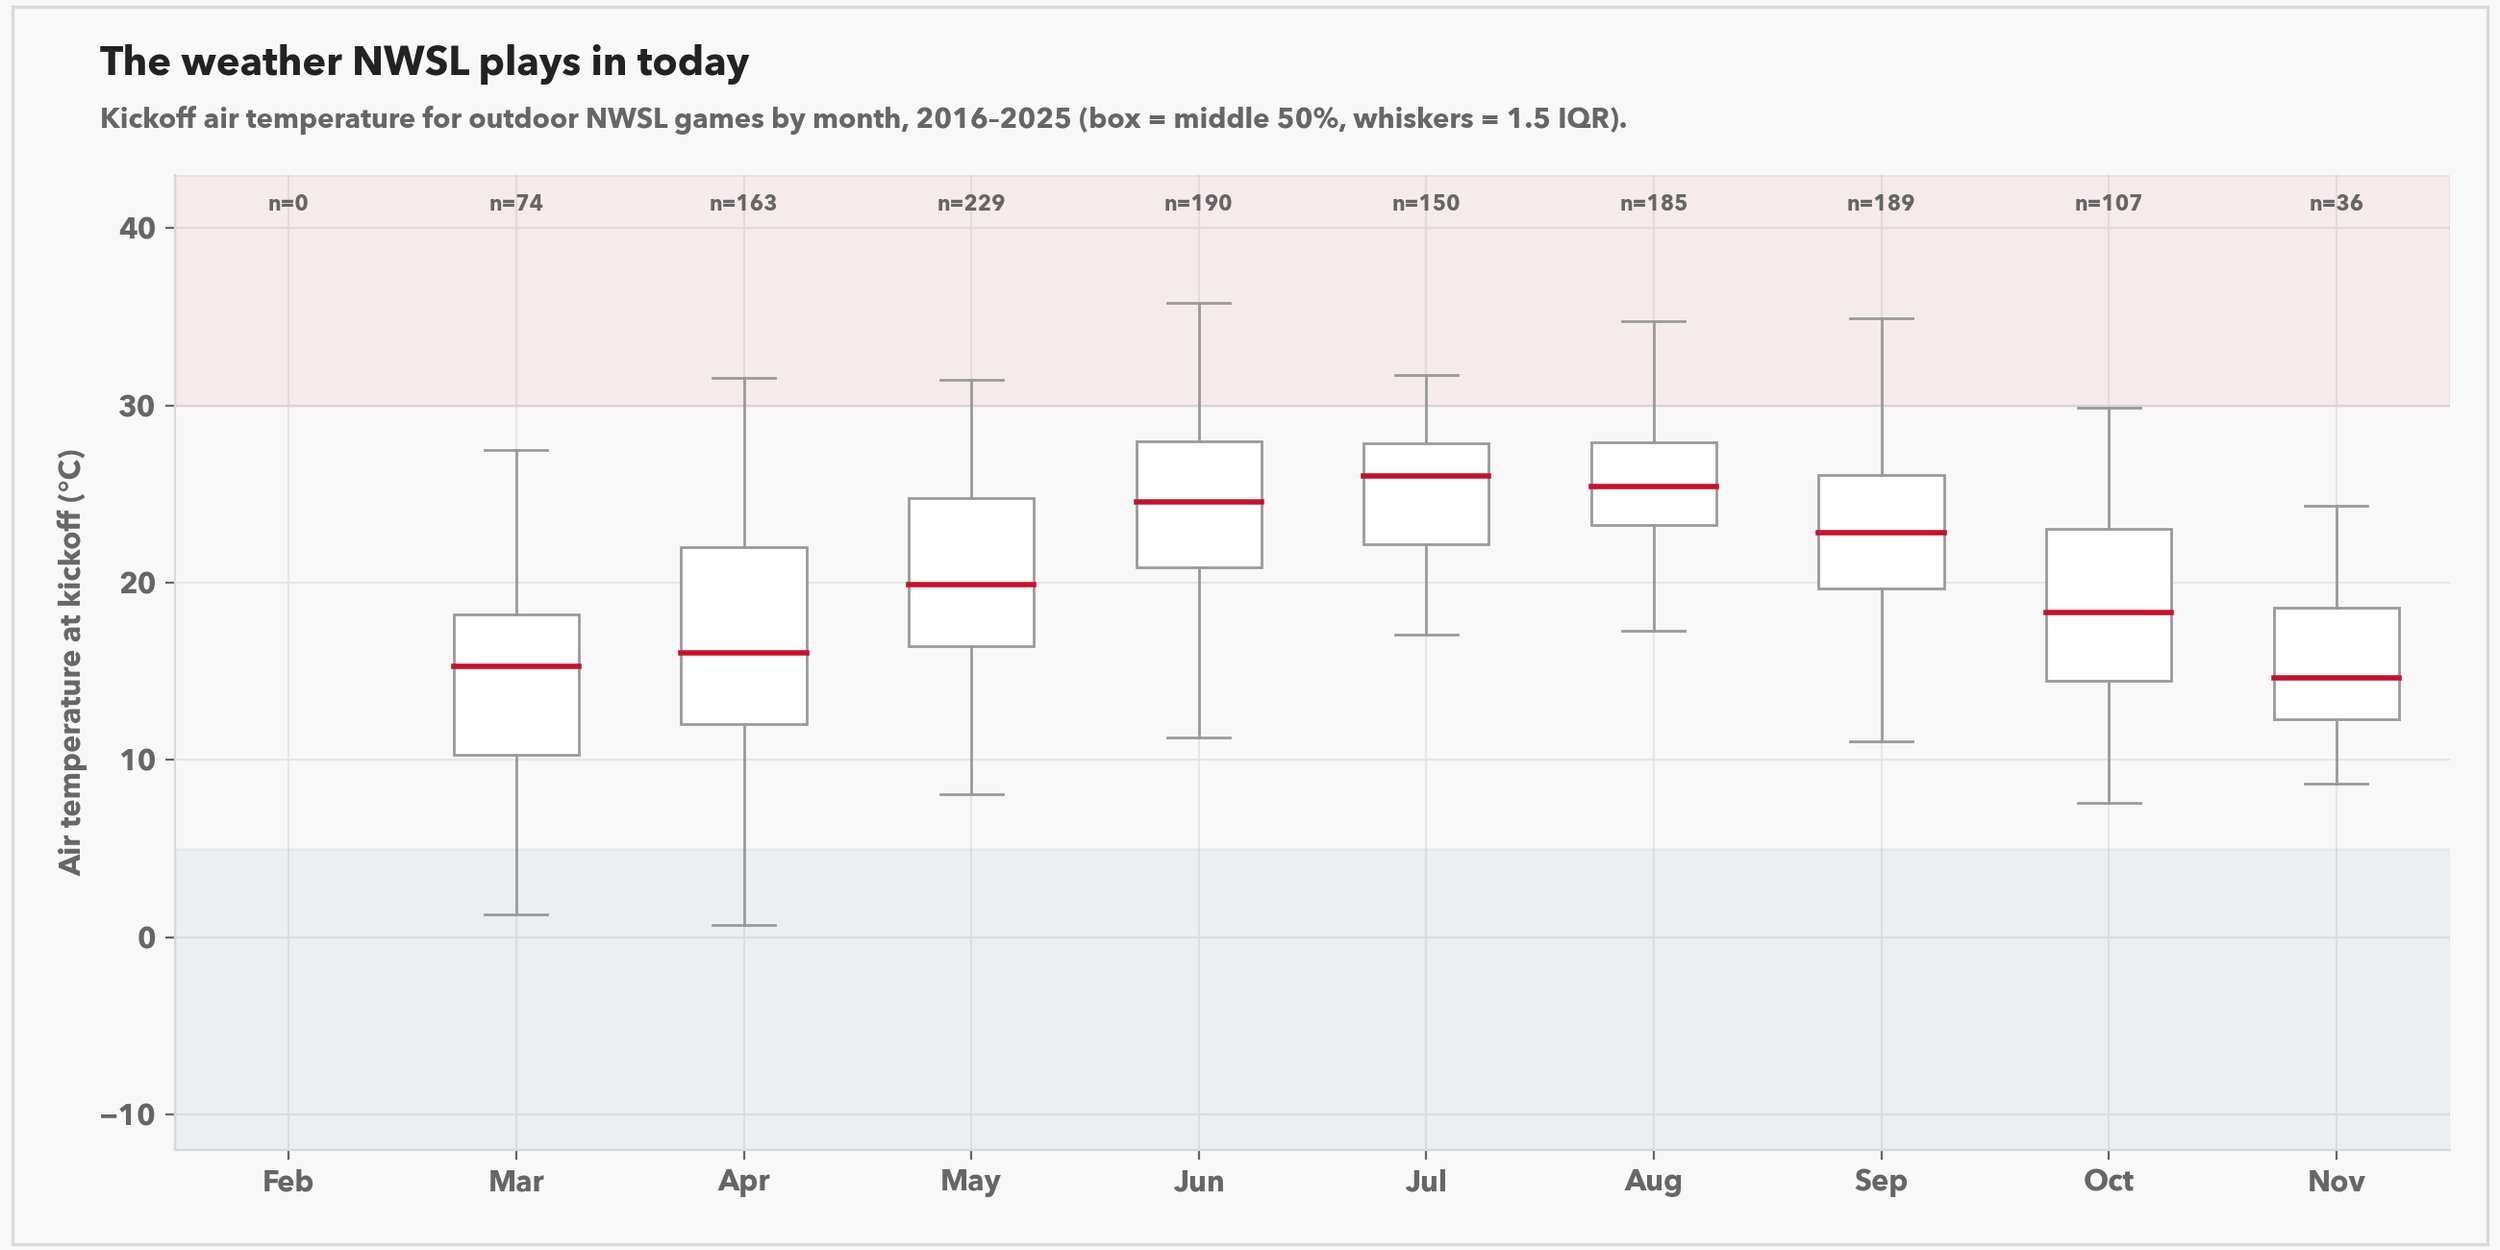
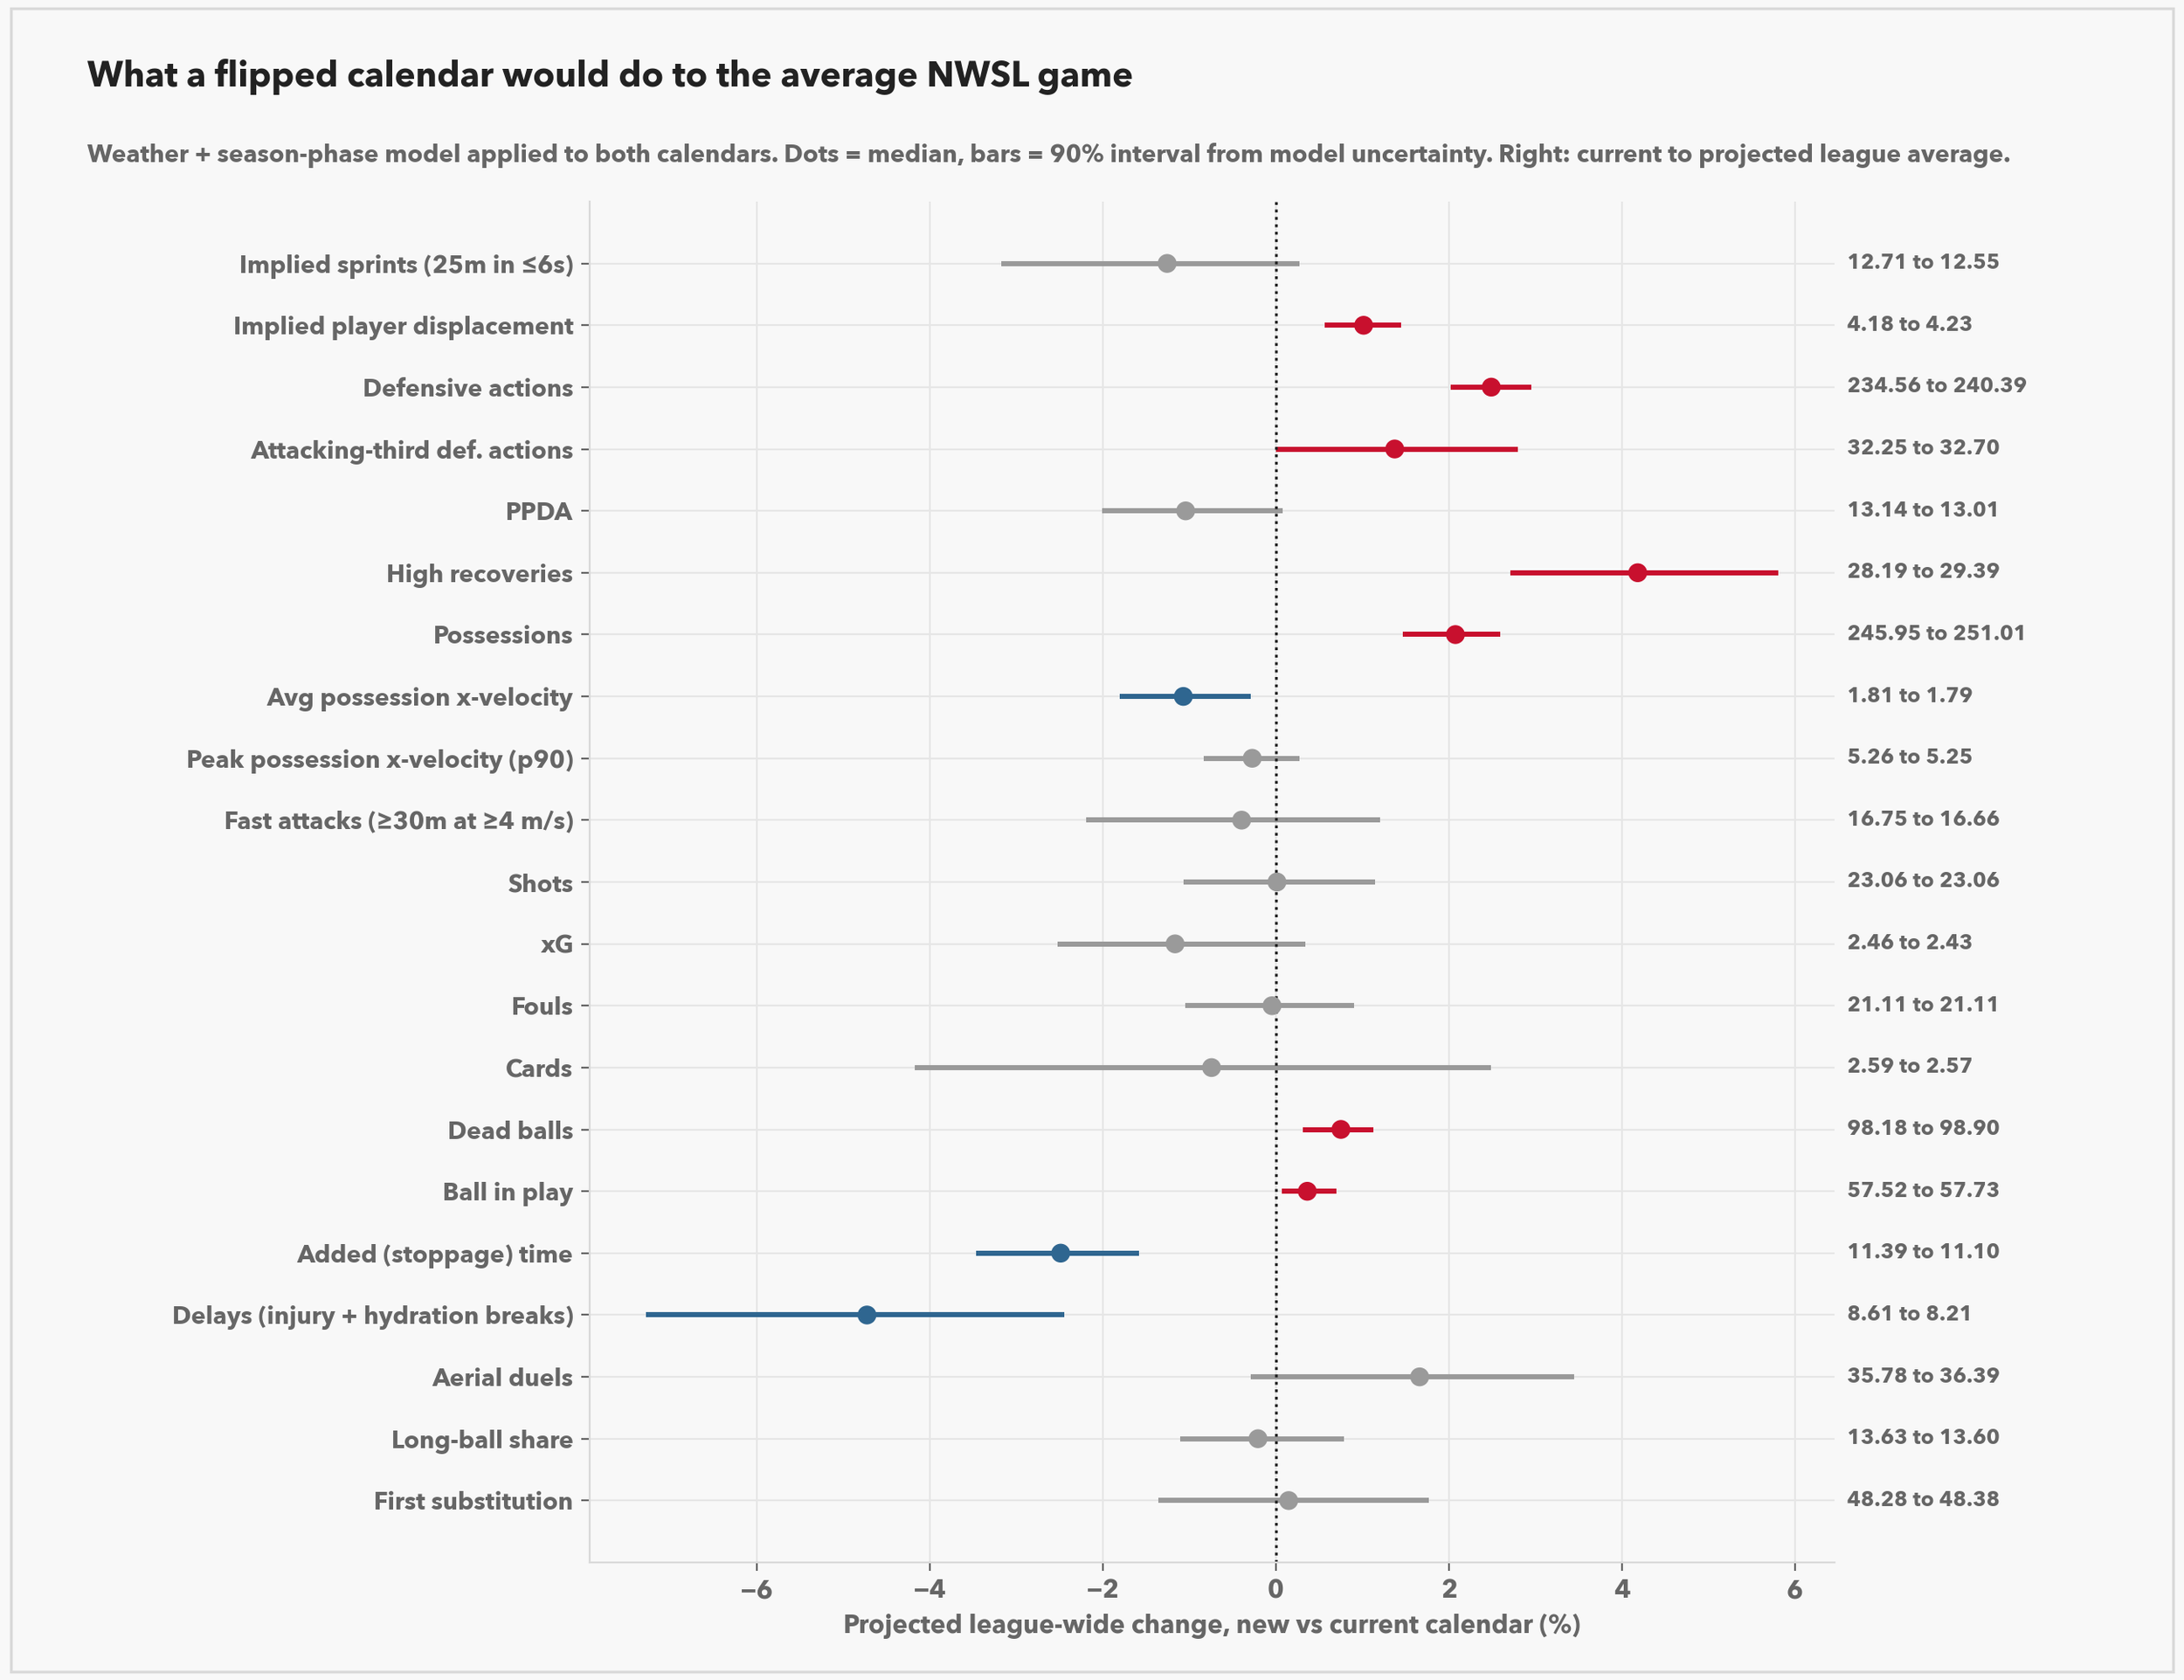
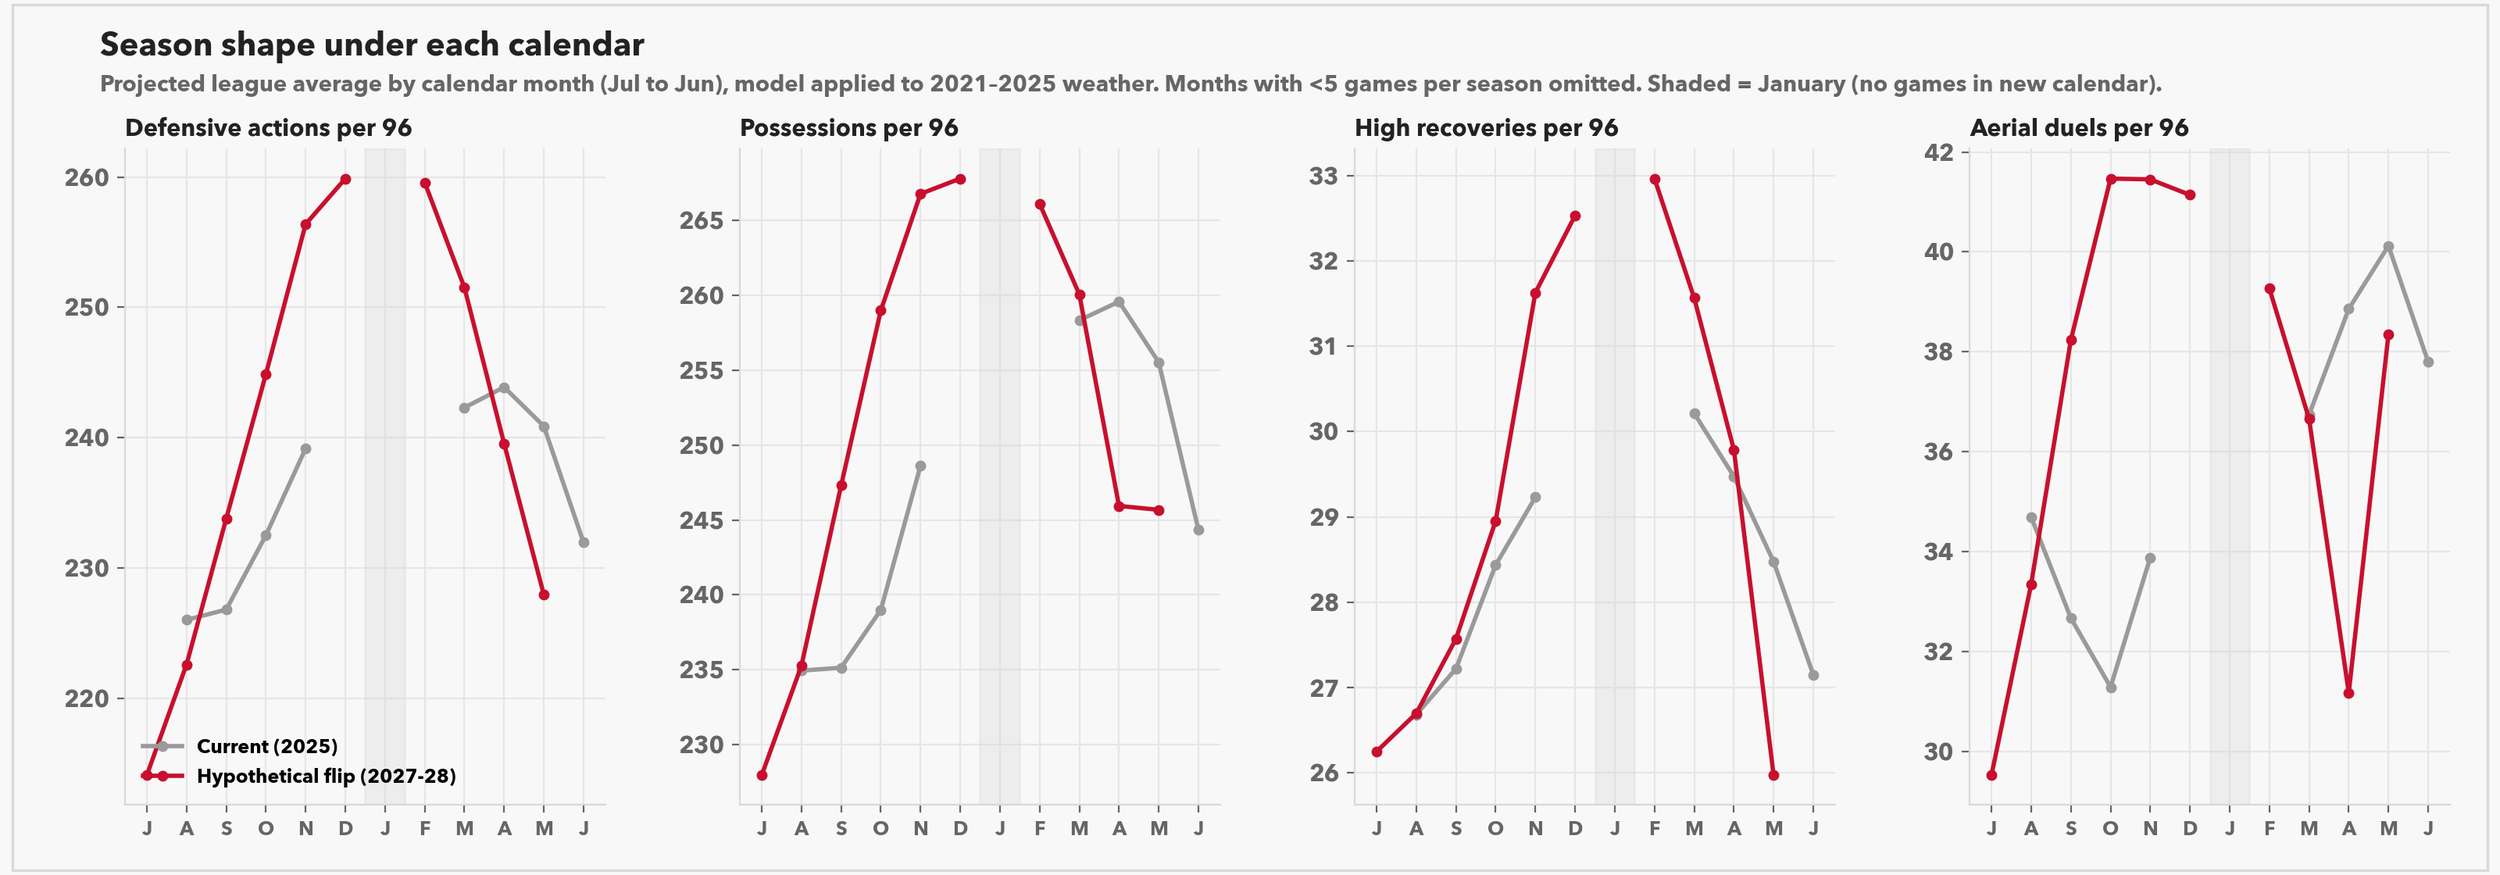
There has been some chitty chat about NWSL maybe doing the same. Their markets are on average considerably warmer than the MLS ones, but you see basically the same trends (but with much larger error bars on the very few cold weather games) in the figures below. Given the propensity for the commissioner to put the TV Time Slot ahead of the weather at virtually all costs, maybe taking a few hot noon kickoffs out of her hands is a good thing.