
Pressure in the Aggregate
/Without publicly available pressing data (RIP pressing data on FBref), understanding how much and where teams pressured opponents has become more and more difficult. We’re left with less precise measures like the raw counts of standard defensive actions in the final third, PPDA (passes per defensive action), and the average height of defensive actions, to try to piece together a more complete picture of how much teams are pressing. All of these metrics can inform how we analyze pressing and pressure, but is there a better way to quantify it?

The Specifics
To try to better answer that question, we’re using three components to identify situations where a team’s pressure is likeliest to have had an impact on the opposition’s build up play.
On Ball Defensive Actions: The first piece is to use some (emphasis on some) standard counting stats of defensive actions. Those include tackles (both successful and unsuccessful) and opponent take-ons in the attacking 40% of the field, because a player has to be applying some amount of pressure to get dribbled past. Basically, any indication that defensive pressure was applied to the team with the ball in its own defensive 40% of the field. Other defensive events like ball recoveries (that are not included in the next component) are also included here.
Pass Disruption: Next, we try to isolate possessions that are impacted by pressure. This component has two main pieces. First, we look at which teams are “forcing” incompletions of easy passes (identified by passes with xPass > 90%). This isn’t a perfect measure - players misplace passes under no pressure due to any number of reasons - but across a larger sample size, something is making opponents consistently make mistakes and the simplest explanation is pressure. Interceptions of passes that fall outside the xPass minimum above are also included in this component. This measure also includes interceptions and ball recoveries that follow missed passes not included in the above xPass grouping to include all pass disrupting actions.
Forcing Opponents Long: Last, we’re looking to identify possessions that result in the familiar outcome of a successful press: at least one short pass in the defensive part of the field before a long pass up the field to avoid either of the above two outcomes.
The Results
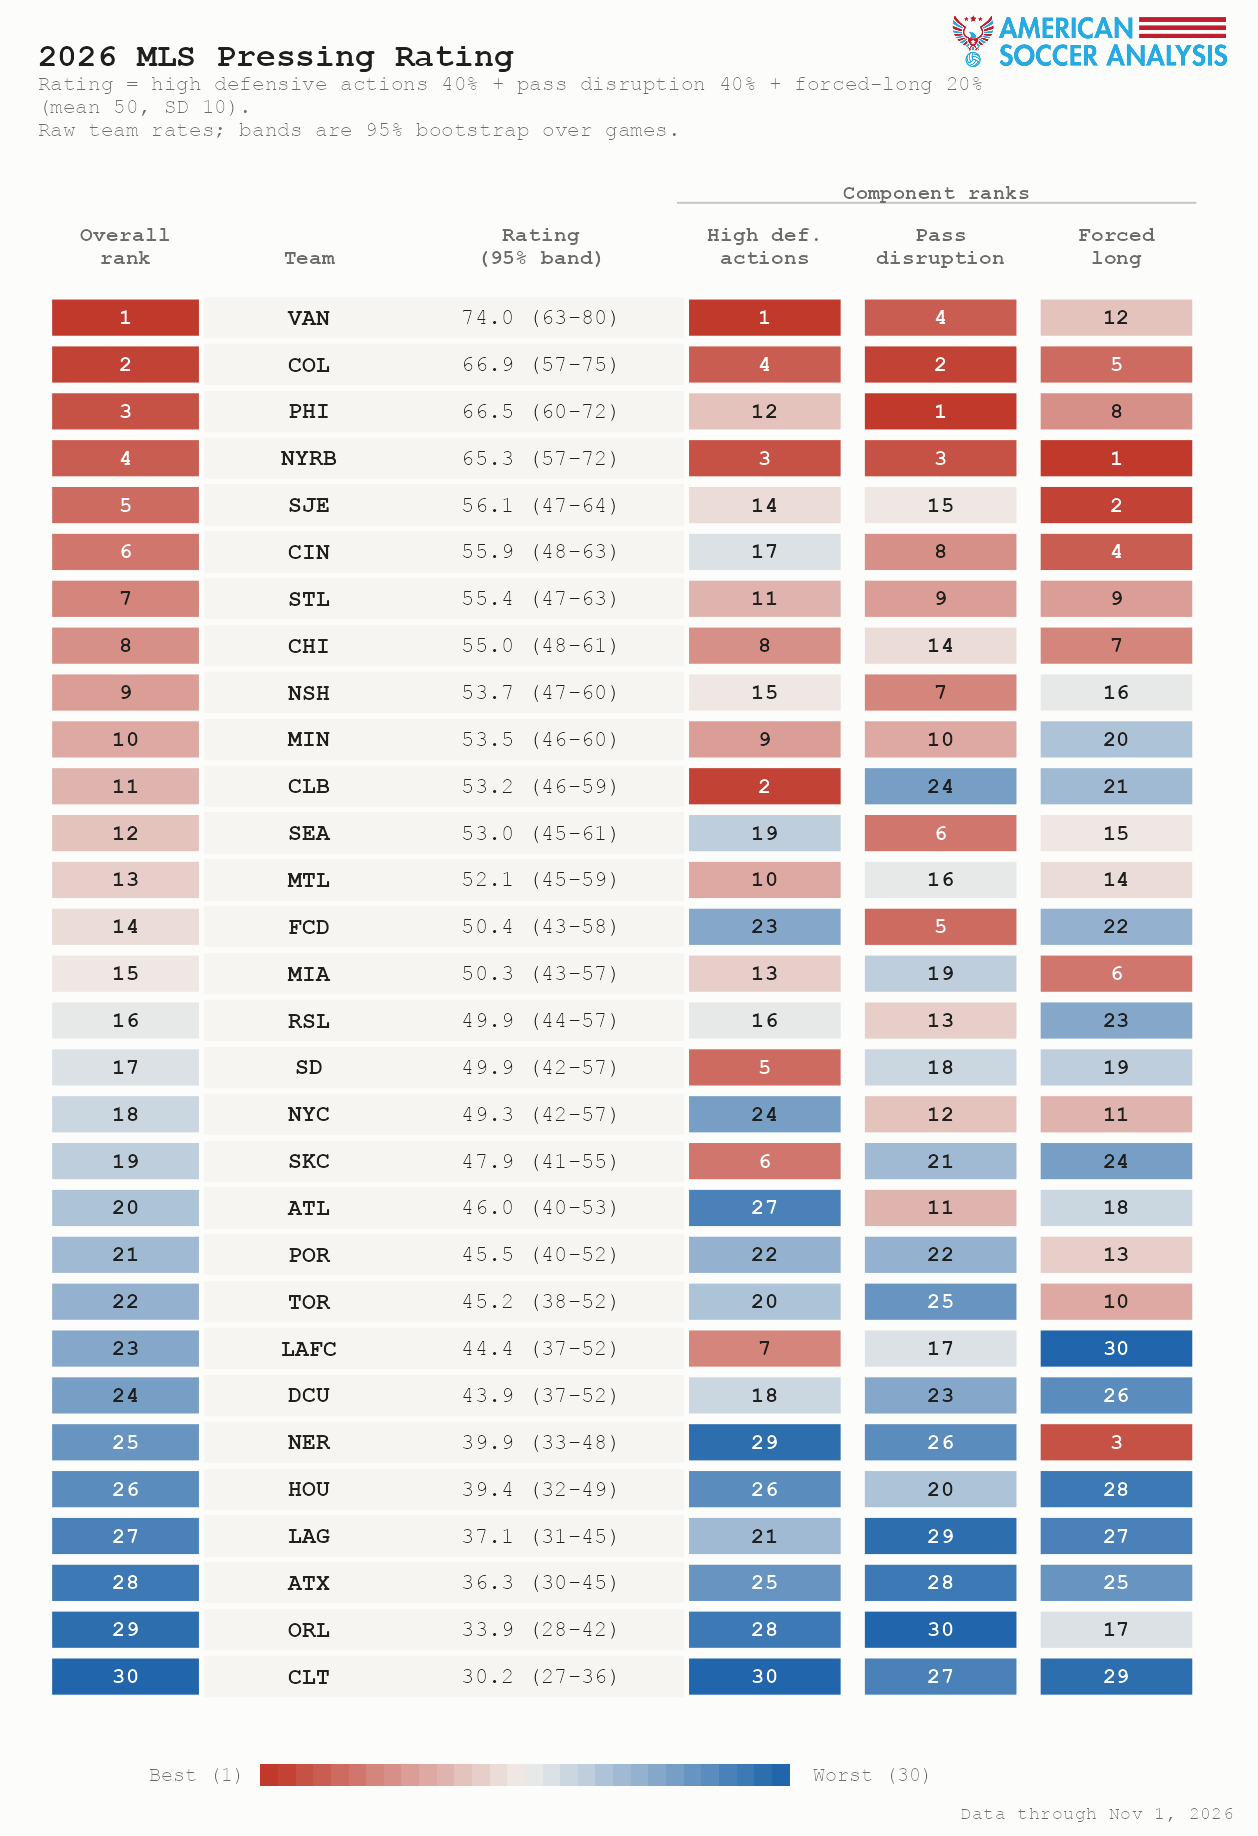
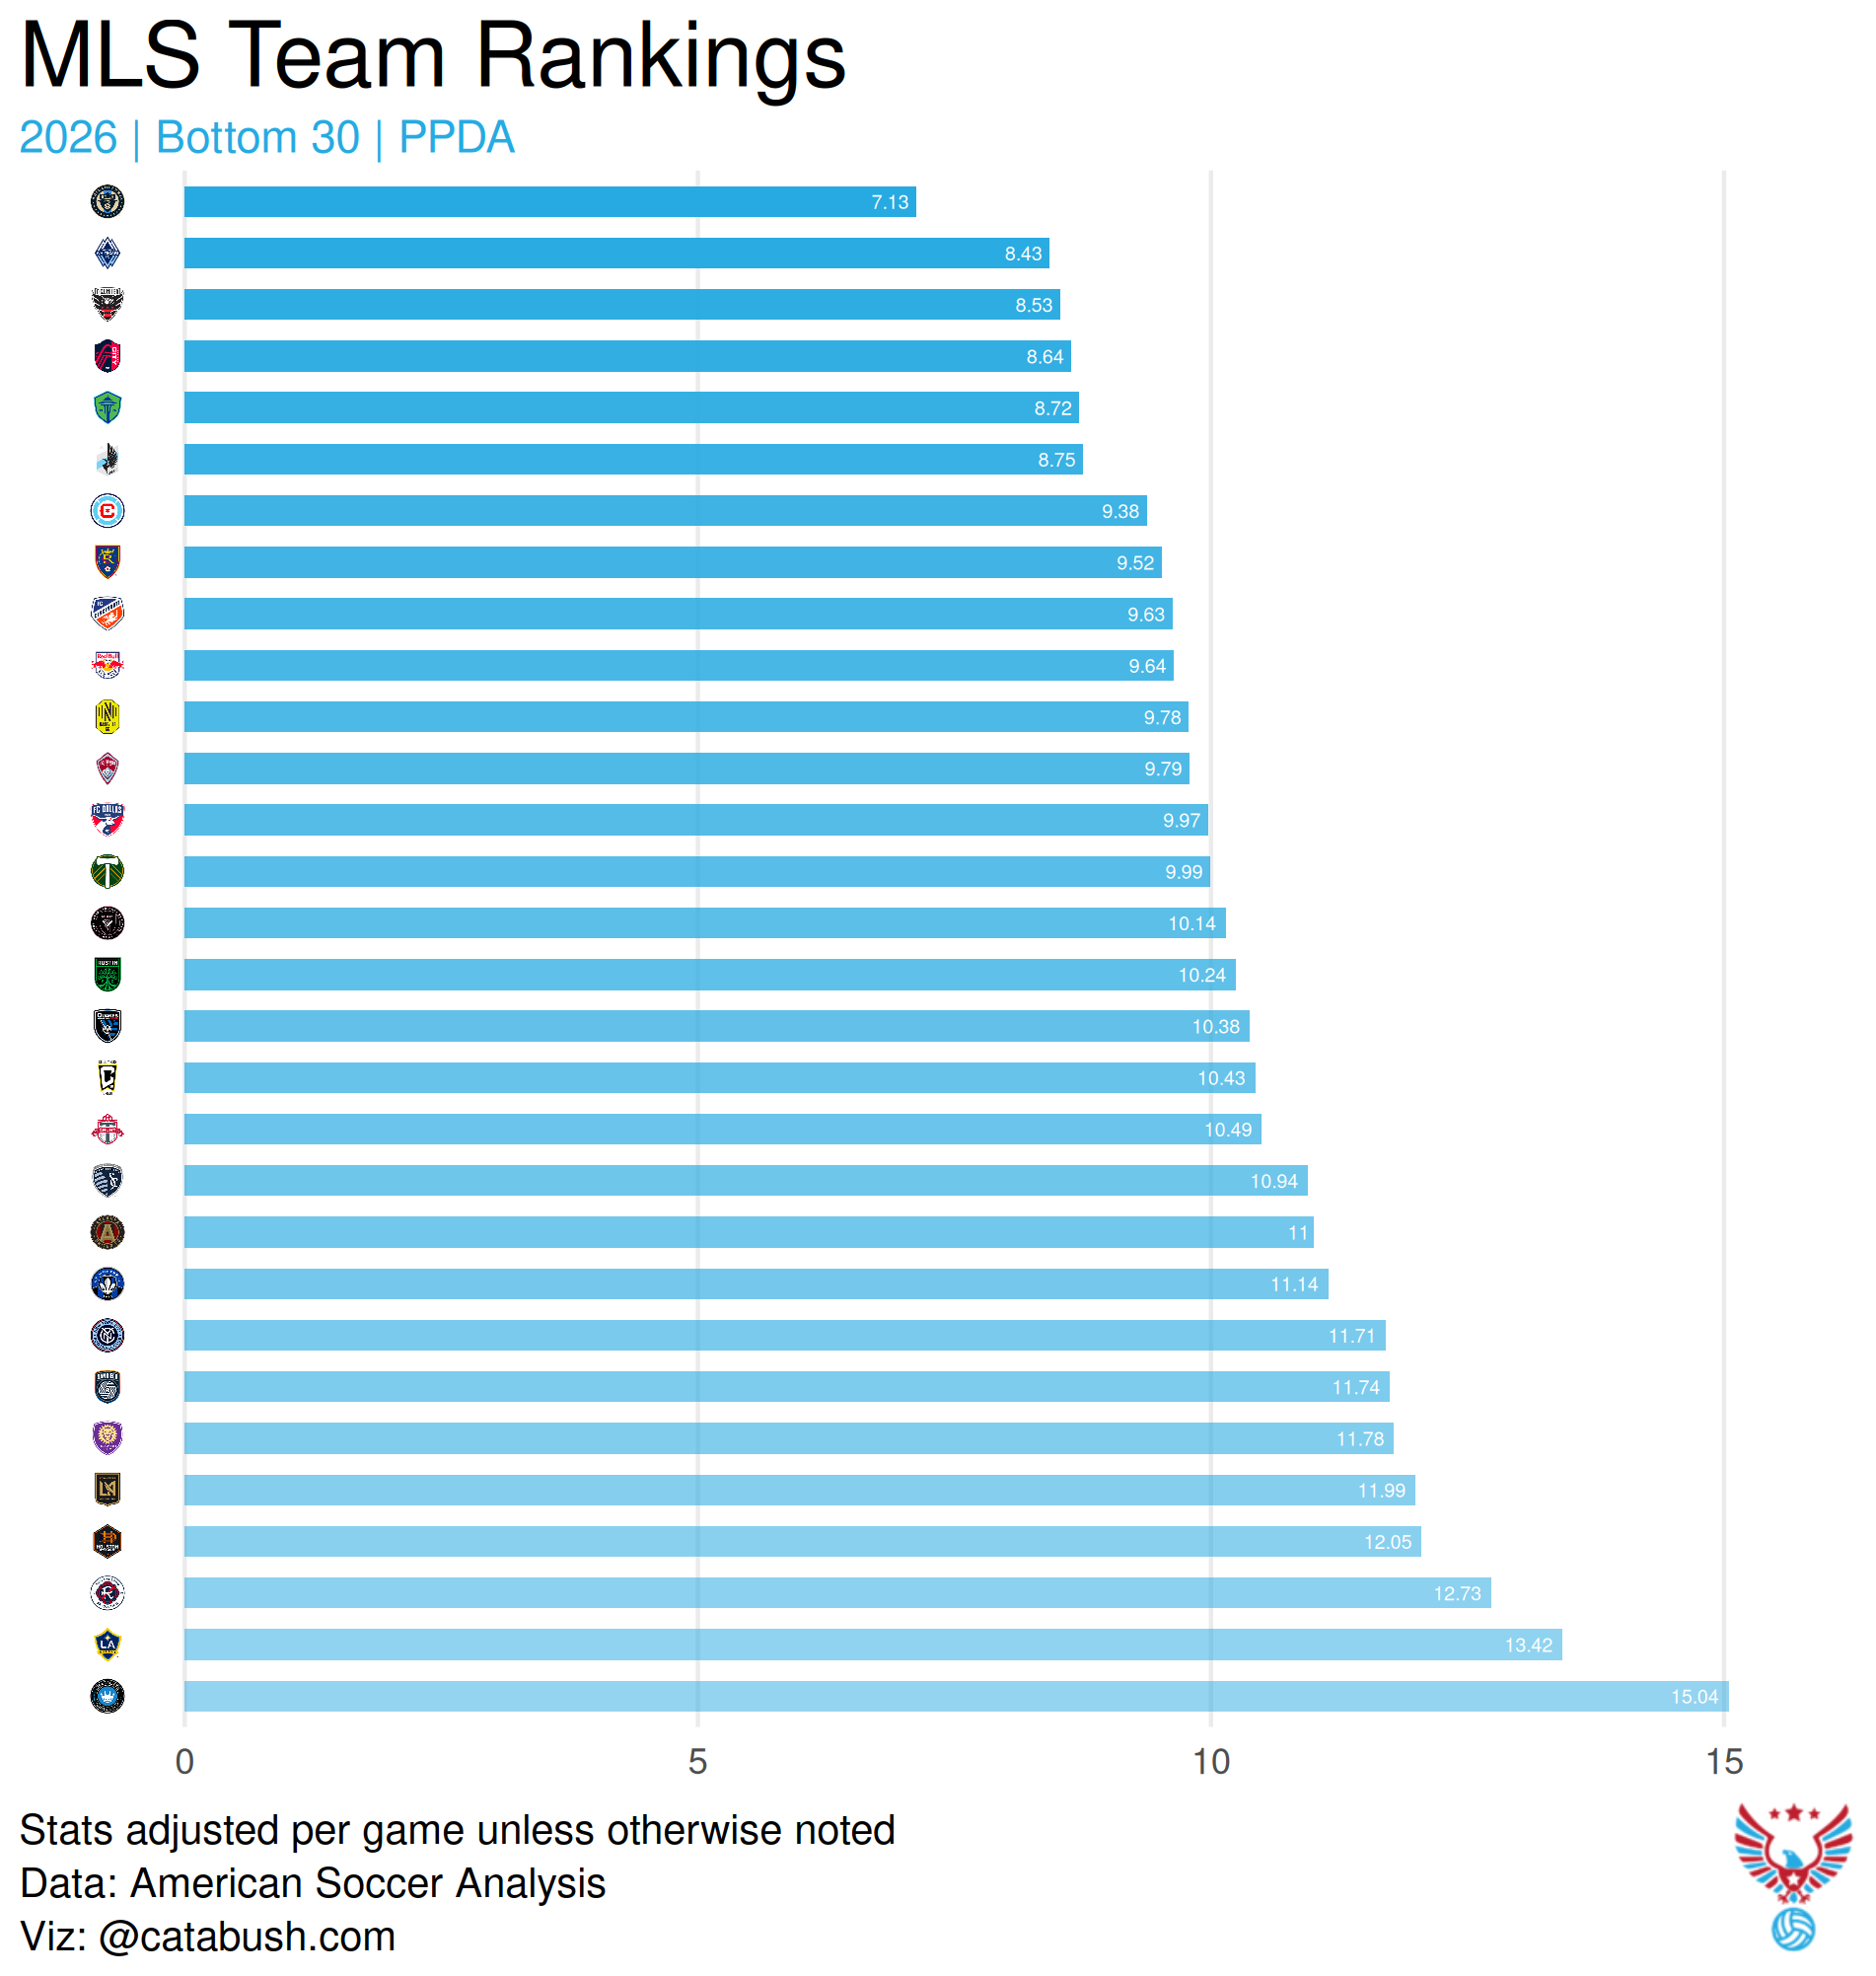
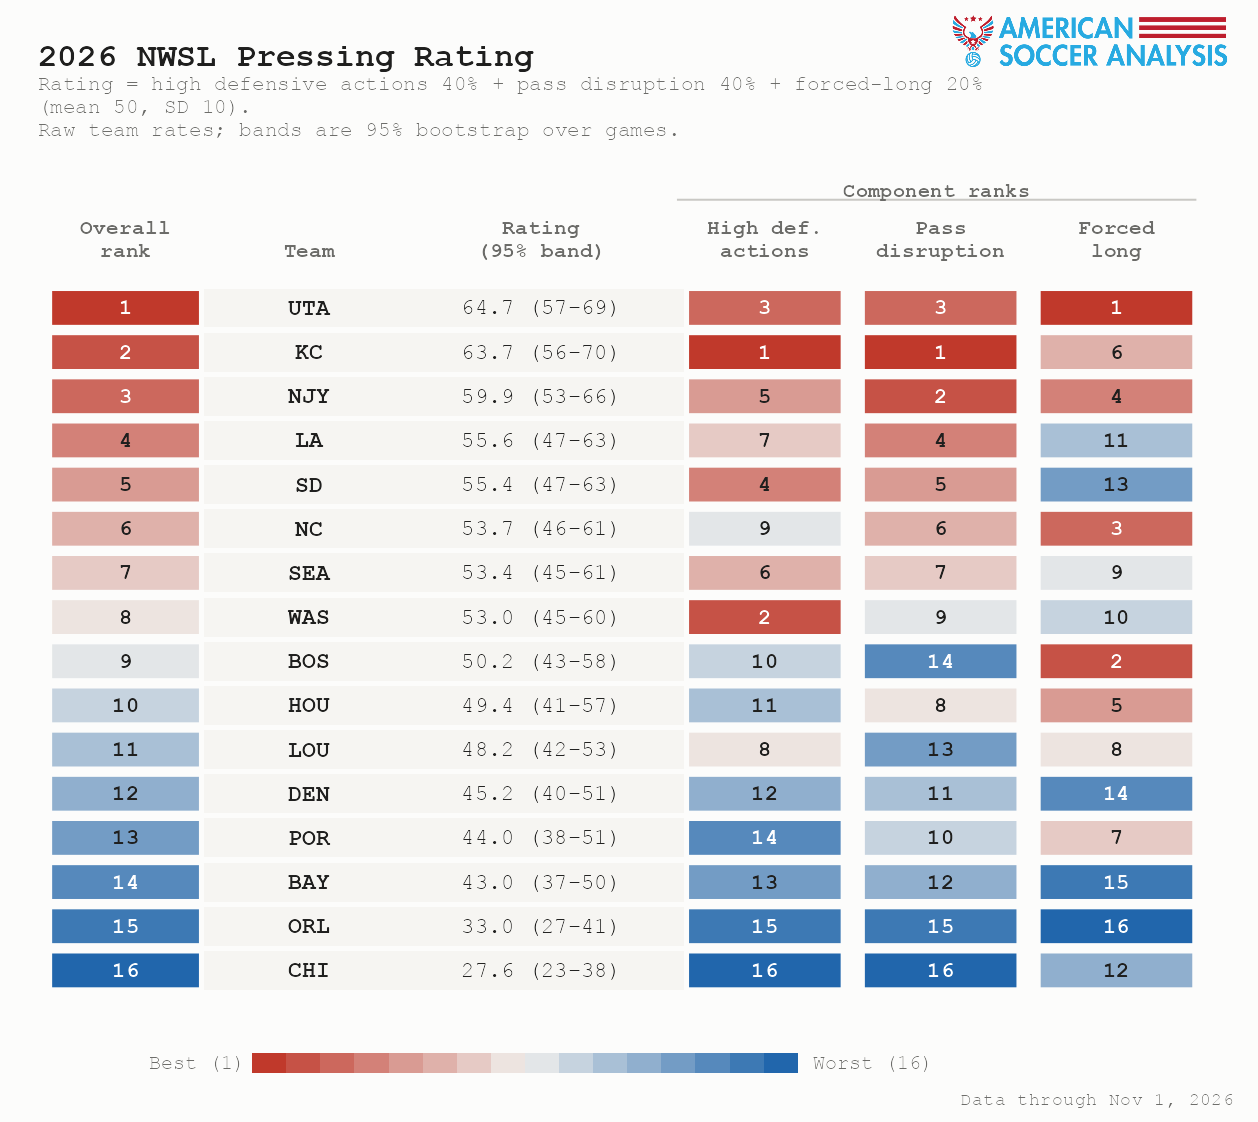
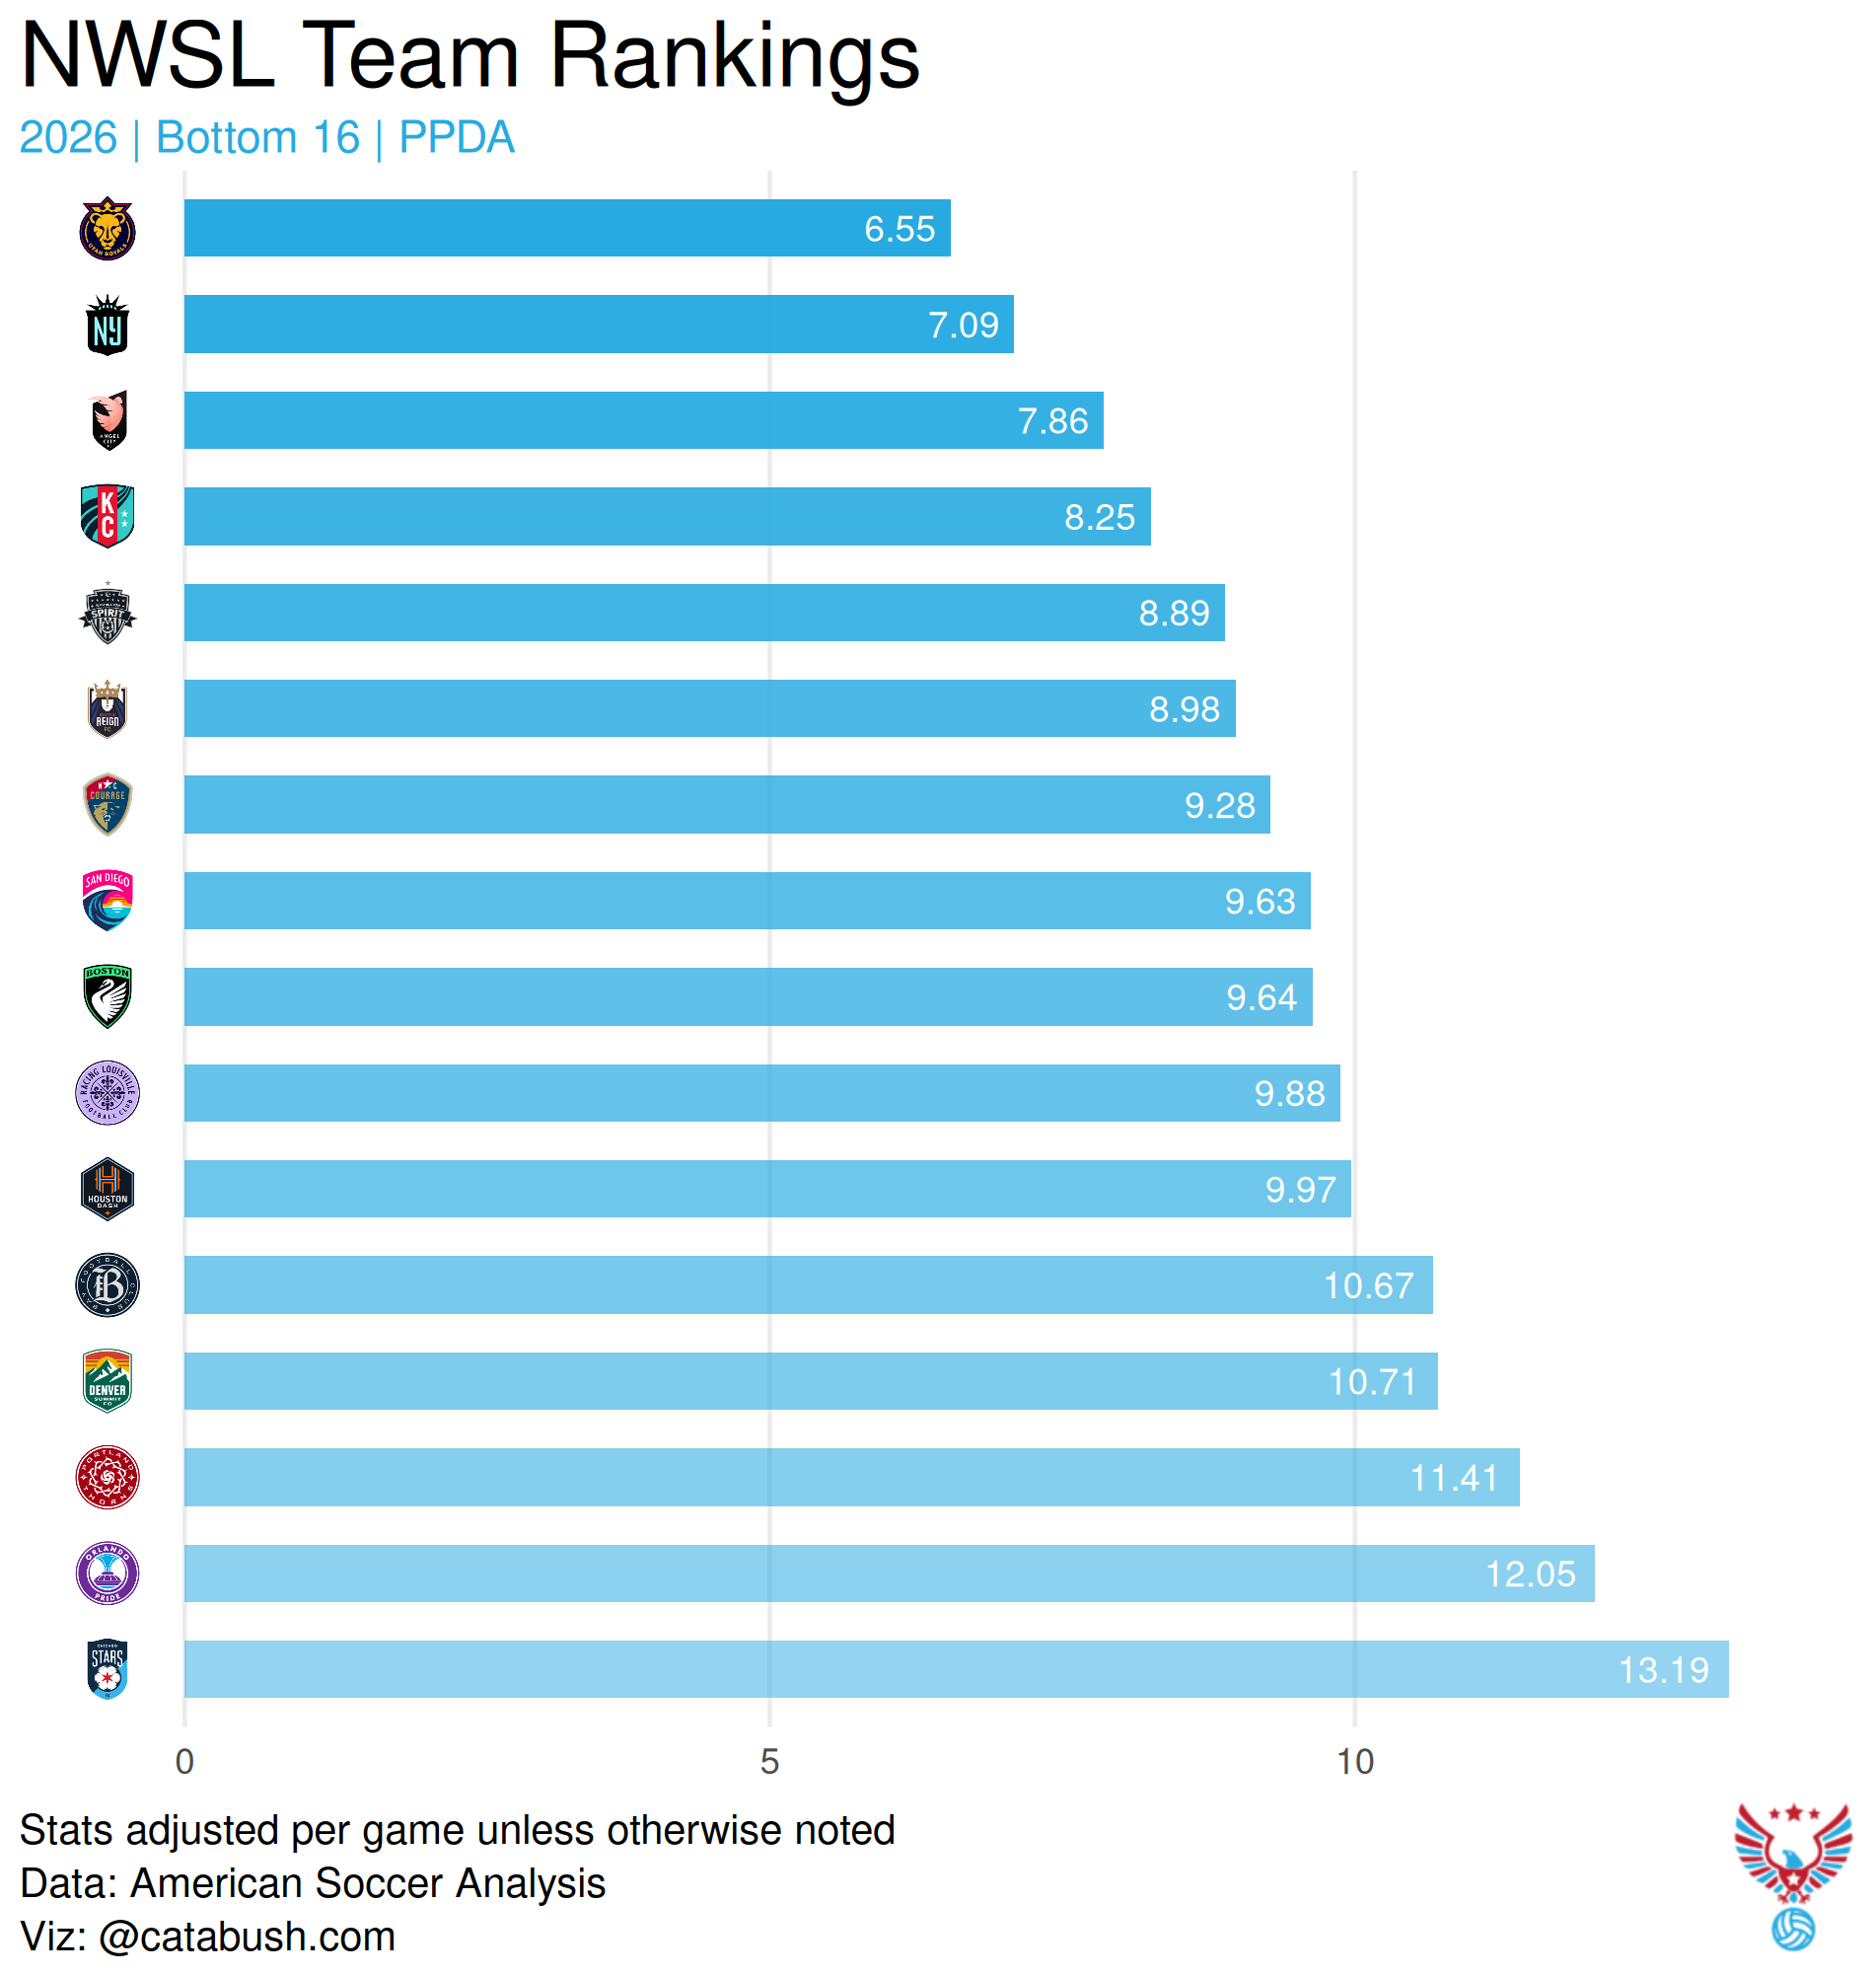
Below, you can see the pressing ratings for MLS and NWSL, as well as the PPDA benchmark from Cata Bush’s Vizhub. At least as a descriptive measure, it feels right, so it’s a good first step. Vancouver, Philadelphia, and New York Red Bulls all leading the way tracks, while Charlotte FC ranks among the bottom in all three components. So far, so good.
Unlike some of the measures of pressure that we use currently, these component rankings seem to provide insight into what teams are prioritizing tactically when they set up pressure. Columbus is winning the ball directly from opponents at a high rate, but isn’t really forcing opponents to misplace passes. On the contrary, Dallas and Seattle seem to excel at forcing turnovers from opponents’ passes, but don’t win the ball back via direct challenges all that often relative to the rest of the league. If we were to dive into coach speak, this is something like man oriented pressing (win it off people) versus zone oriented passing (intercept passes).
Similarly, in the NWSL, the Kansas City Current, Gotham, Wave, and Utah Royals occupying spots in the top four matches the eye test. Like Charlotte above, Chicago ranking last in, well, just about everything, likely matches the conclusion that anyone who watched the Stars in 2026 might draw, too.
The Boston Legacy appear to be an interesting case study here, not really winning the ball back or forcing turnovers in attacking areas, but forcing opponents long at a high rate relative to other teams.
Impacts on Winning
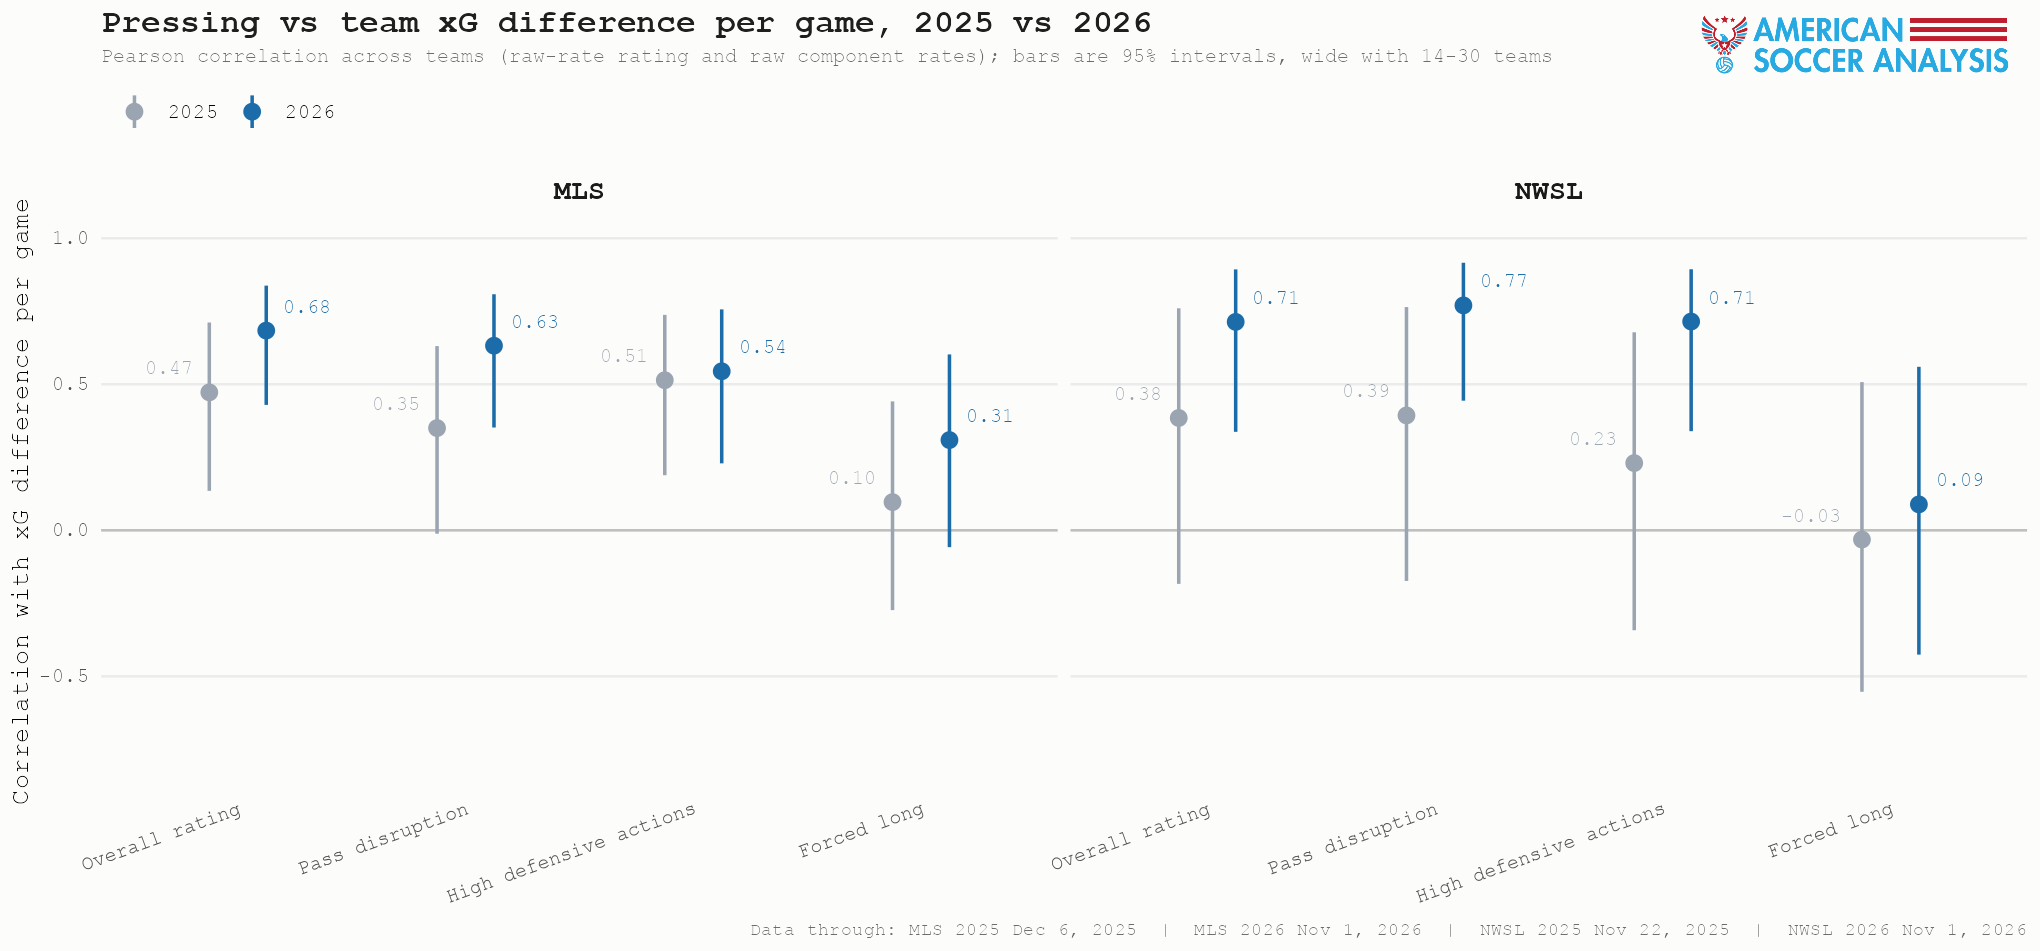
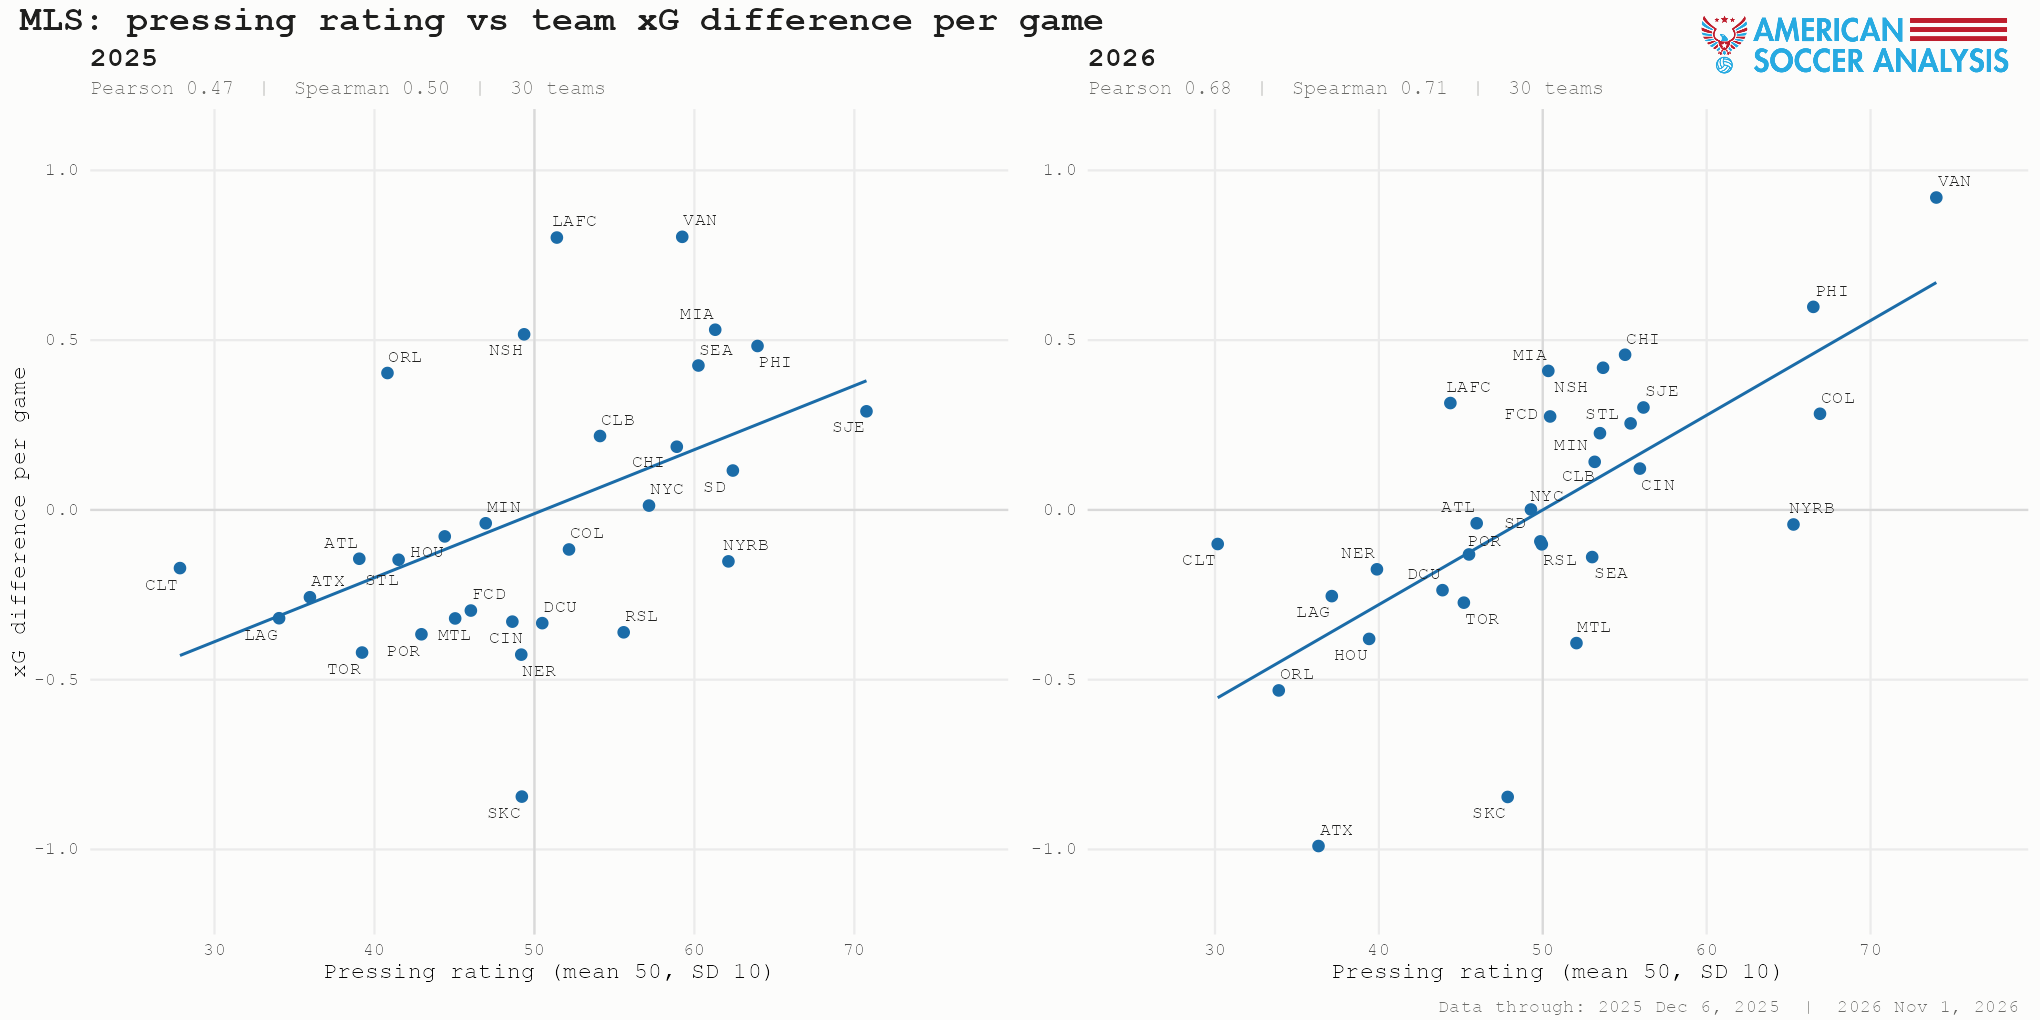
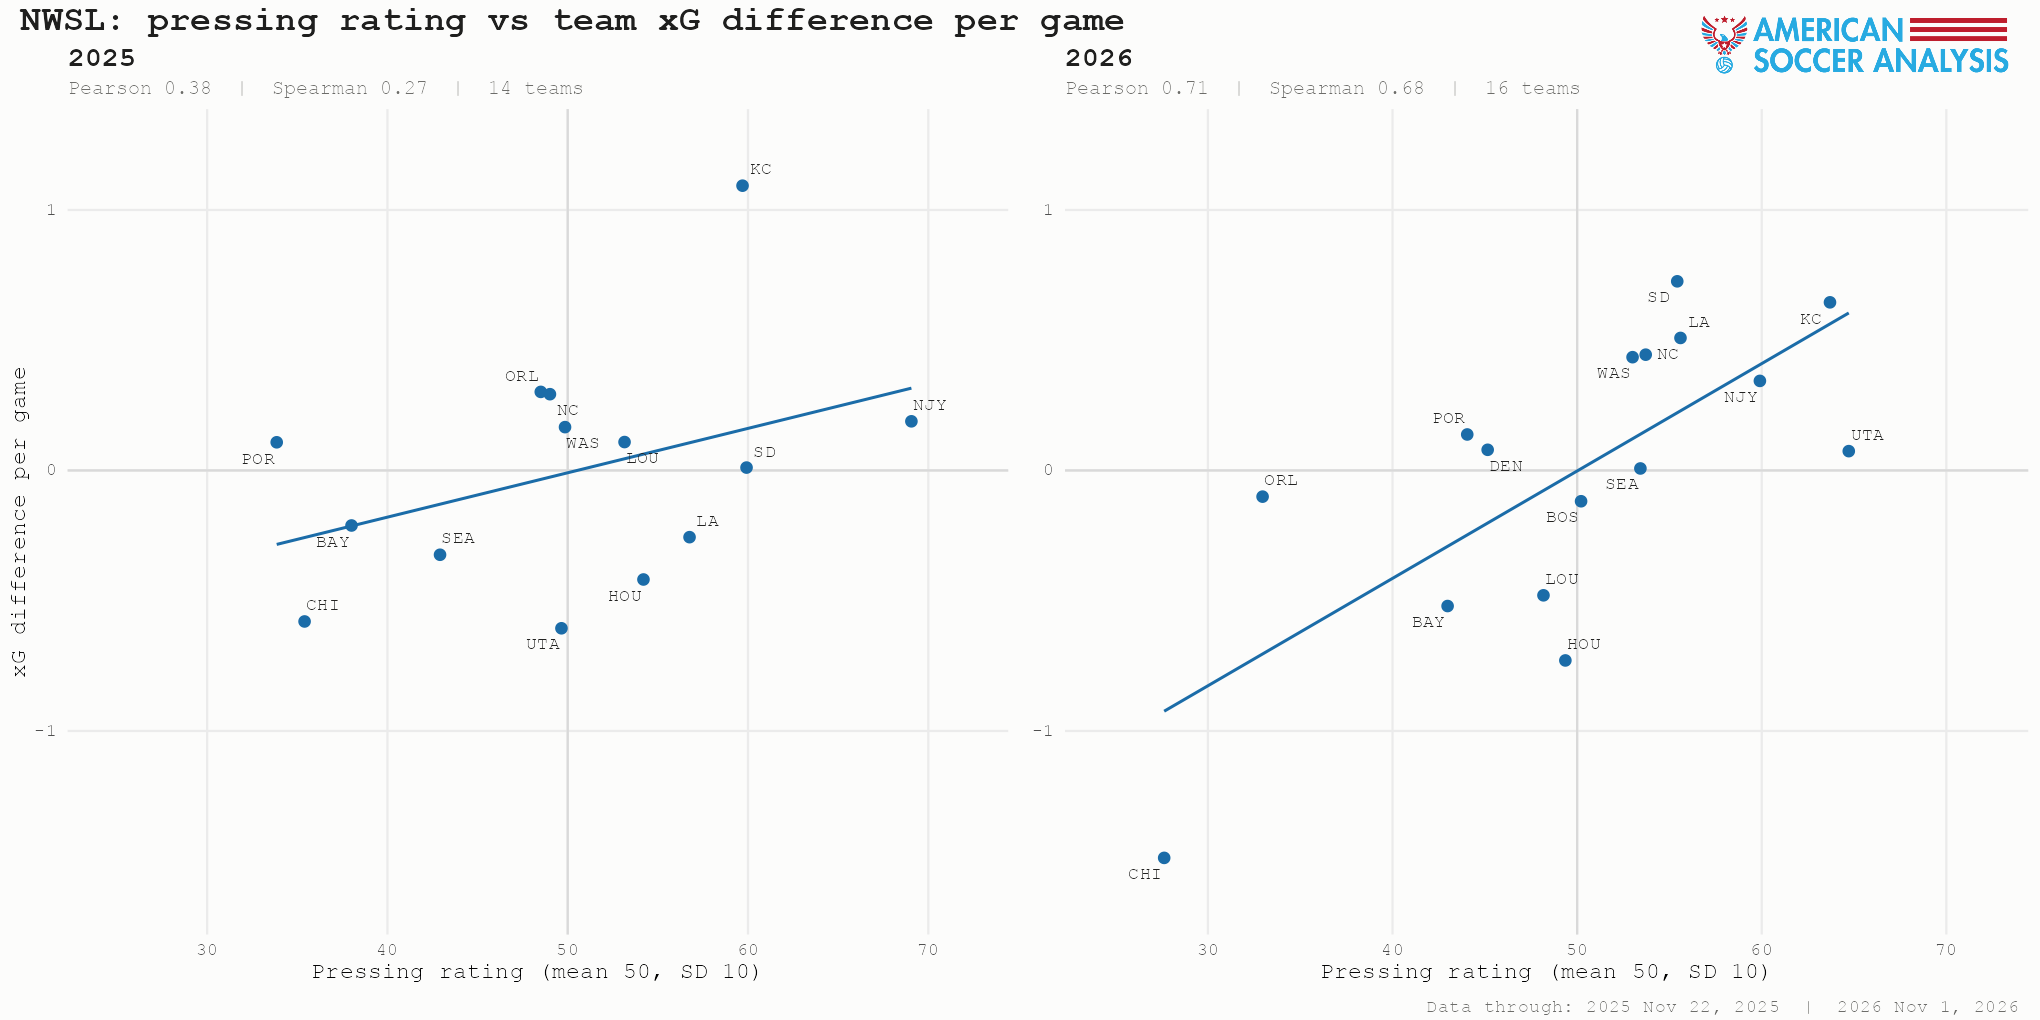
Does it matter? In MLS, the answer over the past two seasons is pretty clearly yes. Teams that press more are better. In NWSL, it’s a little more complicated. This season, being an active pressing team has a strong correlation with having a good expected goal difference. Last year? That wasn’t the case.
Just looking at overall rating in MLS, over the last two seasons the best teams by xGD have usually been the ones that press the most. Though the correlation is stronger so far this season, there was still a moderate relationship between the two variables in 2025. The 2026 NWSL season has seen the best pressing teams have the best seasons. However, after considering 2025 data, it seems that the best teams in NWSL just happen to be pressing a lot, not that the most active pressing teams are always the best ones. Chicago, on the bad side of xGD and pressing rating, make the correlation clearer, as well.
The main takeaway here seems to be that right now, especially in the NWSL, the good teams are good pressing teams, not that good pressing teams are automatically good teams. Correlation =/= causation.
Known Unknowns
Trying to distill how much a team presses using this approach is far from perfect. As mentioned above, players misplace passes for no discernable reason and sometimes players will play direct even without being pressured. Not all high defensive actions are the result of a press or counterpress. It also doesn’t quantify when a team attempts to press and gets played through without registering a defensive action. As mentioned previously, this is much more of a stylistic description than a quality one.
Next Steps
This is very much a work in progress and there are plenty of other areas to explore.
First, the three components are just three outcomes that I came up with. There’s surely a more elegant and effective way to isolate patterns of play involving pressure from the data at hand. Our friends John Muller and Mike Imburgio at Futi, for example, have a fairly sophisticated phase of play model that would better identify actual pressing moments. Additional insights could come from identifying team style or preference in how they want to apply pressure. Just looking at the component rankings and flagging teams good at some things and bad at others seems to indicate different approaches to their goals, but understanding where those turnovers are happening on the field could also provide useful context to what’s actually happening on the field, not just on the spreadsheet. Trying to separate counterpressing versus pressure applied after stoppages of play might also be a worthwhile distinction to try to draw in the future.
Then there’s the question of efficacy. Right now, with the nature of event data, these ratings seem to be a measure of both how active and how effective a team’s pressure higher up the field is. However, there’s no distinction between a regain 40 yards from goal on the sideline and one on the edge of the box, and the latter is certainly more valuable for winning a soccer game than the former.
But as a first attempt, as mentioned above, it tracks pretty closely with the eye test as well as already existing measures. Hopefully this pushes this pressing conversation (a pun which I won’t apologize shoehorning in at the end of this) forward so that we can better understand what is an essential part of soccer today.