

Throw-in It Back
/Towards a manual for the most common restart
Whether you love long attacking throw-ins or hate them, there is no denying that they’ve become both a key feature and flashpoint in men’s soccer in the past year. John Muller likely sparked a renaissance of the tactic (and a soon-to-be Arsenal title) with his 2023 article for The Athletic, and Joe Lowery and I borrowed his method for Backheeled when Minnesota United started longthrowmaxxing in 2025 (Editor’s note: Minnesota work with Mike Imburgio through ASA’s firewalled consulting arm). But while each game has about 40 throw-ins on average, only about 10 of those throws happen close enough to reach the box. But apart from Formerly Called Twitter jokes about consultant Thomas Grønnemark, there hasn’t been much commentary about all the other ones in popular media or public analytics circles. The only exceptions I’m aware of are Eliot McKinley’s 2018 two-part opus on this very website, and some recent academic work on the top 5 European leagues that, if you like in-text citations and interpreting regressions, is an excellent spoiler for the rest of this article.
Eliot did that work almost a decade ago (before Game of Thrones jumped the shark), and I thought it was time to replicate and extend those findings with all the amazing infrastructure that ASA has built since the days of CSV files on Dropbox. In addition to models estimating throw completions and retained possession, I also analyze the goals added for possessions following throws to assess the value of throw choices. This allows me to find the MLS throw-in MVPs and offer an expanded set of (very general) rules for approaching these overlooked moments of play.
A Quick Recap
Before we dive into the updated data, let’s quickly recap the first two seasons of Game of Throw-ins. In Part One, Eliot took ASA’s trusty xPass model and tweaked it for throws in two ways: adding a predictor for time since the previous event (xThrow), and using retaining the possession as another measure for a successful throw (xRetain). We also need to remind ourself of some important definitions: 1) a successful throw (measured by xThrow) is a throw that is touched by a teammate first 2) a retained throw is a throw that your team has possession afterwards. You can chuck it at someone’s head, they flick it on to an opposition defender (successful, but not retained), or you can Chauncey Billups it off a defenders back and take the ball yourself (unsuccessful, but retained).
After picking apart these models, he offered three lessons for coaches to instill in players:
Don’t let the ball go out of bounds deep in our own half if you can prevent it. It is basically a coin-flip whether or not your team will retain possession after a throw-in in your defensive third. So if there is not a lot of pressure from an opponent, hustling a bit to keep the ball in bounds is a smart decision.
Use when our opponent has a throw-in in their defensive third as a pressing trigger. The likelihood of a turnover following a throw-in is high so be prepared to take advantage of it.
Take your throw-ins 5-10 seconds after the ball goes out of play. I would have my players immediately get into positions to receive a throw-in before my opponents get set. I’d also employ some gamesmanship (at least in CCL), perhaps having my players try to slow down an opponent from taking a throw-in to allow my defense to get into shape.
One of the interesting developments when reading back through the original research is that #2 has definitely become a thing. More or less every week we see teams smash kickoffs directly out of play near the corner flag to set up their press to start the game. Neat.
In Part Two, Eliot clustered MLS teams based on throw-in direction choices, and evaluated teams and players on their retention success compared to model expectations. He found that while most teams had no defined style, some were clearly coached to throw forward, and others were told to spread the ball around, and especially backwards.
There was a lot of noise in these results, but I noticed that two teams and their fullbacks had particular success retaining throws by spreading the ball around and taking them backwards, and they were coached by Gregg Berhalter and Peter Vermes who favored possession-focused styles at the time. More than anything, Part Two suggests that few coaches were paying particular attention to throws, and that throwing it backwards seems helpful for retaining possession, if that’s your thing (and it was Gregg’s and Peter’s thing).
While retaining possession is useful, having the goals added for every possession following each throw means we can push this analysis further. This lets us better understand how these decisions affect the immediate odds of scoring. Do throws down the line make up for their low success odds with increased goal danger? Can teams reduce their risk of turnovers while also generating attacking value? Which are the best throw choices in different areas of the pitch?
Mapping throws and outcomes
As I was working on the models, I realized that I was struggling just thinking through all the possible throws available. Consider a throw that a player receives right on the half line. That could have been taken 30 yards behind them, 30 yards in front, or anywhere in between, and that context drastically changes what the throw really is. Similarly, the spread of throw targets in the attacking third is surely different from the spread in the defensive third. How can I visualize this complexity when there are so many overlapping patterns? There’s really only one answer: it has to be interactive.
Before you continue reading, sit with this for a bit. Click around the touchlines, check the different metrics, and note the patterns of where throws go and how they tend to end up. Both sidelines show roughly the same patterns, so we can focus on what happens when we move up and down the touchline.
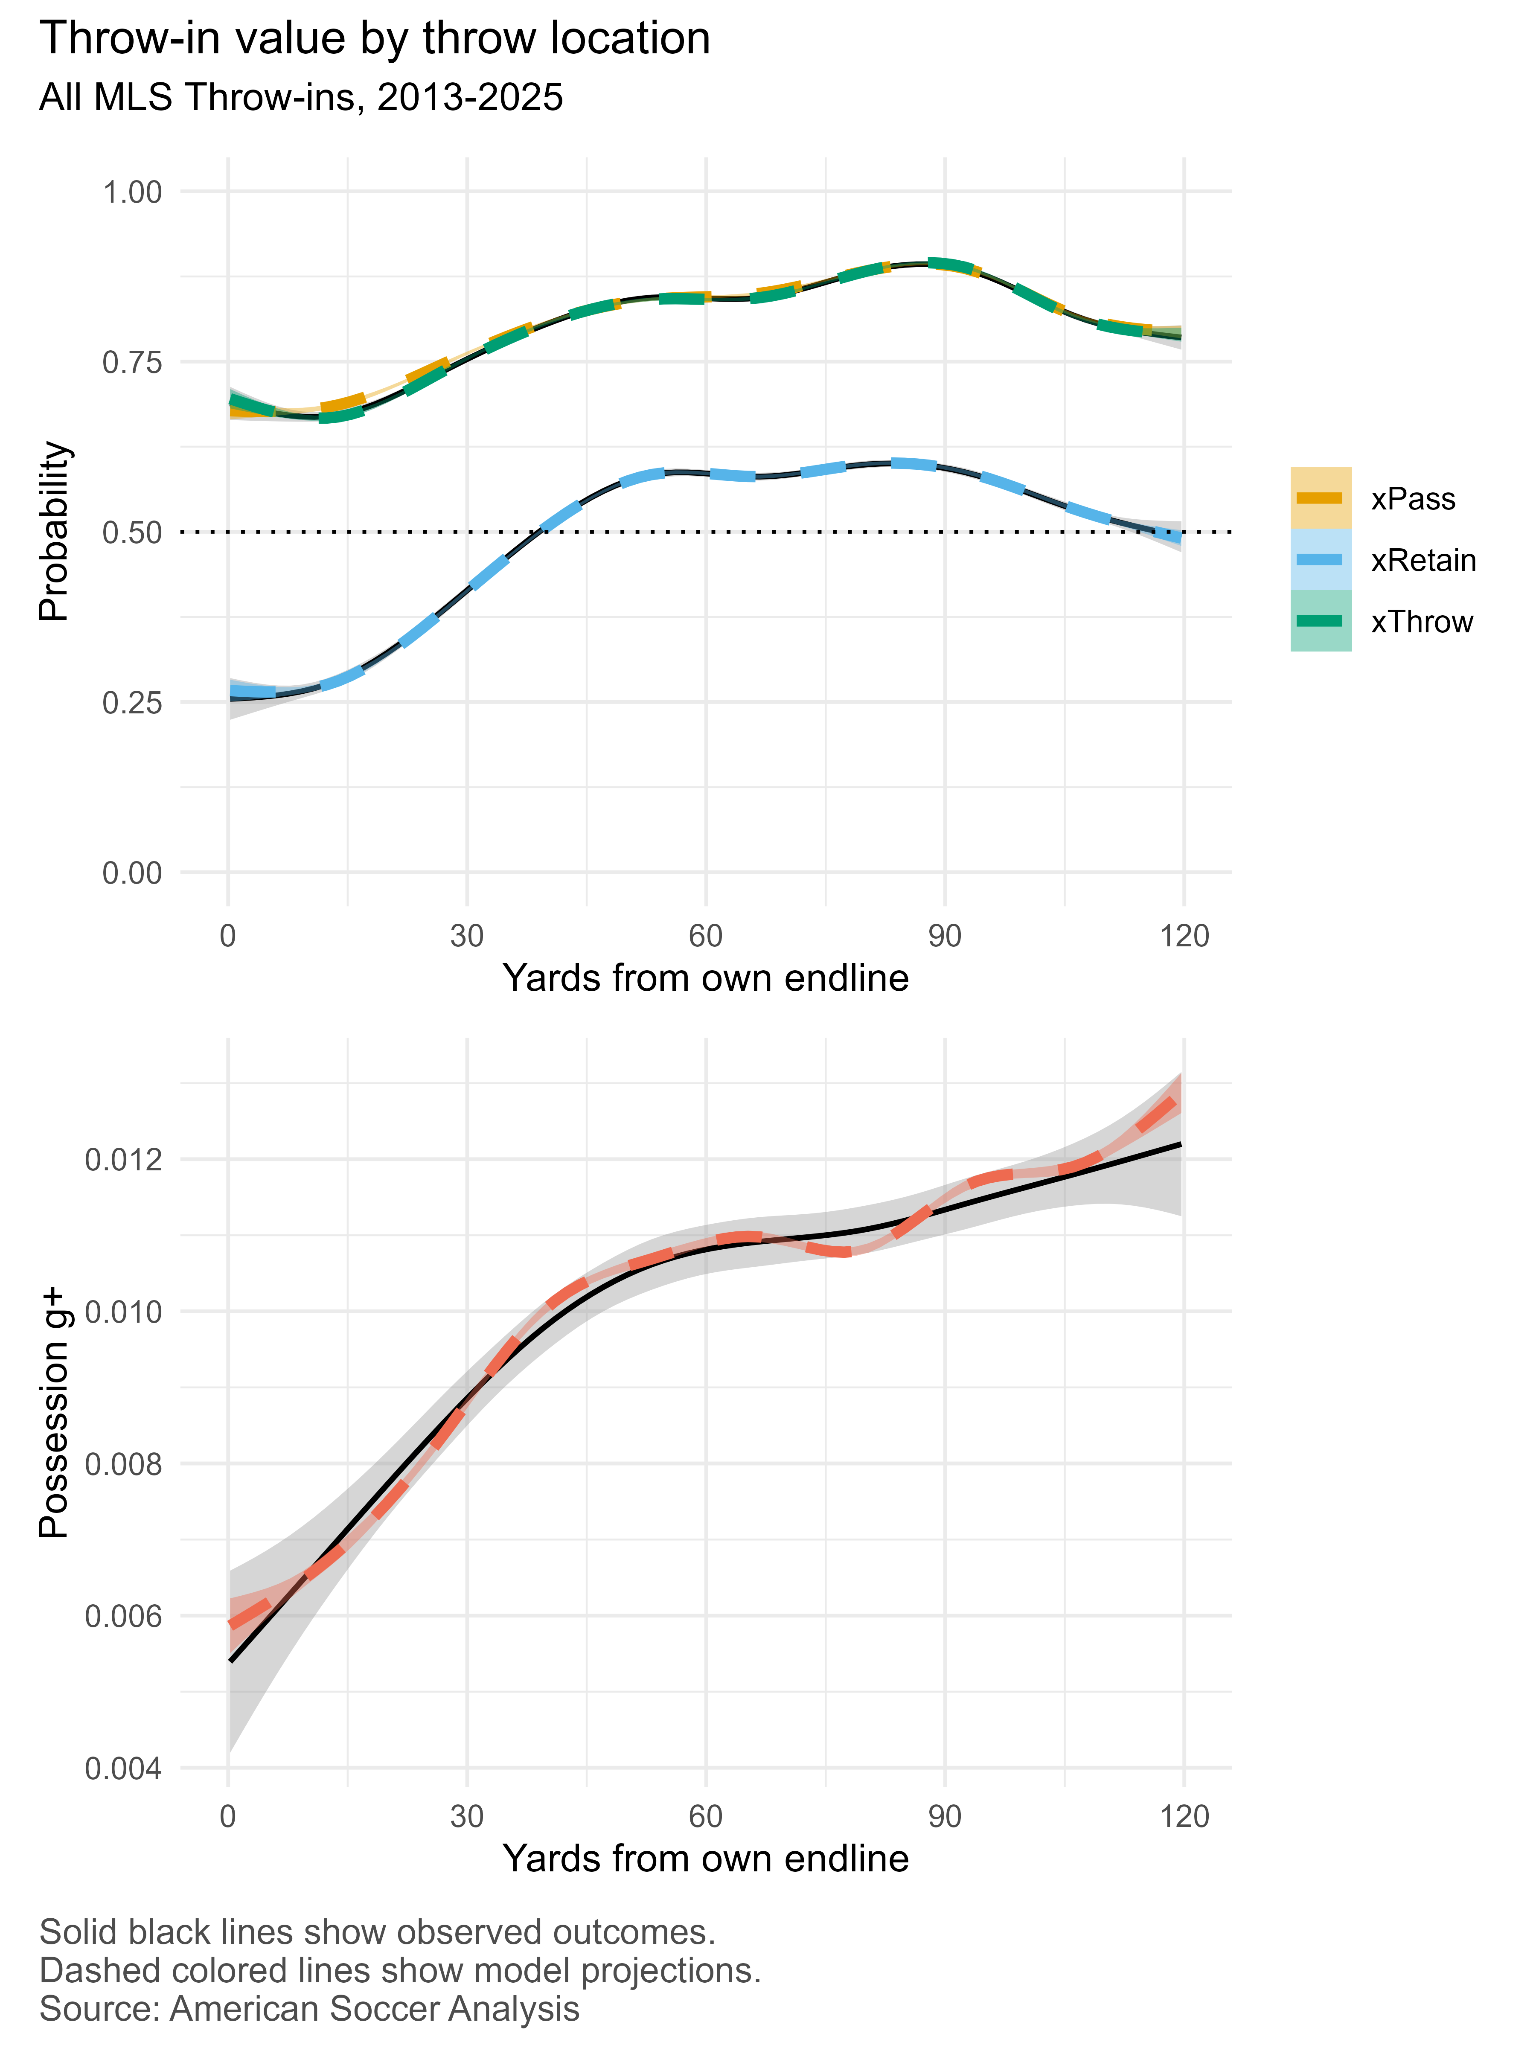
Taking a throw from your own defensive corners is a rare but dangerous situation. There are truly no reliably good options, as retention rates and possession values are some of the worst in the data. The next few origin zones start to show some patterns. The most popular target zones are forward towards goal, but these have low retention rates and possession values. Backwards passes start to see favorable retention rates, and throws toward a team’s own goal actually have the highest possession values by g+. This is an interesting finding, it goes somewhat against most traditional g+ evaluations, which frequently prioritize large field positions over everything. Such evaluations have even given rise to launch and squish ball, evidently not on deep throw ins.
As you approach midfield, these patterns evolve and solidify. The overall spread of where throw-ins go grows, and it becomes increasingly clear that forward throws in the defensive half are not worth much. They consistently have lower retention rates and possession values while backwards throws yield better retention and g+ value. Forward throws just short of the midfield line are especially suspect, but possession values start to improve as these throws start to go past midfield. Zones with the highest g+ values are some of the furthest, usually backwards but often in lateral and attacking directions too. In general, long throws (likely to teammates in space) are the highest upside choices. This tracks, given oppositions are likely coming to condense the area as much as possible. The upside of trying to connect passes inside is a fun finding, as it mostly goes counter to many years of coaching orthodoxy. In your own half, throw it up the line, gain yards, then you can build from there. Even thirty yards from your own goal, trying to find a midfielder to go the other way seems to be significantly more valuable.
Once the ball thrower is into the attacking half, their options begin to open up even more. Putting the ball close to the box immediately becomes a high-value option, and new gaps near the goal line open up too. The retention rates of forward passes improve, and they actually surpass the completion rates when thrown into the box. But the risks also seem to increase, as this seems to be where most of the negative g+ average tiles appear, intermixed with highly valuable zones. These are likely driven by counter attacks on unbalanced teams, or juicy turnovers trying to play back to the middle of the field.
Backwards passes lose some of their reliability, but there are pockets where they still generate dangerous possession when throws have reached the final third. Short throws also become viable–while they are often pressing triggers for the opposing team when taken in the defensive half, the reduced distance to goal may force defenders into withdrawn positions, creating more space. And in an article about throw-ins, the line you all came for, long throws into the mixer remain very worthwhile.
In general, this tool shows how the geography of the pitch is foundational for optimizing throw-ins. Team strategy can influence how many throws are taken and where. Additionally, players can better understand which areas to look and move to when putting the ball back into play. Unless your team is built to win 50-50 challenges and repress when you lose them, crowding everyone forward is a bad strategy. Or unless you can reach the box. Then definitely consider crowding everyone forward.
Modeling throw outcomes
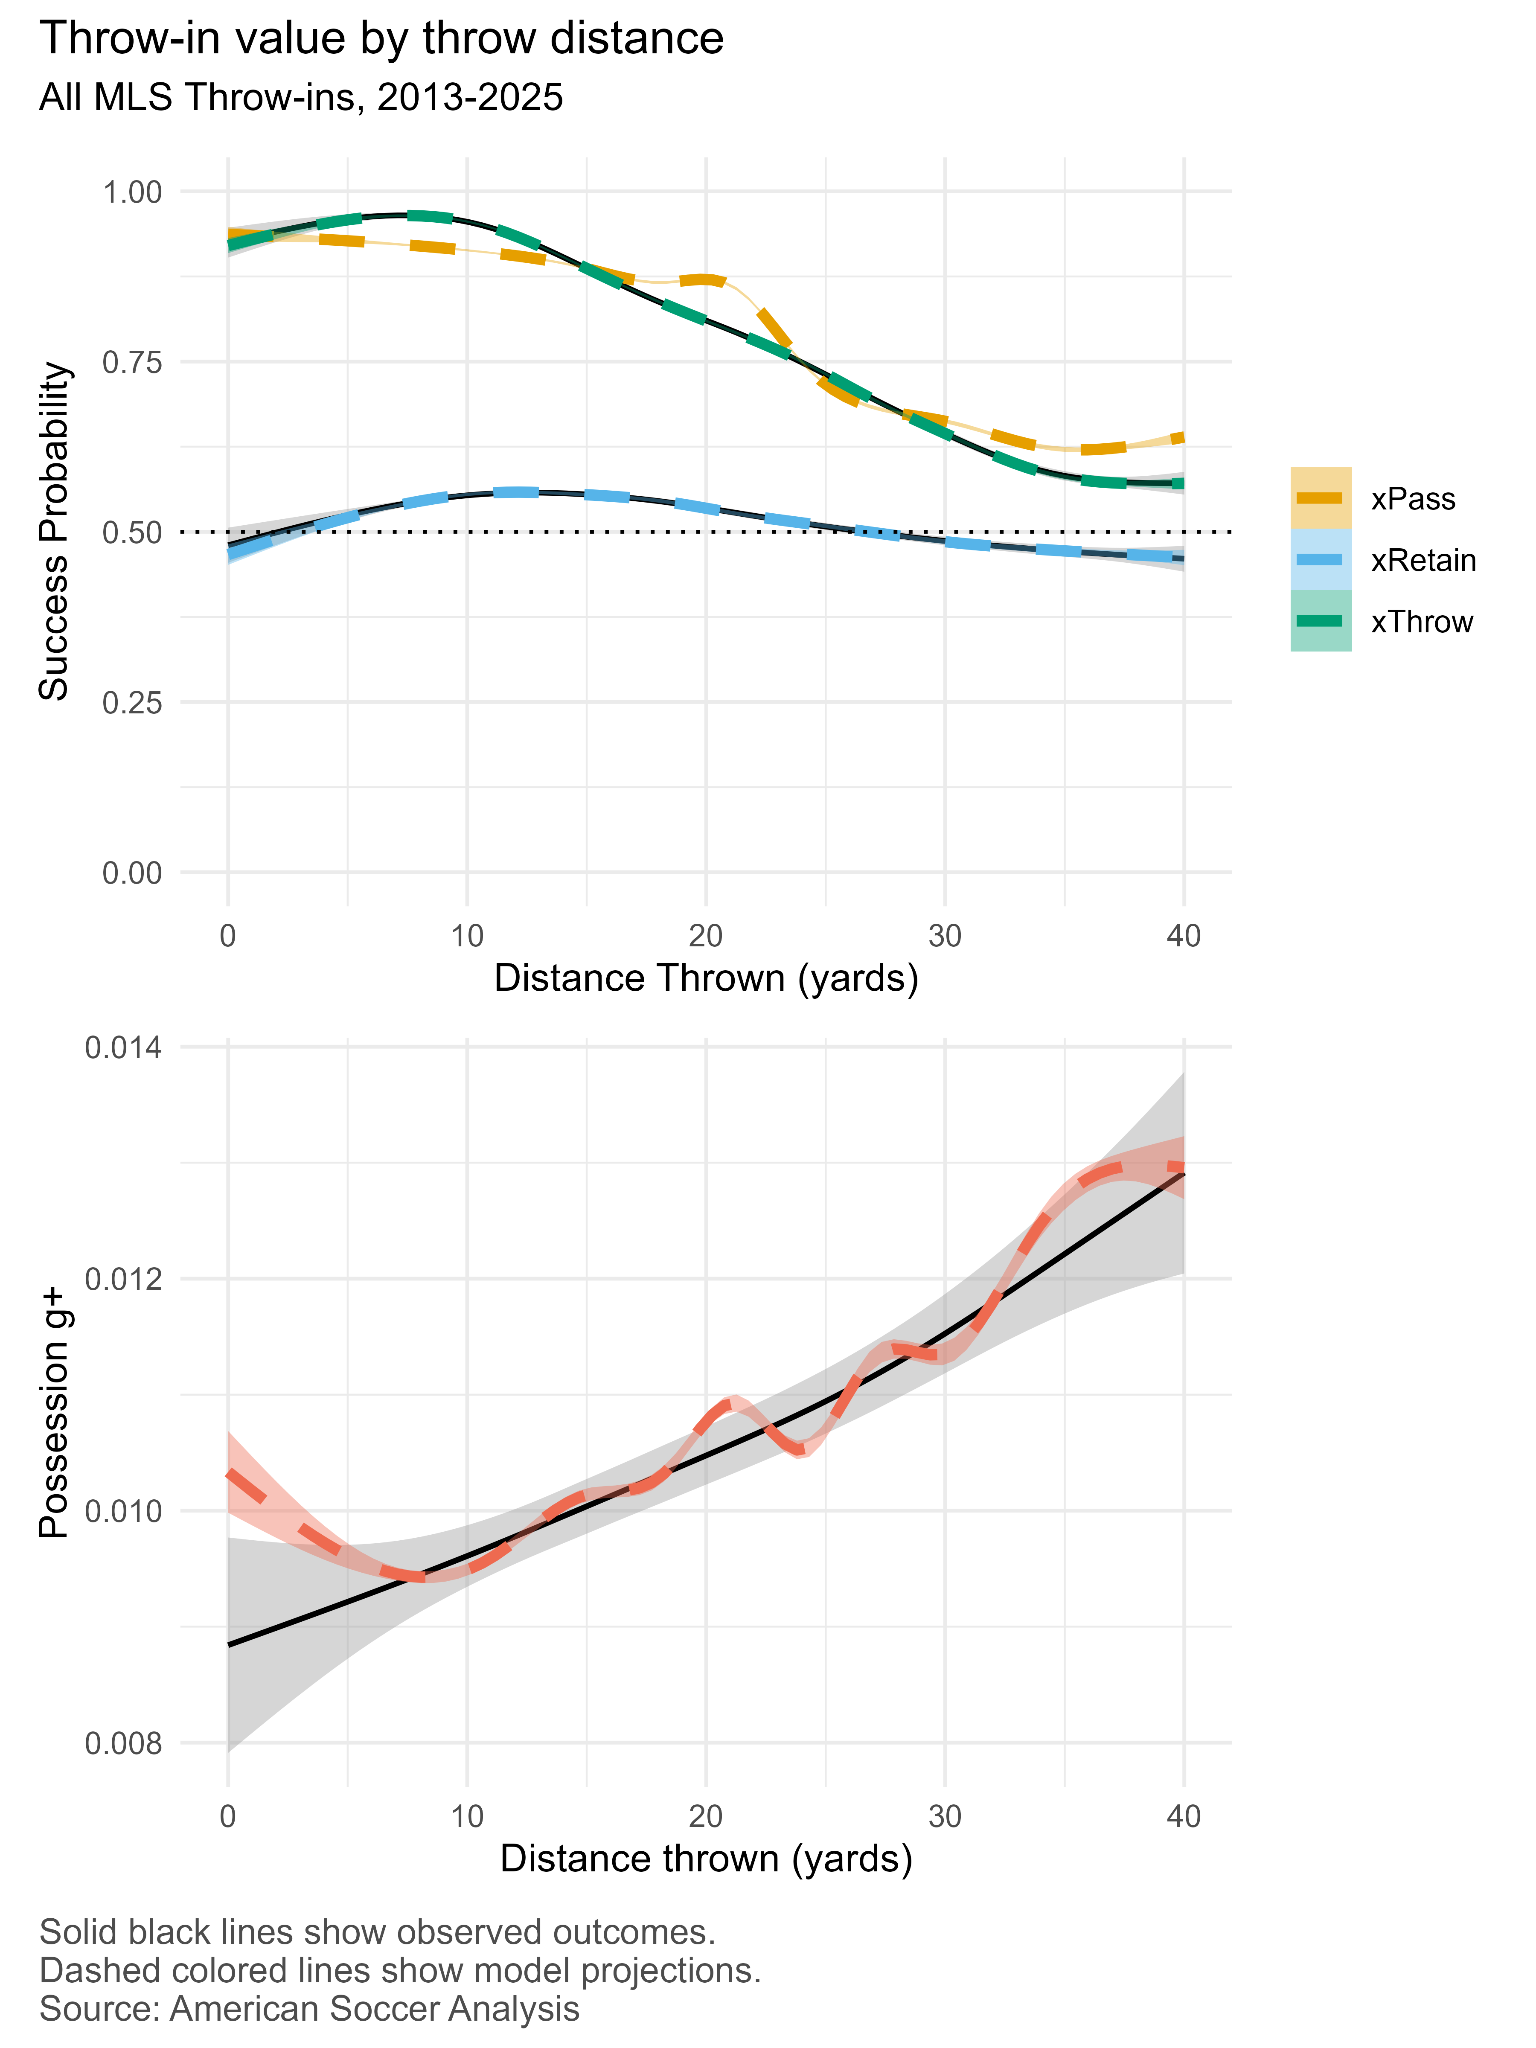
I follow Eliot’s modeling framework, but with a few of my own tweaks. The first is that, instead of Cheuk Hei Ho’s possession definitions from his expected possession goals work (ASA’s first possession value-ish model), I am using the possessions as defined for goals added. I did not design either algorithm for identifying possessions, but they clearly have some differences. Far fewer goals added possessions reached longer than 7 seconds after a throw, leading to much lower retention rates in this analysis. However, if you compare to Eliot’s article, you’ll see that the lowest retention values mostly got much lower, leaving all the conclusions intact if not stronger. I also use possession g+ as a dependent variable for a third GBM, and based on the descriptive results above, I changed the long ball flag into a continuous throw distance predictor. This would be a mistake in a general xPass model, but errant passes or blocks are far less common from throws than during open play.
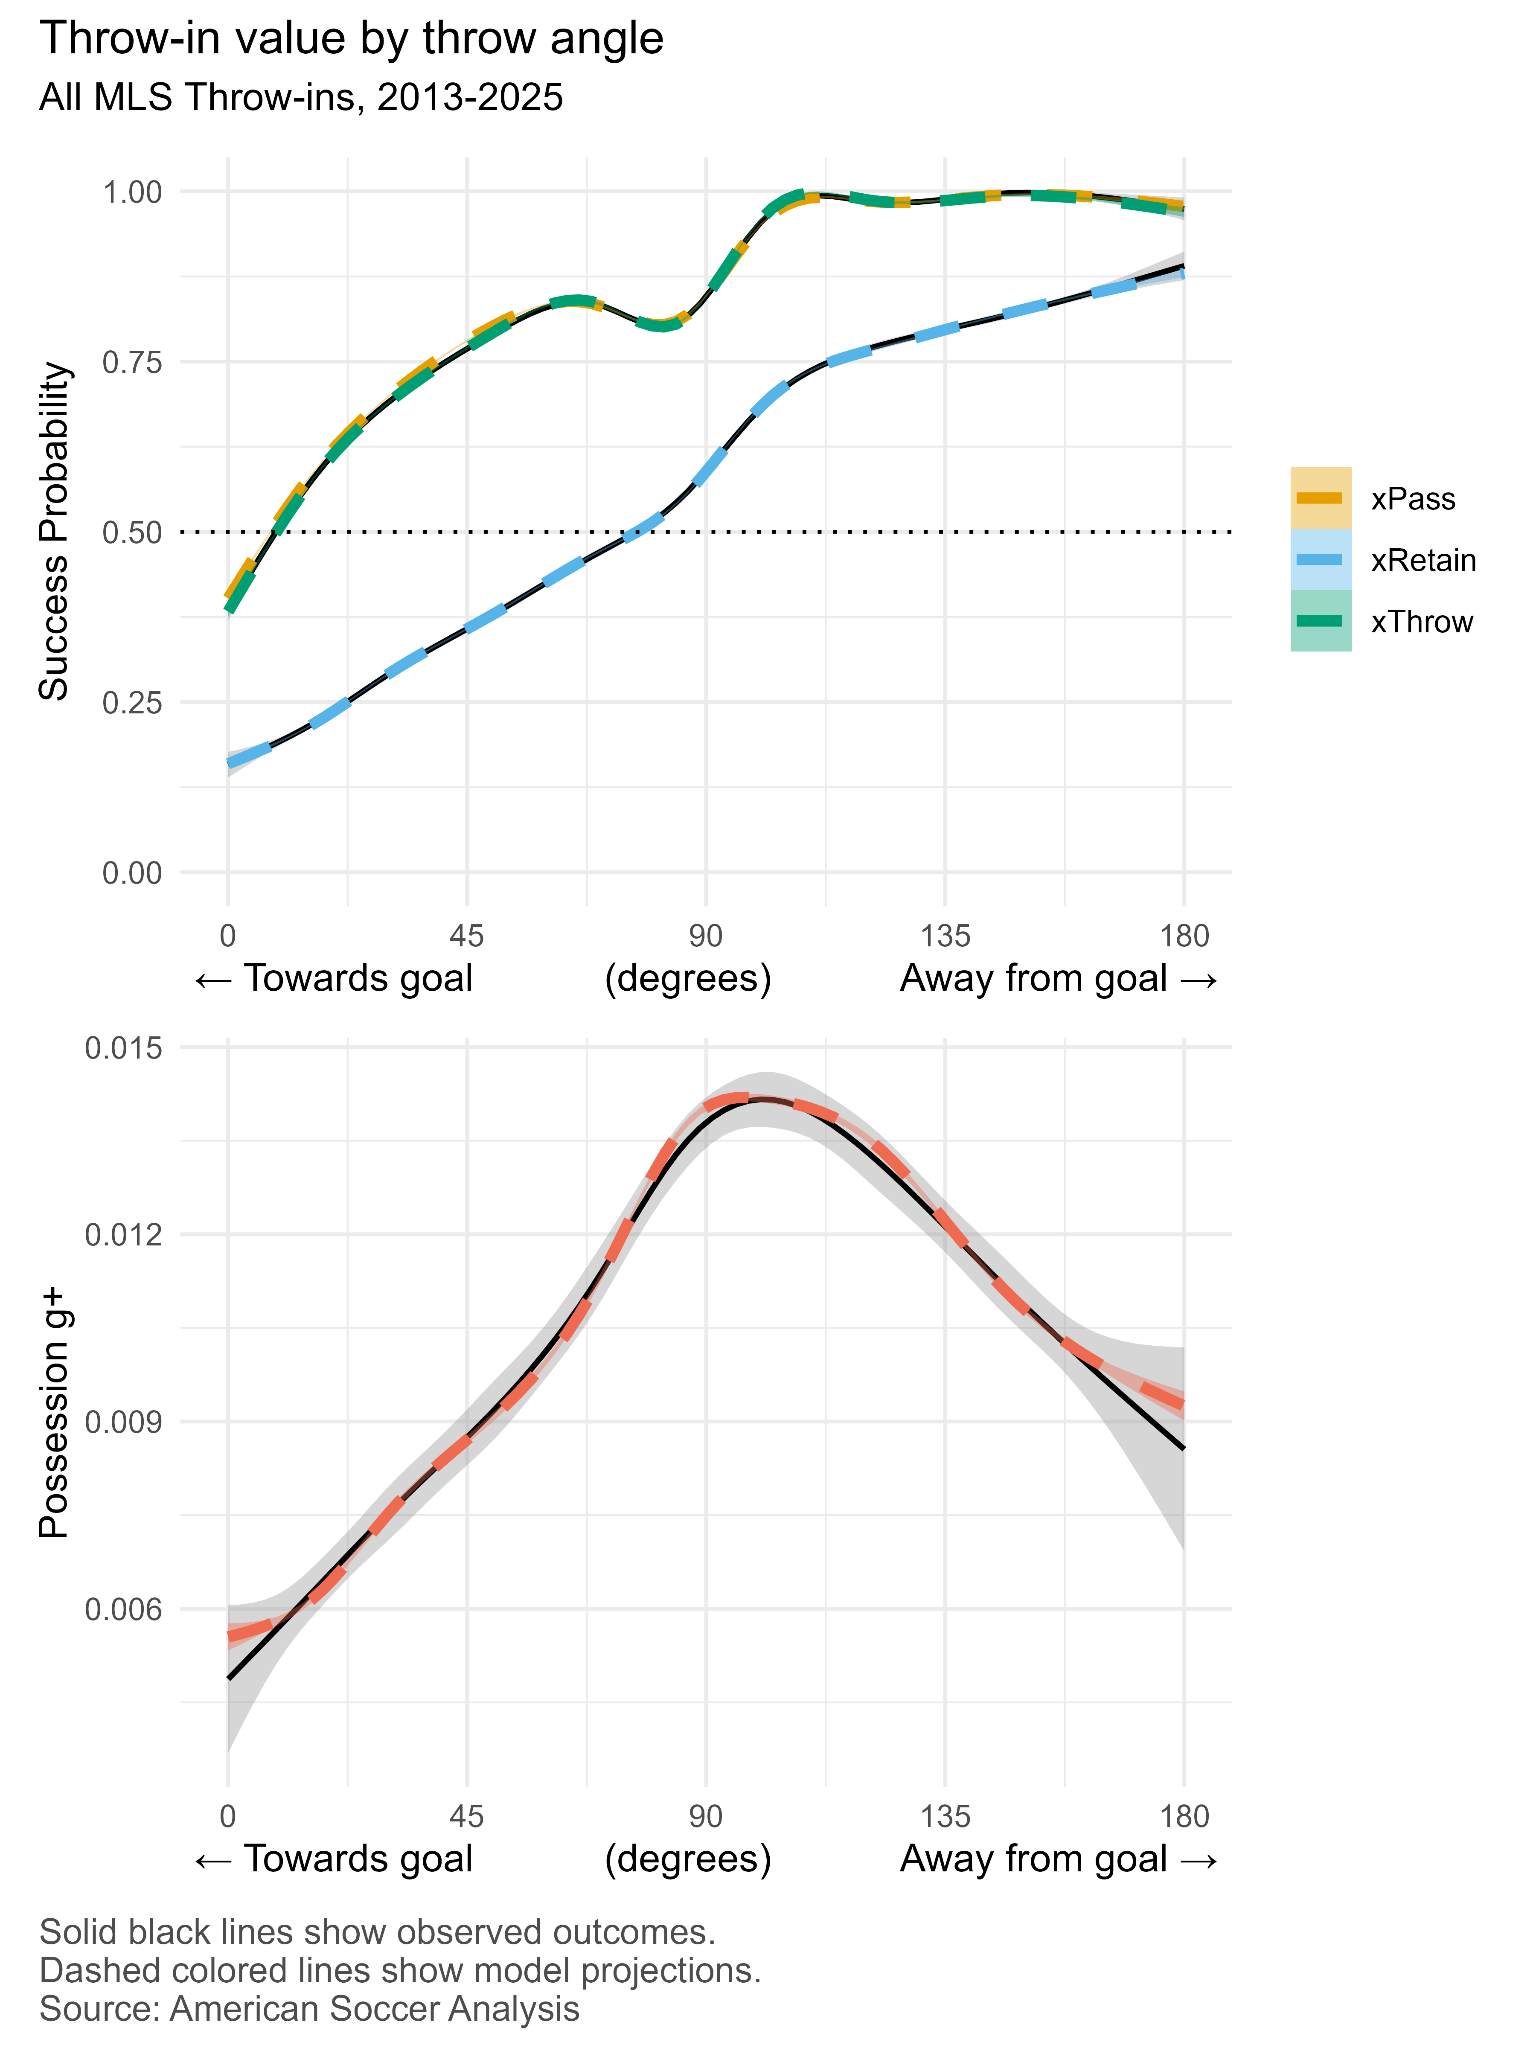
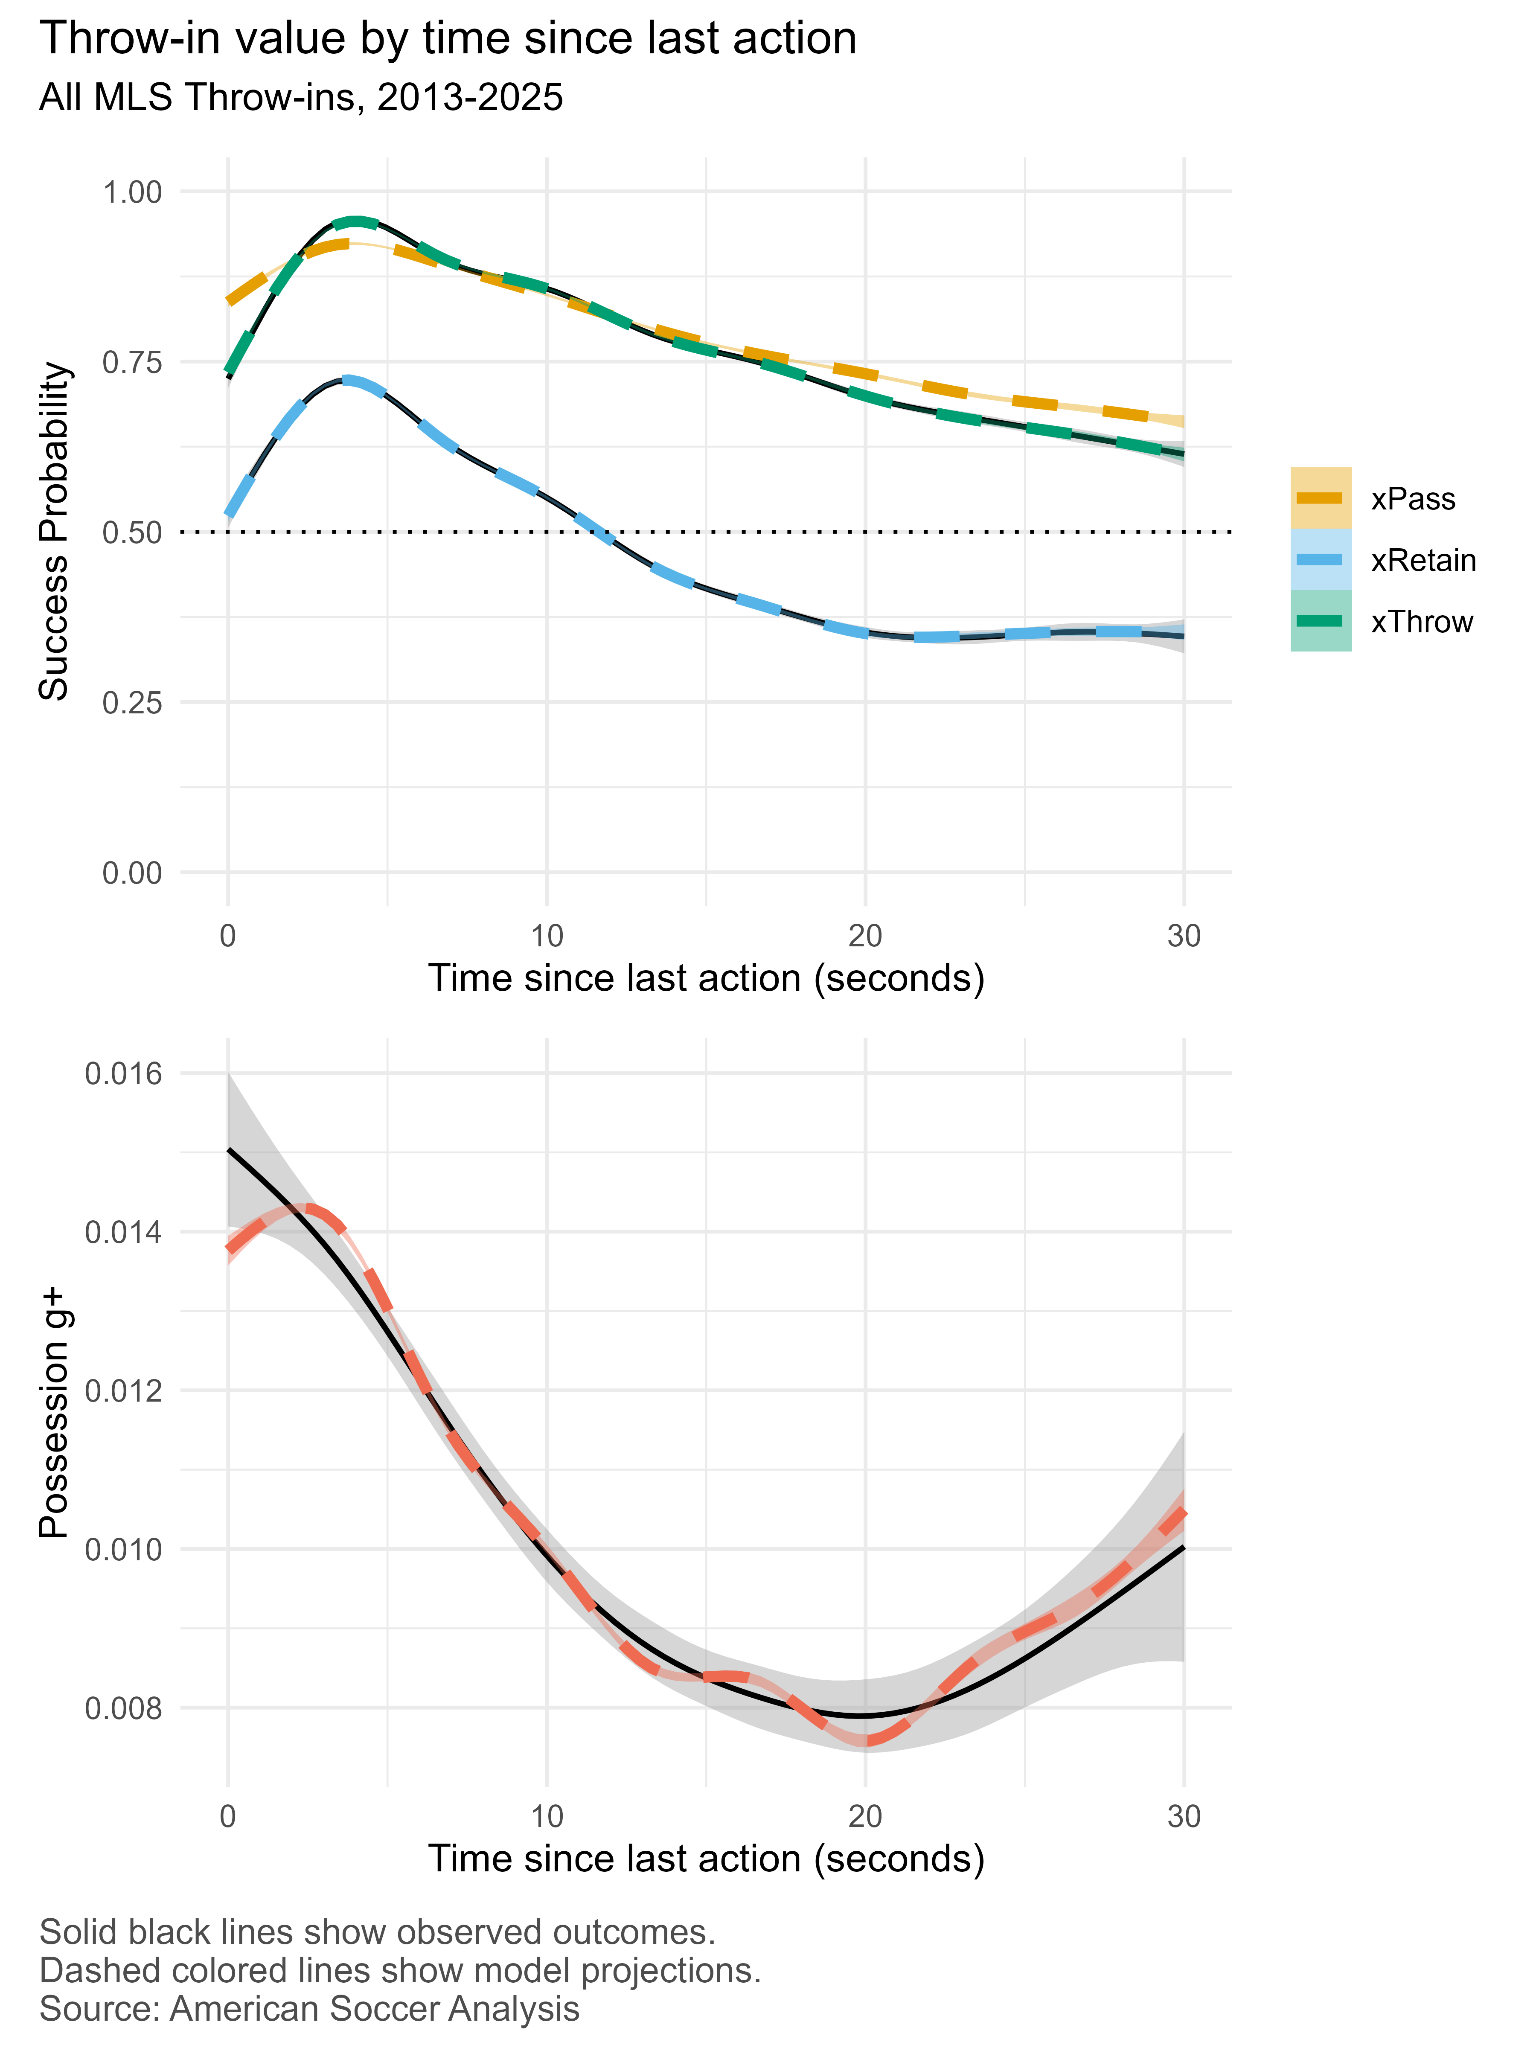
These results are consistent with both the old model results and the interactive viz drawing from 13 seasons of MLS throw-ins. Completion and retention rates are very low for throws down the line towards goal, but increase as the angle opens and pans back towards a player’s own goal. Similarly, chances of throw success increase as the throw-in gets further from a player’s own goal, with a slight decline as you approach the opponent’s goal. Including the distance thrown as a continuous variable seems to help model accuracy, as my current xThrow model tracks its observed values much closer than Eliot’s did. And finally, taking throws within 10 seconds of the previous on-ball action, before the defense can get in position, maximizes the chance of throw success.
However, one of the really seminal findings from the development of g+ here is that retention and completion rates are overrated, at least in the final third. Sometimes the outcome of an even improbable event, like a Michael Boxall 45 yard trebuchet into the box, is so worthwhile that the completion rate is almost secondary. Consider distance thrown – xThrow says that the odds of success decline the longer you throw it, while xRetain says it doesn’t have much effect on keeping possession. But like we saw in the interactive descriptive map, long throws have more value in terms of g+, and that it’s basically a linear relationship. Incorporating goals added shows more context on throw angle – xThrow and xRetain are at their lowest with shallow, attacking angles, increase as the angle approaches a lateral throw, and plateau once throws pass 90 degrees and start going backwards. Projected g+ also starts at its minimum and increases rapidly, but once it hits a maximum value between 90 and 100 degrees (ie. towards the middle of the field), possession value starts to decline again as the angle continues to increase. Time since last action is the most consistent trend across all throw outcomes, with g+ value peaking just short of five seconds alongside xThrow and xRetain.
John Elway and Shannon Sharpe
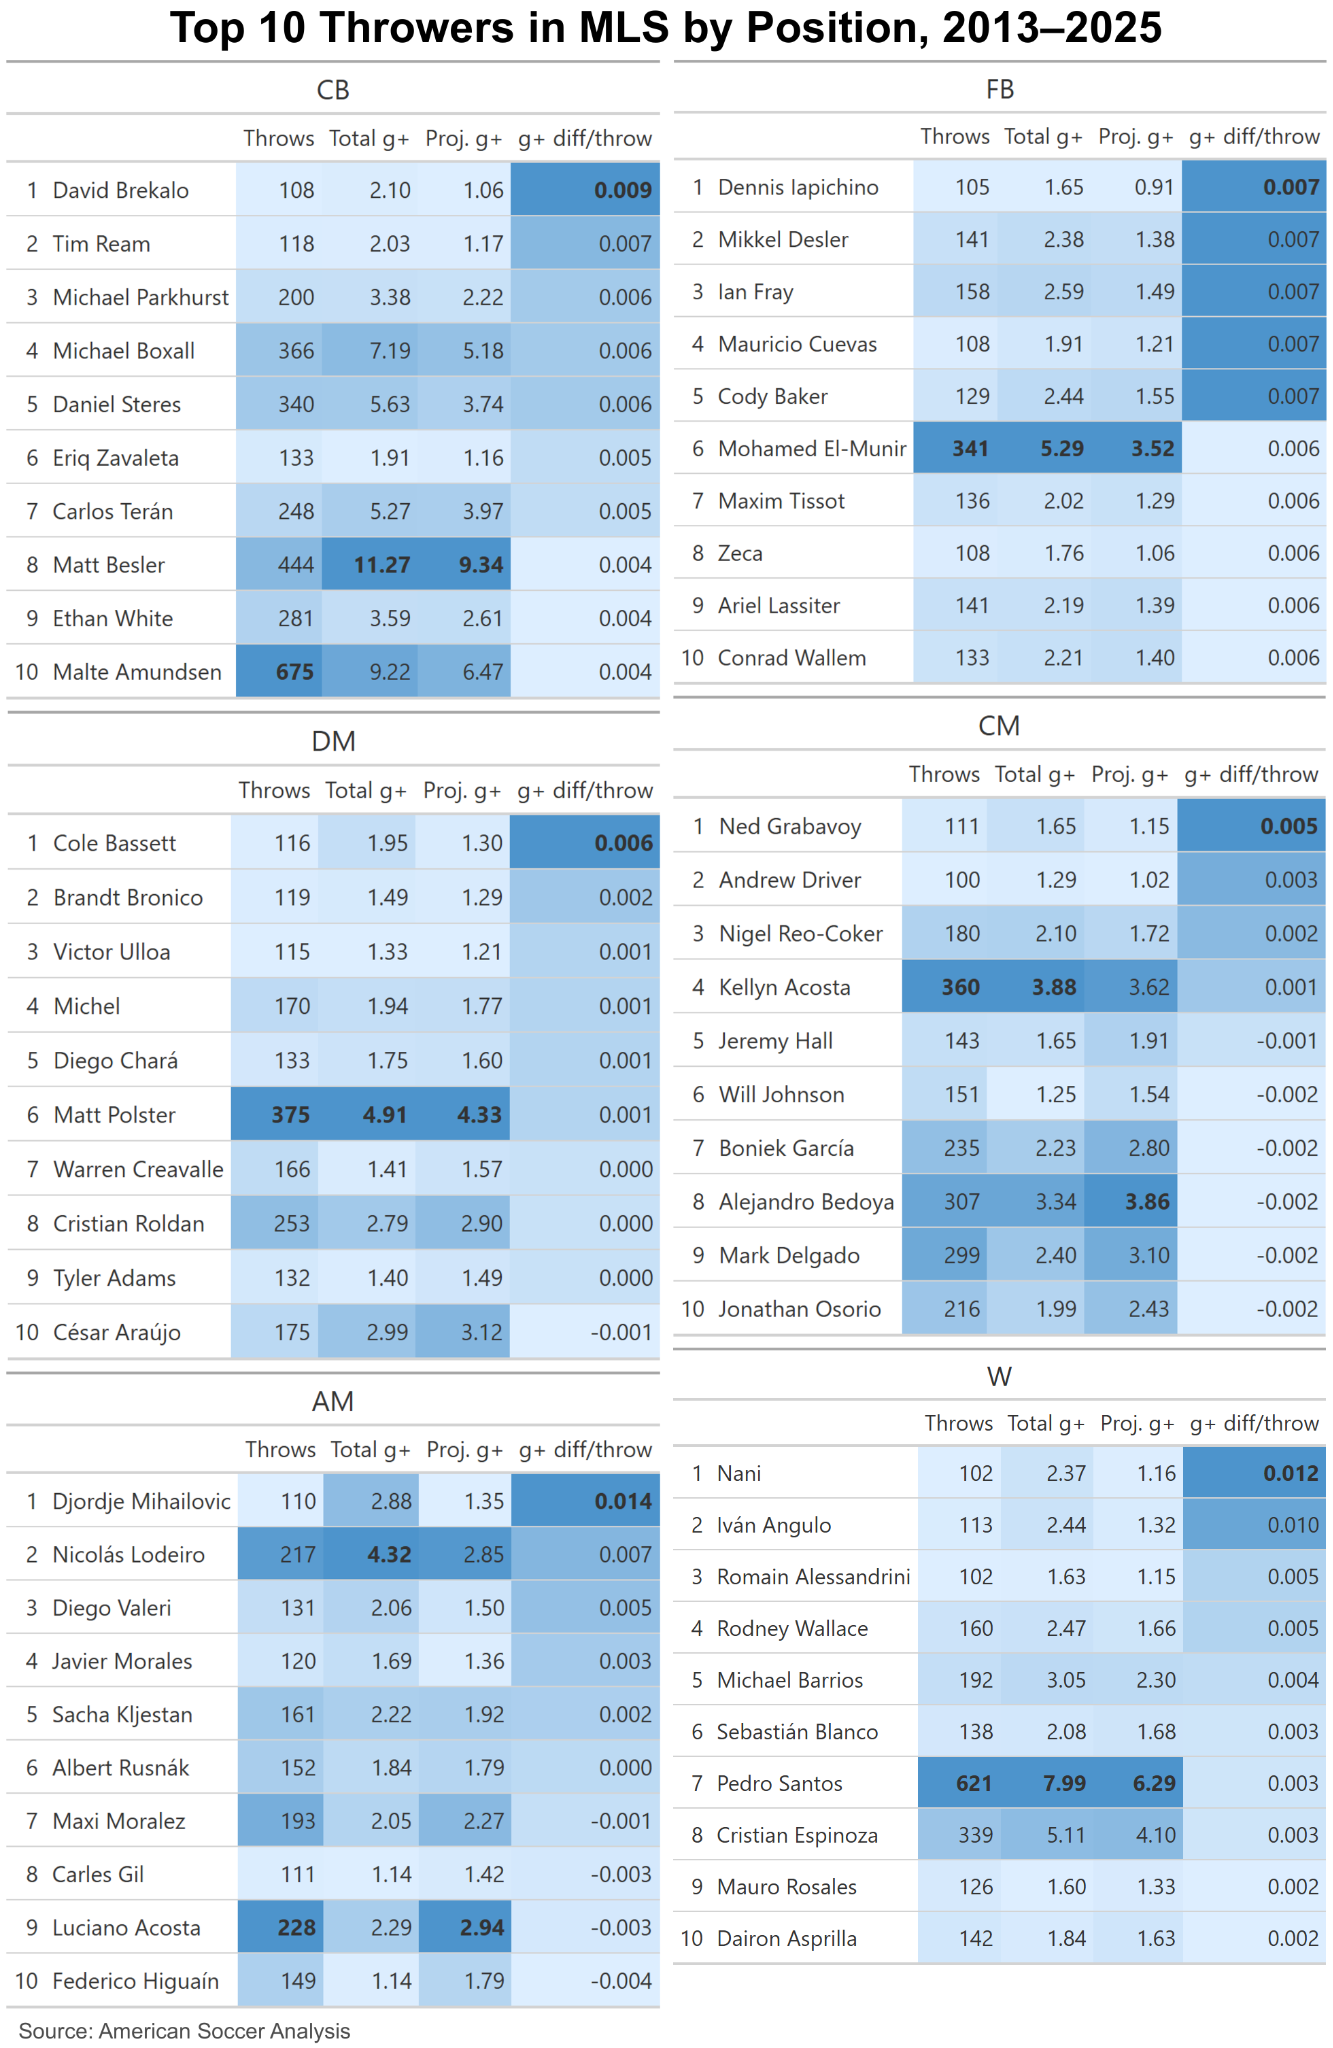
It’s time for the usual disclaimer that these models are blurry pictures of complex dynamics. Event data alone can’t capture the spatial context surrounding where a player chooses to send a throw-in or the resulting outcome, only trace trendlines. Clubs could invest some effort peeling this onion a bit more by developing theories, testing them with film study and scouting, and operationalizing that to new players using tracking data. Finding the right footage to watch might be a challenge, but modeling possession g+ based on some reliable patterns of throw-ins lets us identify players that reliably generate more value than expected. Let’s use 100 career throw-ins between 2013 and 2025 as a way to know any players we find aren’t low sample-size flukes.
First, I excluded strikers from these tables because only one (1) of them has made more than 100 throws since the start of 2013. Perhaps I also should have excluded defensive and center midfielders! I chose to rank these tables by per-throw adjusted model overperformance to find players that can get the most value from each throw, and focus on what they do right. Djordje Mihailovic is the league leader in g+ per throw, while noted hurler Michael Boxall scores somewhat lower. Given the recency of Minnesota’s aerial assault, perhaps if we segmented by more recent times we’d see something.
But this is only one half of the puzzle! Every successful throw-in needs a target, and coaching how teammates should run into space and create opportunities within a few seconds of the ball going out will
be fundamental to maximizing team success with these restarts. Thus it makes sense to also identify which players maximize the value of throws they receive.
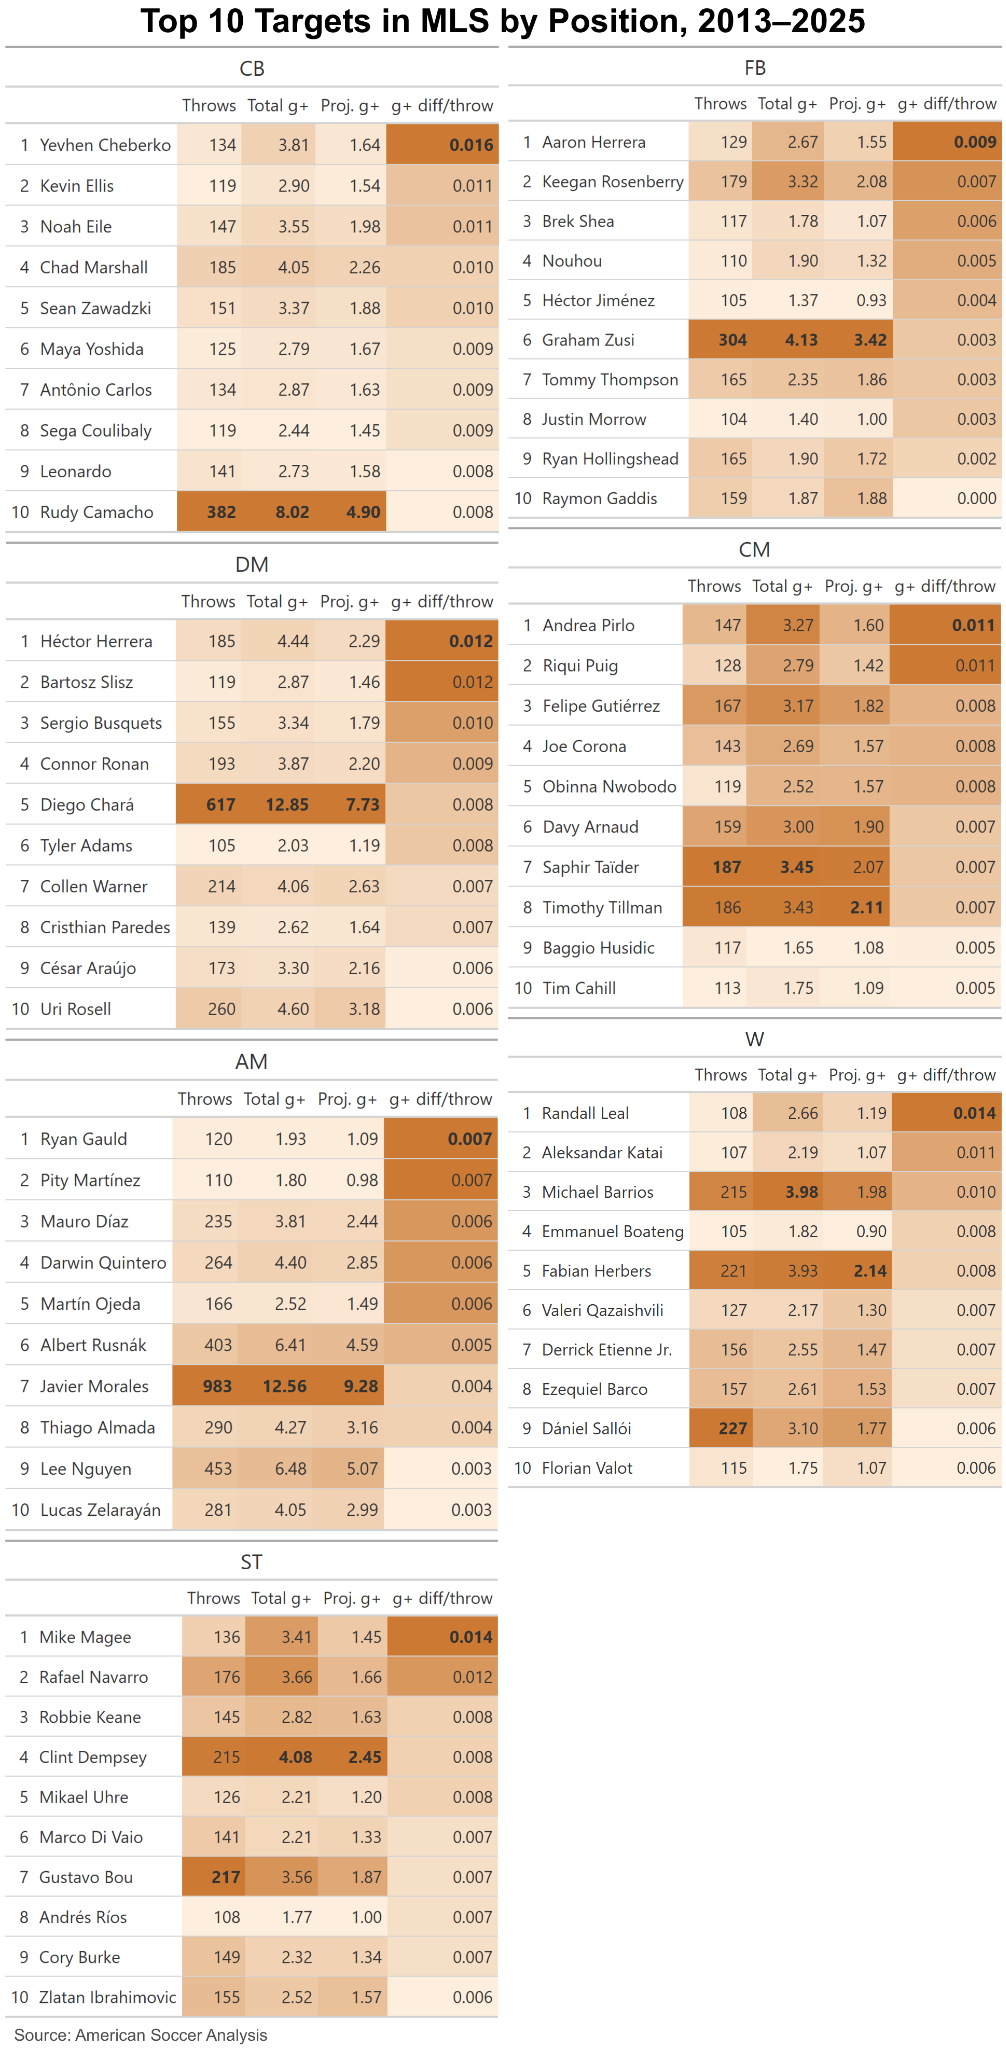
The receiver list is perhaps more satisfying. A bunch of lumps getting their heads, shoulders, knees, and toes on long throws into the box, and Andrea Pirlo elegantly receiving throws inside and retaining possession to spray it about. Perfect.
Da Rules
So let’s wrap this up by returning to some data-driven strategic suggestions for throw-ins. Despite finding these general patterns, it’s important to remember that, just like any shot can go in despite a low xG, or miss despite a high one, any throw-in could eventually result in scoring or conceding. These should be considered general tips for how to get more value from these moments in the long run, not a prescription for every throw-in headache. The first two rules are adapted from Eliot’s original findings that I have replicated here.
Getting open as soon as possible is more important than getting forward, but if you can do both that’s great.
Avoid letting the ball go out in your defensive third, and press when it goes out in your opponent’s defensive third.
Prioritize retaining possession over advancing field position on throws in your half.
Look for open teammates closer to the middle of the pitch, whether you can get it into the penalty area or not.
One final thought. I haven’t done a team or coach level analysis yet, and I’m sure that there are coaches, teams, and players that find success with a “chuck the ball forward” restart mentality. These might be teams that are confident in their ability to win 50-50s and exploit the chaos in dangerous areas that those plays can create.
But I can’t help but notice that these findings seem to encourage a possession-style that uses space to progress rather than brute force, move the chains, field position ball. This is a fairly unique finding for g+, which absolutely loves field position. Seriously, look at the goalkeeper passing g+ rankings. It’s a longest drive competition for goalkicks.
I have to assume that backwards passes have value exactly because teams can keep the ball and recirculate it to other parts of the pitch, and I’m frequently shocked when I watch matches at how compressed players get around the ball when it’s a throw-in against a set defense. I haven’t read ahead or anything, but I’d bet the key lessons to be gleaned from the scouting lists have to do with exploiting space with quick recognition and smart movement by both thrower and target, rather than raw length.