
Where Goals Come From: FIFA Men’s World Cup Edition
/How scoring in the Men's World Cup compares to domestic leagues
By Jamon Moore
During the pandemic, when Carlon Carpenter and I researched the impact of certain types of soccer passes, we were blown away by how important they were to goal scoring. We wrote 10 articles about them throughout 2021, called the “Where Goals Come From” series. Even from those 10 articles, we never imagined the reach they would have in clubs across the world.
Now, we examine the world’s premier competition and compare it to our original and ongoing research on how shots are created and goals are scored in domestic league competitions.
Where Goals Come From Overview
In a nutshell, there were four key concepts in those first 10 Where Goals Come From articles (along with practical team training tips from Carlon). I’ve linked the best article for understanding these and provided a relevant visual. If you have questions, ask me on BlueSky.
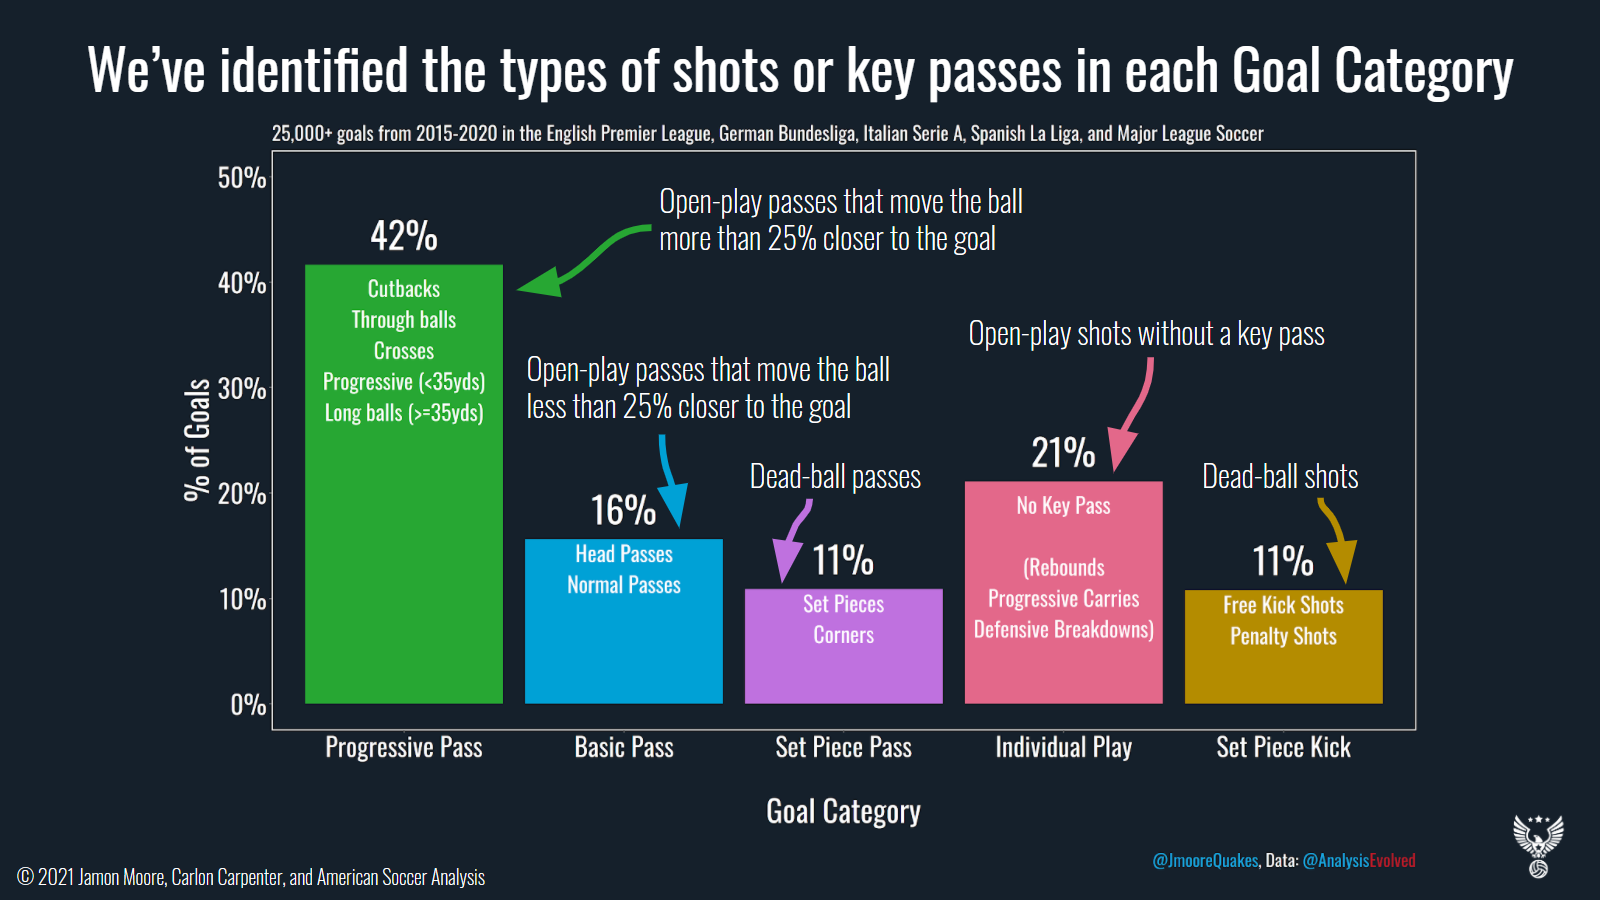
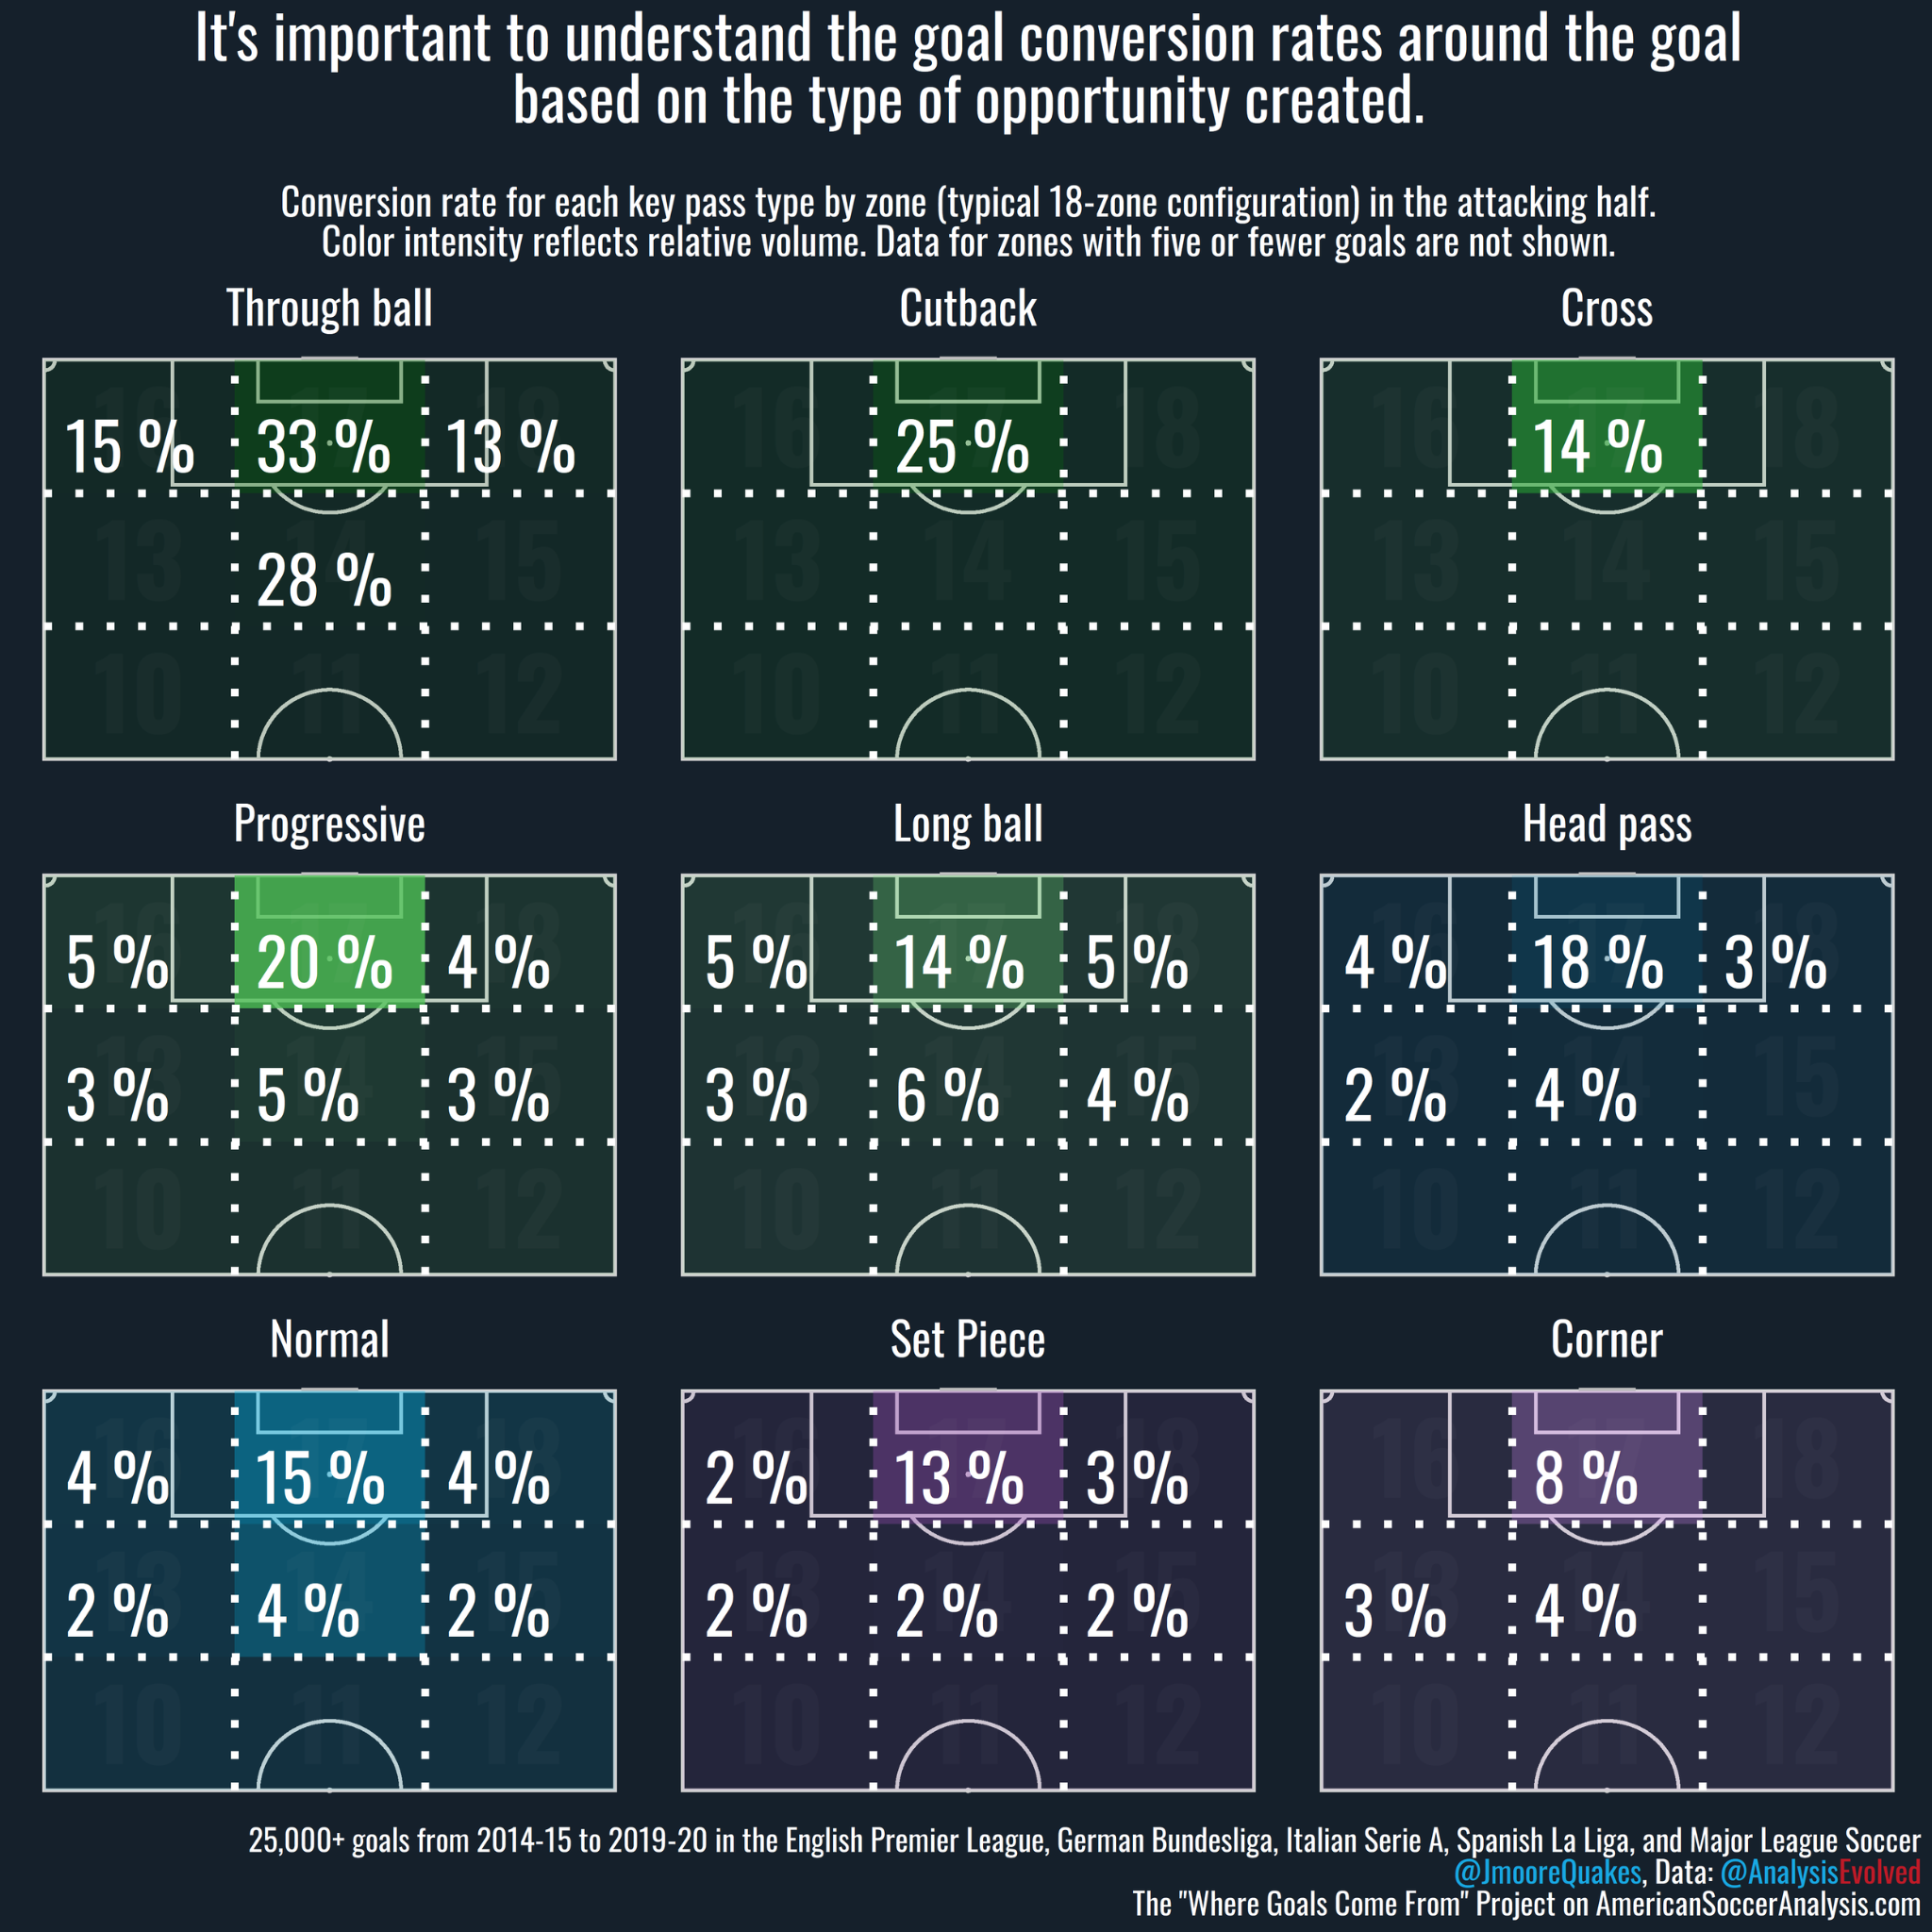
There are five Goal Categories.
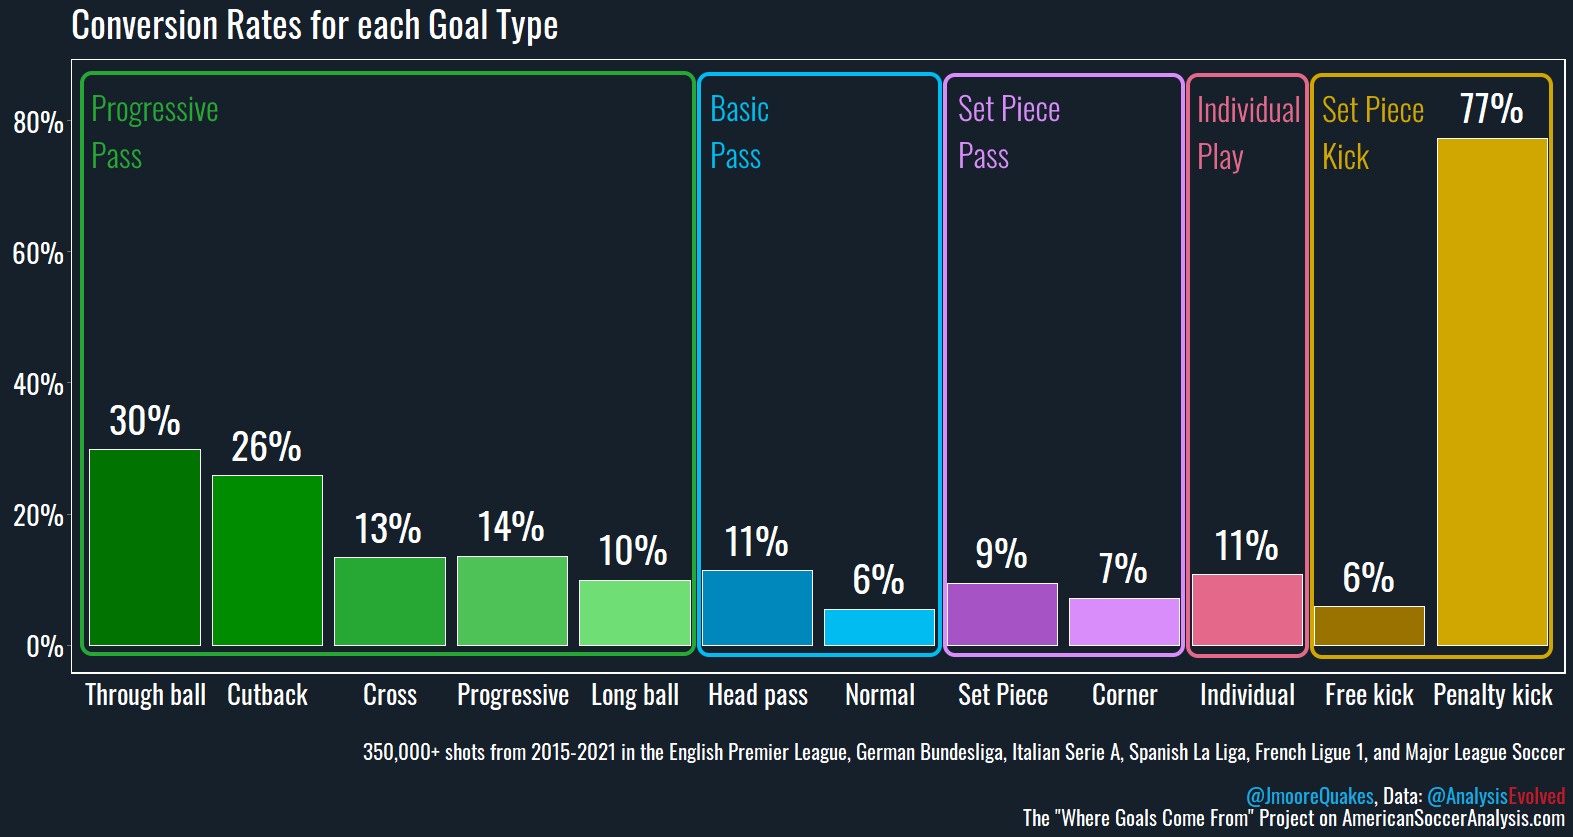
In these five goal categories are 12 goal types.
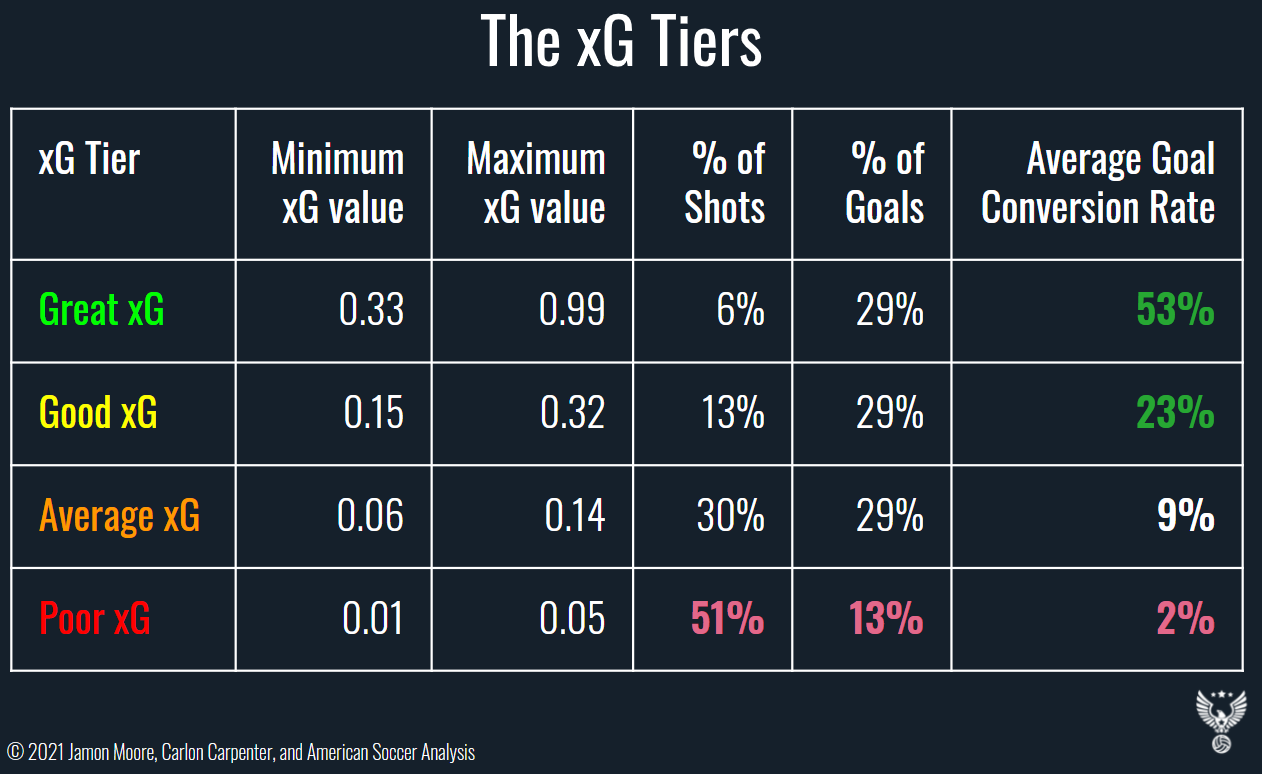
We can use Expected Goals (xG) Tiers to talk generally about shot quality.
Great xG - Improves the average Goal Conversion Rate by 4x or higher
Good xG - Improves the average Goal Conversion Rate by about 2x
Average xG - Provides the average Goal Conversion Rate
Poor xG - Worsens the average Goal Conversion Rate by 2x or more
4. Most good teams consistently generate more shots or produce higher quality shots than their opponents. Elite teams do both and know how to create goals from them.
A note on data
This analysis uses data from more than one provider. Hudl StatsBomb Open Data was used to support analysis for World Cups in 2018 and 2022 and was transformed to the Where Goals Come From data structures. The goal category distributions and key pass type patterns were materially consistent across sources for the same tournament, giving us confidence in the cross-tournament comparisons. However, evolution every four years from data providers and changes in how events are classified make ongoing cross-tournament comparisons inherently challenging, and those challenges are only likely to grow as the industry rapidly evolves from here.
The charts selected here for the FIFA Men’s World Cup 2026 are pre-final weekend. All World Cup analysis is restricted to regular time — penalty shootouts are excluded. Performance tiers are calculated by ranking teams within each tournament by round eliminated and total points earned within that, with goal differential as a tiebreaker. Then teams are divided into four equal groups: Top 25%, Upper Mid, Lower Mid, and Bottom 25%.
With the 2026 WC expanding from 32 to 48 teams, the quadrant boundaries shift — the 2026 WC Lower Mid and Bottom 25% combined represents the equivalent of prior tournaments' Bottom 25% in global quality terms, and cross-tournament comparisons account for this where relevant. Given the relatively small number of goals in any single World Cup tournament, shot quality expressed as expected goals per shot should be emphasized over conversion rates, which are too noisy at these sample sizes to be reliable on their own.
Time for the analyses…
Goals are up, up, up!
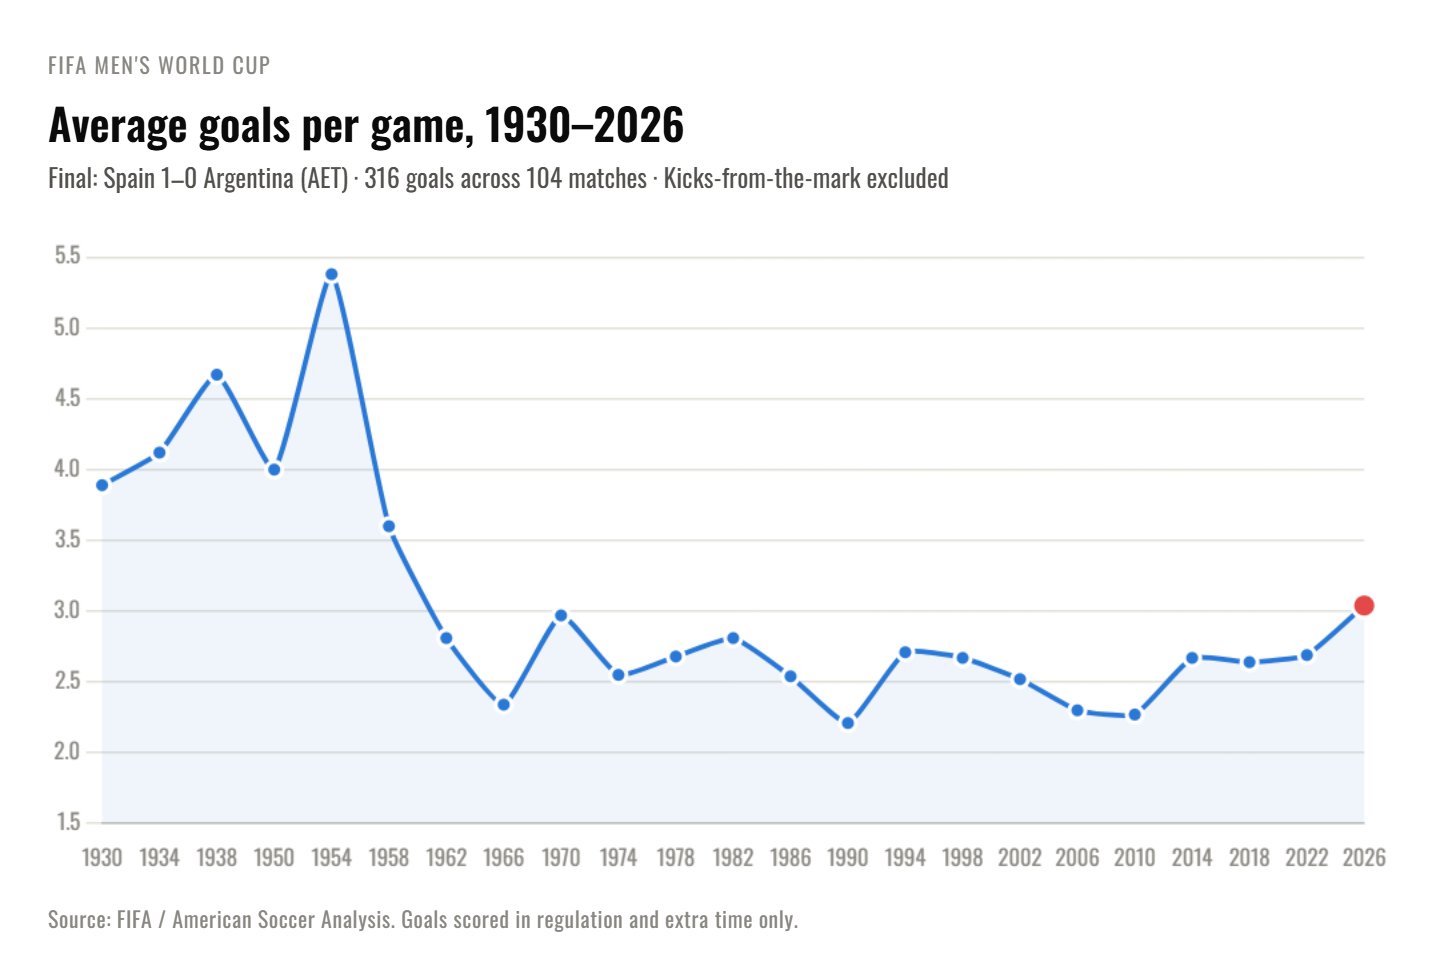
Before diving into how goals are scored at the World Cup, it's worth noting that more goals are being scored in general. The chart above shows average goals per game at every World Cup since 1930. After peaking in the 1950s — an era of minimal tactical organization and wide-open attacking soccer — scoring rates fell steadily through the 1960s and hit a historic low in 1990 at 2.21 goals per game, the nadir of the bunker era. FIFA responded with rule changes designed to encourage attacking play: three points for a win (1994), the back-pass rule, and crackdowns on defensive fouling.
Those changes pushed scoring back up through the 1990s and into the 2000s, but a second trough emerged between 2006 and 2010, when tournament soccer became tactically sophisticated enough that defensive organization consistently outpaced attacking creativity.
The pre-finals weekend 2026 World Cup was on pace for approximately 2.96 goals per game, and a meaningful jump above the 2.64-2.69 range that defined 2018 and 2022. The 10-goal third-place game made that jump to 3.04, the highest since 1958. The 2026 tournament broke the all-time record for total goals scored in a single World Cup, surpassing the previous record of 172 goals set at Qatar 2022.
Part of the explanation is structural: 104 matches instead of 64 means more games between unevenly matched opponents, and the lopsided group stage results that come with a 48-team field inflate the total. But goals per game controls for that, and it's still up meaningfully.
The more interesting explanation is tactical. The data in this article suggests weaker teams are no longer purely defensive. They're building attacks, generating open play shots, and creating individual scoring situations at rates that simply didn't exist in 2018. When teams that used to park the bus start shooting more, goals go up — even if the individual quality of those shots is lower.
A spectrum of parity
Our previously researched domestic league baselines aren't just context for our World Cup analysis — they're the lens that makes those findings useful.
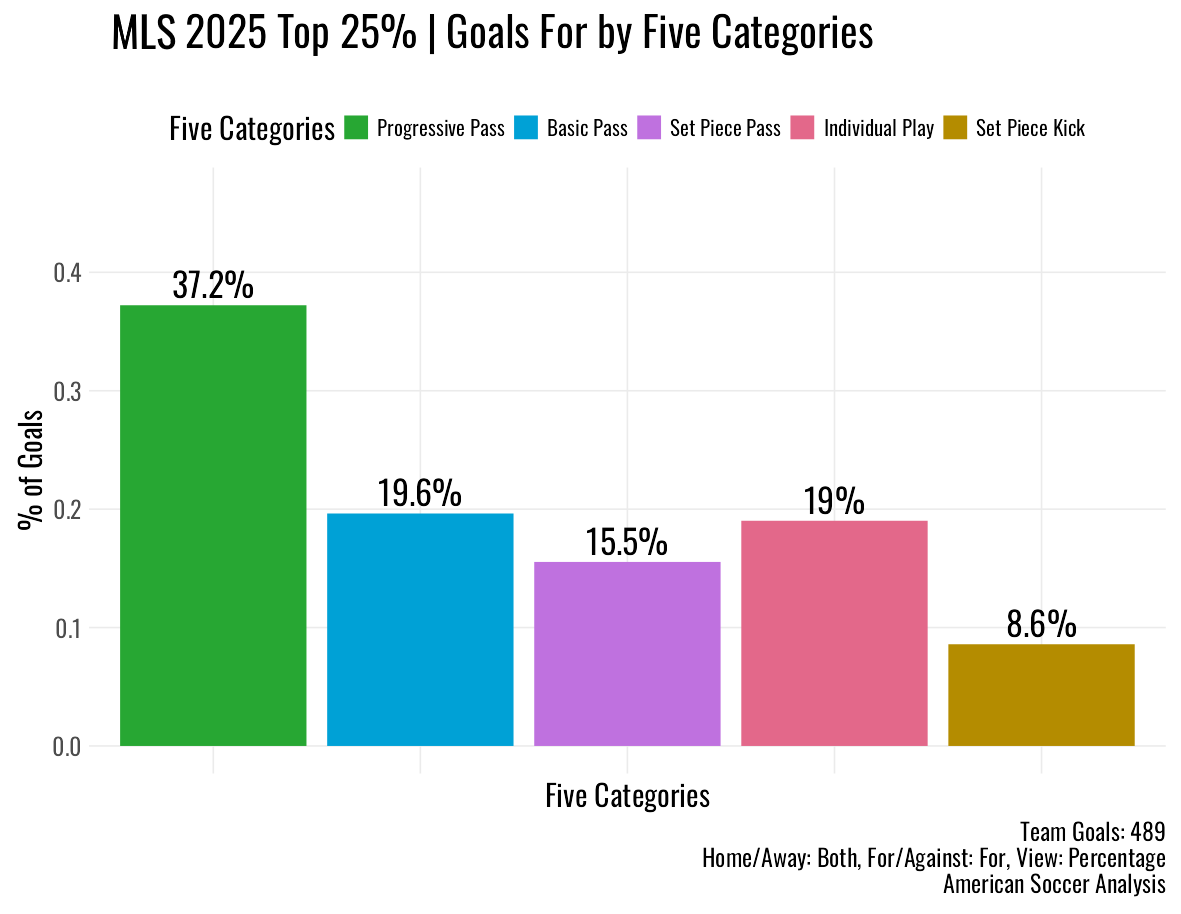
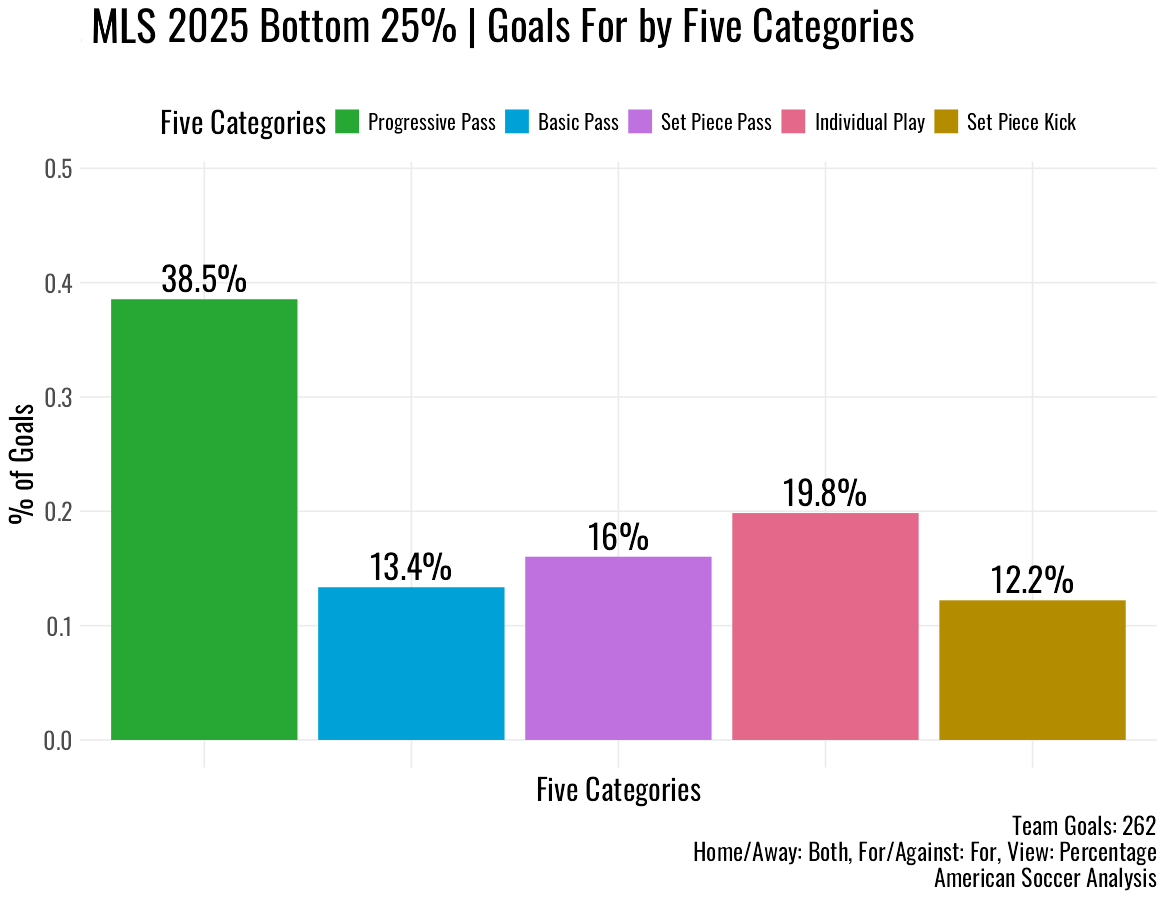
Major League Soccer is the starting point because it represents engineered parity. The salary cap, allocation mechanisms, and draft structure are explicitly designed to limit the quality gap between clubs. The result shows up clearly in the WGCF data. Top 25% MLS teams score nearly 40% of their goals via Progressive Pass season-over-season, but so do Bottom quartile MLS teams. Individual Play sits at about 19% for every tier. Set Piece Pass at 20% across the board, same as our original research. In MLS, how you score goals has almost nothing to do with where you finish in the table.
The English Premier League tells a different story. Top teams score 41% of their goals from Progressive Passes — nearly identical to MLS top teams. But bottom EPL teams are only at 34%, meaningfully lower, with more reliance on Set Piece Pass at 22%. And so, a gradient has emerged. The quality gap between a title contender and a relegation battler in the EPL is large enough that it starts to show up in how goals are scored. This is true in other disparate leagues as well. Individual Play goals, however, remain flat at about 18-20% across all four EPL tiers, telling us the chaos of the sport distributes itself fairly evenly regardless of quality in domestic league play.
The key phrase is domestic league play. In a league format, every team plays every other team home and away across a full season. Quality advantages get expressed through points accumulated over time. The structure of the league smooths out the extremes. There are enough games to give us confidence that the outcomes at least broadly represent the top and bottom teams, which is particularly important when Continental Competition qualification, promotion, and relegation are on the line.
The World Cup doesn't work like that. In this tournament, the best countries in the world play each other and other less-than-the-best countries in high-stakes conditions, with limited preparation time, in new environments, against opponents they've rarely if ever faced. The quality gap that league formats distribute across an entire 34 or 38 game season gets compressed into seven (now eight) 90 minute chunks across roughly a month. And that compression reveals something that league play obscures: the degree of tier stratification in how goals are scored tracks the degree of quality disparity between the teams competing.
Most of the world's best players come from the same non-cost controlled leagues where we already see meaningful tier stratification. At the World Cup, those players represent nations against opponents drawn from leagues with far less depth. The WGCF framework, applied consistently across all three contexts, shows us how that quality gap expresses itself on the scoreboard.
The spectrum in action
The clearest single illustration is the Progressive Pass goal category % by quality tier across all three contexts: parity league, dynasty league, and international tournament.
In MLS, the four numbers are essentially the same. In the EPL, a top-to-bottom gradient of about seven percentage points has opened up. At the 2026 WC, the gradient between top and bottom is 16 percentage points — and it has more than quadrupled since the 2018 WC when it was only three percentage points.
Top World Cup teams have dramatically increased their reliance on Progressive Pass goals over eight years, from 33% to 45%. The “Bottom 25%” World Cup teams haven't moved. The gap between them — which barely existed in 2018 and barely exists in any domestic league — has become one of the defining characteristics of international tournament soccer.
2026 World Cup Team Tiers
As mentioned earlier, for this analysis, the tiers are determined first by elimination round, then total points, then goal differential. Teams are shown alphabetically.
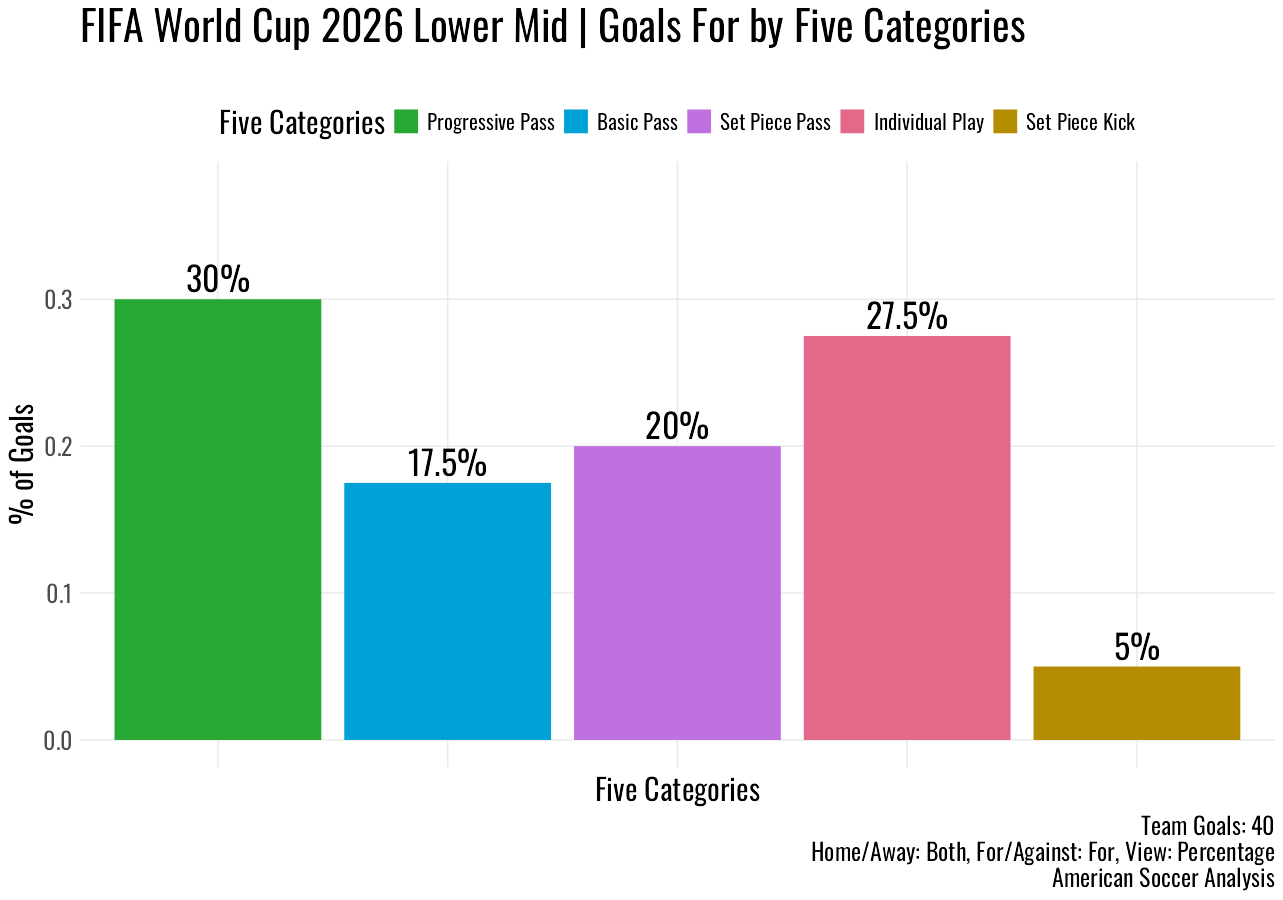
There is a field expansion caveat worth noting. With 48 teams in 2026 instead of 32, the 2026 WC “Lower Mid” quadrant represents teams that in prior tournaments would have been in the Bottom 25% in 2018 and 2022. Tracking that equivalent tier across all three tournaments, Progressive Pass share moves from 29% to 29% to 31% — essentially flat. The teams comparable to the weakest prior World Cup participants haven't changed how they score goals in terms of category. What's changed is everything about how that category gets created, and what replaced the dead ball dependency that used to prop up their goal totals.
The bunker era is over
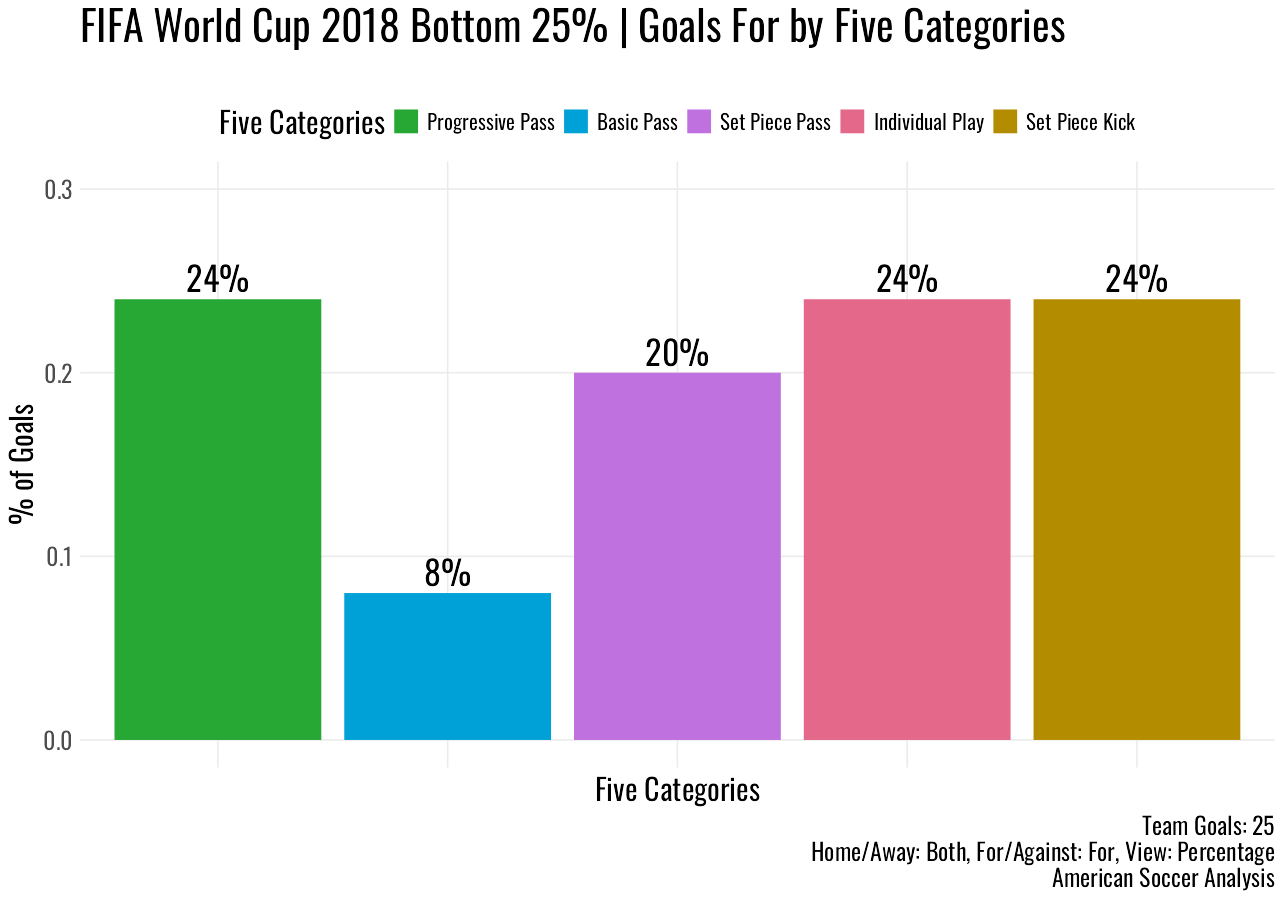
In 2018, the bottom quarter of World Cup teams scored 35% of their goals from Set Piece Kicks — almost entirely penalties. This was the survival strategy in its purest form: defend deep, counter fast, get fouled in the box when needed, and convert. Six of seventeen goals from bottom-tier countries in 2018 came from the penalty spot. Direct free kick goals contributed essentially nothing — a pattern that holds across all three tournaments and all tiers. Free kick goals are one of the noisiest goal types even for the top tier countries and club teams.
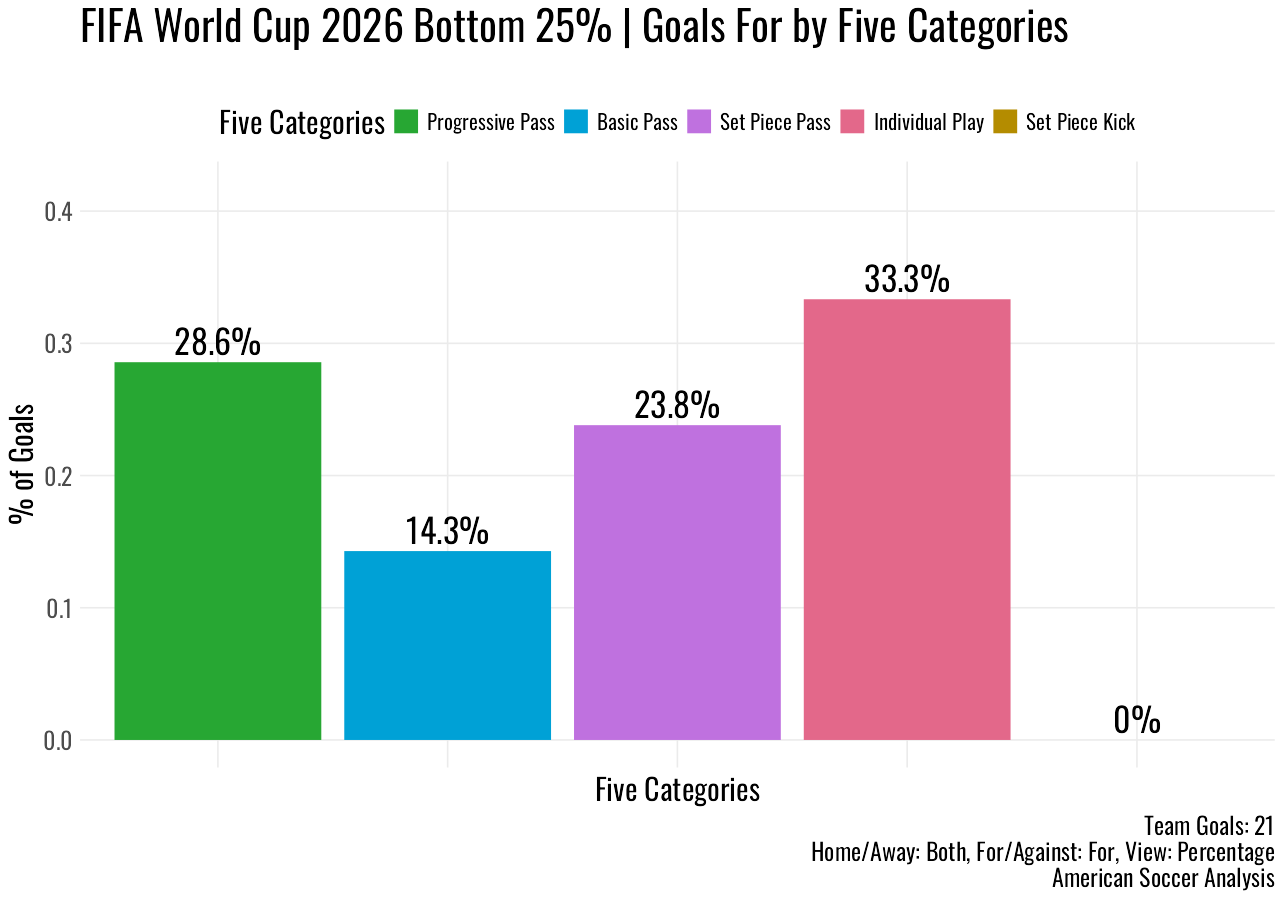
By 2022, the penalty dependency had collapsed to 10% for Bottom 25% teams. In 2026 group play, bottom-tier teams scored zero penalty goals, likely due to increased scrutiny of penalties they would have previously been awarded before VAR or with the early VAR implementations. The strategy is gone. Similarly, we thought this World Cup would be the World Cup of the “Meat Wall” (h/t to Michael Caley), and it hasn’t been at all (mostly due to referees calling obvious fouls when teams block the goalkeeper).
This is genuine tactical evolution. But what replaced the penalty dependency reveals exactly where the quality gap now lives, and it isn't what you'd hope for if you were a coach trying to close the gap on the world's best.
Individual Play: what the chaos actually looks like
Individual Play goals are not necessarily moments of individual brilliance. They are goals that happen without a key pass: no assist or deliberate final combination. Rebounds off the goalkeeper, deflections falling to a forward, loose balls in dangerous areas, a player winning possession and shooting before anyone can get organized. They are what an opposing coach will sometimes call “garbage goals” when scored upon, while the coach of the scoring team will call it “opportunistic.” Regardless, that’s not the way scoring methods are drawn up on the training ground, but it is the chaotic-but-beneficial outcome most teams hope their pressing schemes will create. Long live WPITOOTBGW!
In domestic leagues, typically 18-20% of goals across every tier come from Individual Play. The chaos distributes itself fairly evenly regardless of quality. At the World Cup, the Individual Play share tells you a great deal about which teams are controlling situations and which are waiting for something to happen.
Bottom quartile Individual Play goals in 2018: 12%. By 2022: 33%. 2026 was also 33%. As penalty dependency collapsed, Individual Play more than doubled for the weakest World Cup teams and has stayed there. Meanwhile top teams have consolidated around Progressive Pass, rising from 33% to 45% of goals. The gap in how goals are scored has widened, and the nature of that gap has changed completely. There has been a lot of discussion about the increase in “top” head coaches in the international game (Ancelotti, Tuchel, Pochettino etc.), given the relationship between things like WGCF and coaching, this seems to be bearing fruit more broadly.
The sub-types within Individual Play tell a more specific story. The most common way to score an Individual Play goal in domestic leagues is from an incomplete pass: a deflected pass off a foot, an interception falling perfectly, a failed clearance landing at a forward's feet. Think less Messi dribbles 10 players and more Wondo crashes home a miffed clearing header from a cross. In MLS and the English Premier League this accounts for roughly half of all Individual Play situations across every tier, and the tier gap in how often these occur is small. Defensive mistakes happen to everyone.
At the 2026 World Cup, bottom tier teams rely on these incomplete pass / loose ball situations (often caused by sloppy play by either team) at higher rates than any other tier or competition. They're not pouncing on rebounds. They're not driving at defenders and creating space. They're waiting for something to go wrong for the defense.
Carry and dribble situations (where a player receives the ball and drives at defenders to create a shot) are the most skill-dependent Individual Play sub-type. In MLS the quality of shots created this way is nearly identical across all four tiers. At the 2026 World Cup, top teams generated these situations more frequently and with a higher resultant shot quality than bottom teams. Bottom teams aren't creating them as often, and, when they do, the shots are coming from worse positions.
The picture is consistent: weaker World Cup teams are relying on the most passive form of Individual Play — the mistake that lands at their feet — rather than the more active forms. They've gotten better at being in the right place when something goes wrong. They haven't yet gotten better at making something go right.
How the best teams are pulling away
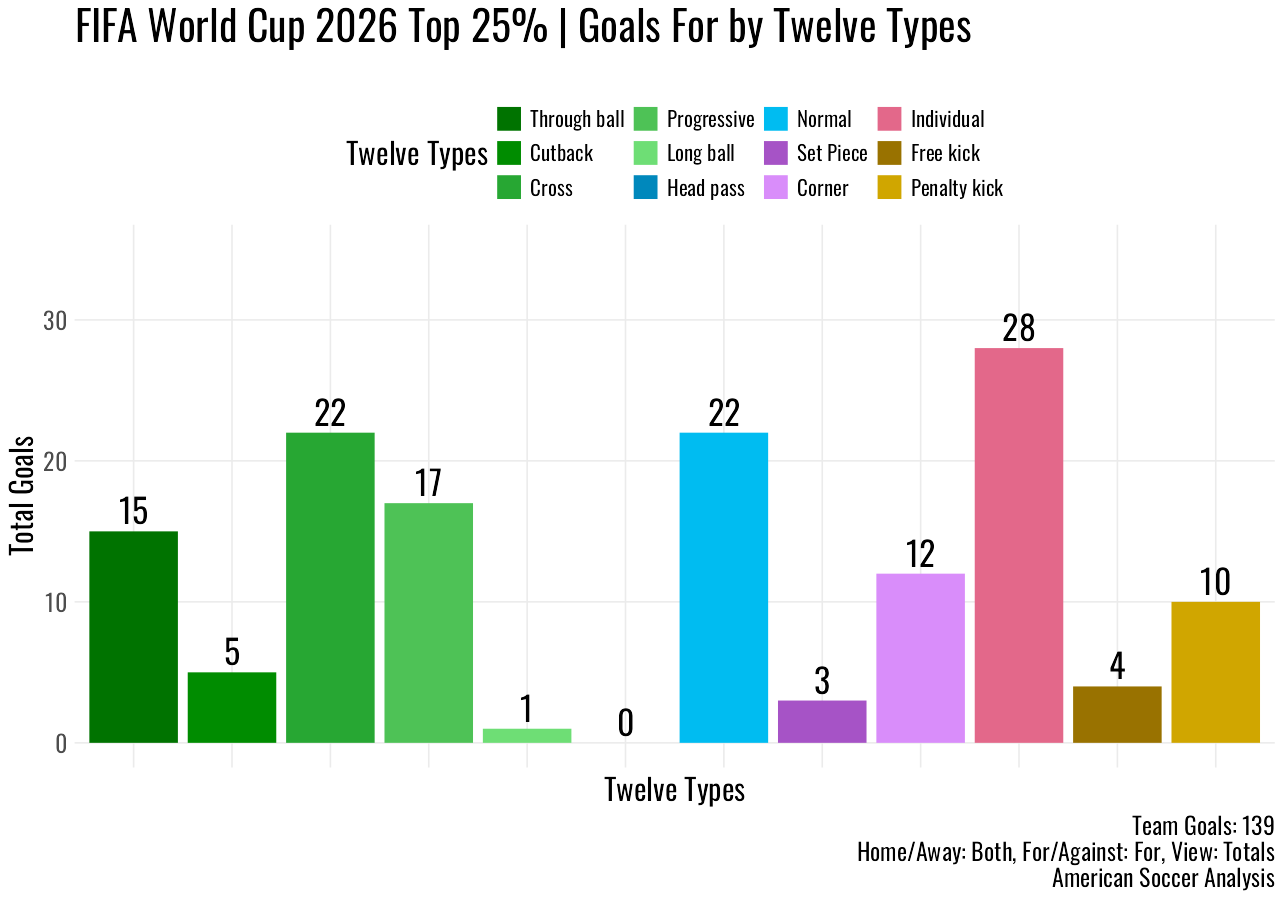
Going deeper into the specific pass types that create goals explains the widening gap more precisely.
The narrative that club soccer tactics and styles can’t work on the international stage, and it’s only about “defense and set pieces” instead, has been demolished. At the top level, international soccer, in these short bursts at least, now often exceeds the quality of the finely-tuned club game.
Through balls are the clearest illustration. When a team plays a through ball that leads to a shot, the shot quality is nearly identical across all performance tiers at the 2026 World Cup, and matches what you'd see in any domestic league’s data. When a through ball connects, it creates a high quality chance regardless of which team plays it.
But in the World Cup, Top teams in 2026 generated through ball shot opportunities at more than 26 times the rate of bottom teams — and at more than double the rate of top MLS or Premier League teams. Bottom World Cup teams went the entire group stage generating barely one through ball shot opportunity. It's not that they can't finish them. They're not getting into positions to attempt them in the first place. In MLS, by contrast, there's almost no difference across tiers in how frequently or how dangerously teams get into through ball situations.
Cutbacks tell a similar story about volume without the same quality gap. A cutback generates a high quality chance regardless of who plays it and provides consistent shot quality across every tier and competition. But top World Cup teams create roughly twice as many cutback situations per game as bottom teams. In domestic leagues, that ratio is much closer to even.
Crosses are the one key pass type where not just volume but also shot quality diverges significantly by tier at the World Cup, and also where the domestic baseline shows essentially no gap. In MLS, the expected goals value of the average cross shot is nearly identical for top and bottom teams. At the 2026 WC, top teams generated cross shots that are meaningfully more dangerous than those generated by bottom teams. They're not just crossing more — they're crossing from better positions into more disrupted defensive situations, creating higher quality opportunities. Combined with the volume advantage, various types of crosses represent the single largest total expected goals gap between top and bottom World Cup teams in 2026. In general, better teams are crossing closer to goal and in early opportunities that keep defenders guessing.
Progressive pass shots from diagonal balls, vertical passes through the lines, and horizontal passes into the box, show the most striking quality gap of all. In MLS, the expected goals value on these shots is nearly identical across all four tiers. At the 2026 World Cup, top teams' general progressive key pass shots are worth roughly twice as much per chance as bottom teams'. When weaker teams do work the ball into dangerous areas through organized possession, they're arriving in lower quality positions. The shots they generate reflect that: opportunistic rather than designed, and lower quality as a result.
This connects directly to the sequence type findings. When we look at what happens in “Progressed Play” situations — organized possession sequences that work into dangerous areas — top World Cup teams resolve those situations via a deliberate progressive pass final combination about 55-67% of the time. Bottom World Cup teams resolve them via Individual Play about 38-50% of the time. In MLS, this split is essentially identical across all four tiers: about 50% Progressive Pass, about 20% Individual Play, regardless of where you finish.
The finding is clear. Weaker World Cup teams have learned to build attacks into dangerous areas at improving rates. But once they're there, they still lack the quality to execute the final combination, relying on something going wrong for the defense — a loose ball, a scramble, a mistake. They arrived as a team, but they're finishing alone.
Set pieces: the equalizer that isn't equalizing anymore
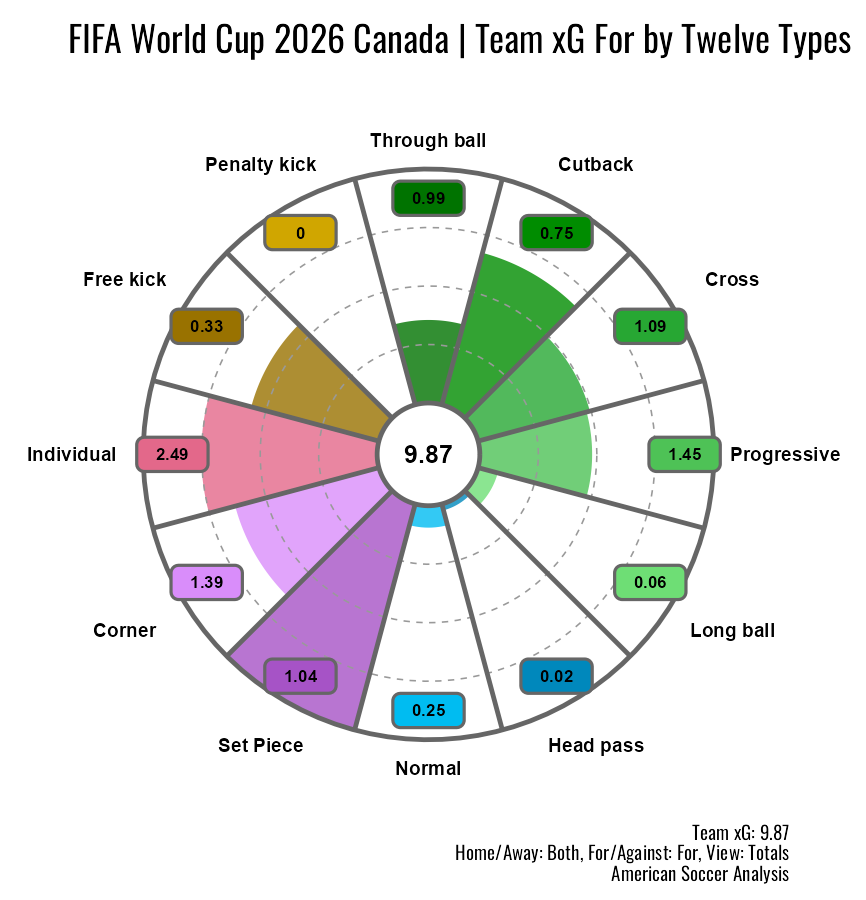
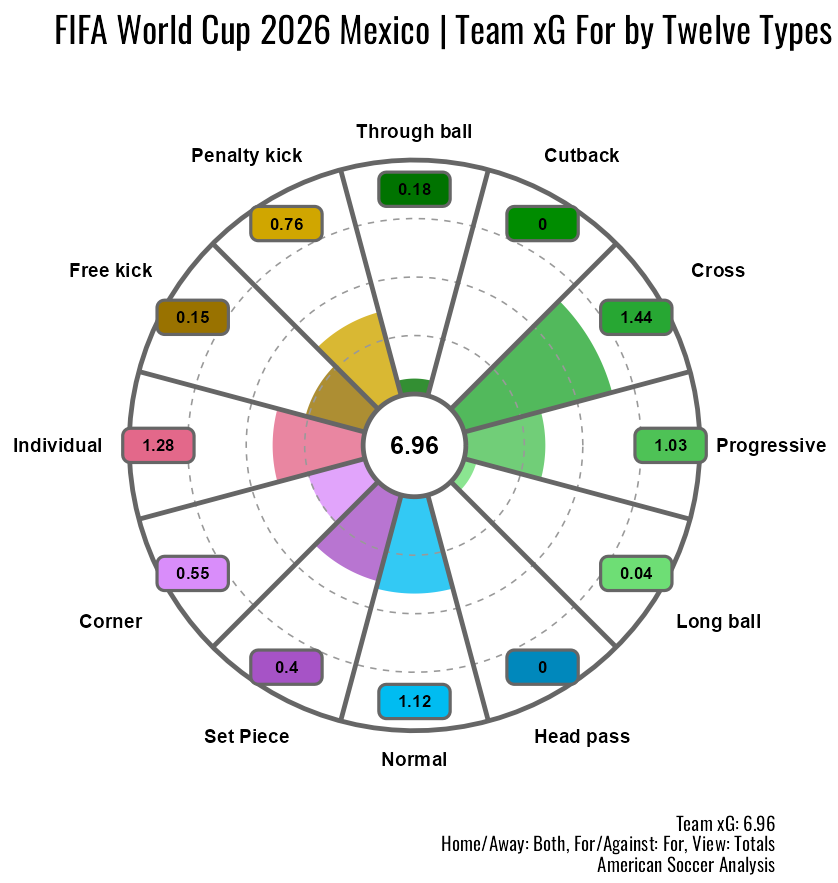
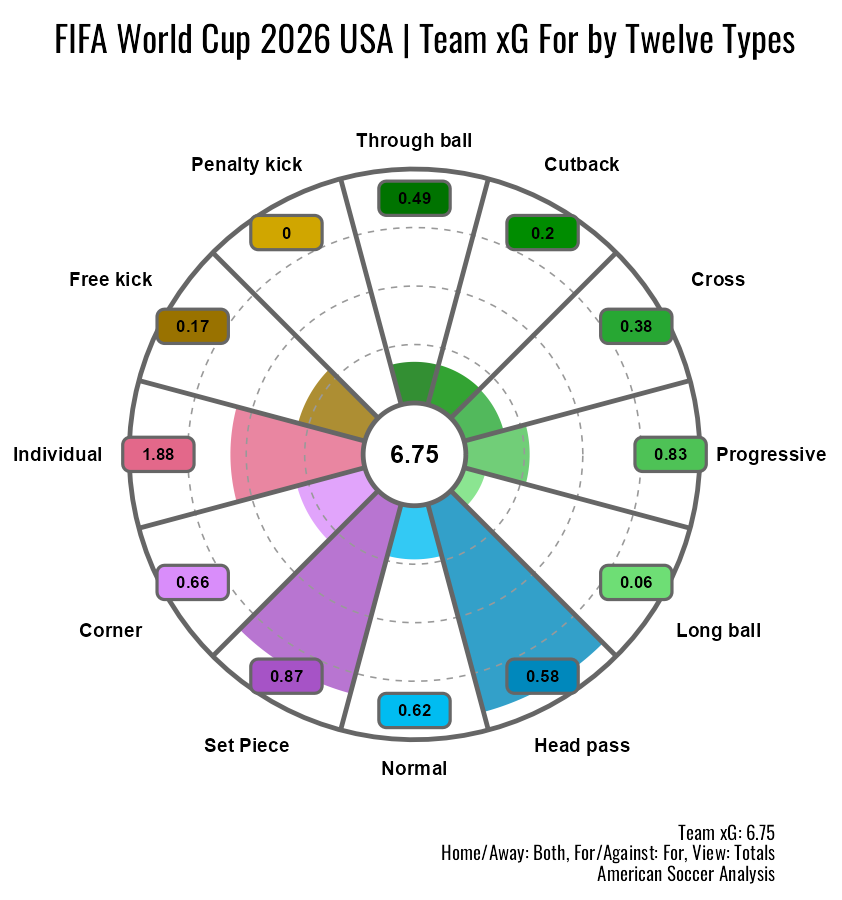
Set pieces are where the findings are most surprising. In domestic leagues, set piece shot quality is almost entirely divorced from league place. It is entirely it’s own game within the game.
At the World Cup that equalizing effect has diminished. Top teams have generated more corner shots per game, better quality set piece deliveries, and they're winning second balls at comparable rates. The one area where weaker World Cup teams still hold their own is second phase situations: when the initial delivery is cleared, they're getting into dangerous positions from the loose ball. But across the broader set piece picture, the gap that used to define the World Cup version of the sport has largely closed in the wrong direction for weaker teams.
This is consistent with the broader narrative. What replaced penalty dependency and set piece reliance isn't a better open play game. It's the Individual Play shots from defensive errors and opportunistic situations. The tactical evolution is real. Weaker teams are no longer purely reactive: they try to compete on an equal footing thanks to commoditized pressing schemes. But it hasn't yet produced a reliable mechanism for creating good chances with any consistency.
Where the gap now lives
Three things separate top and bottom World Cup teams in 2026, each distinct.
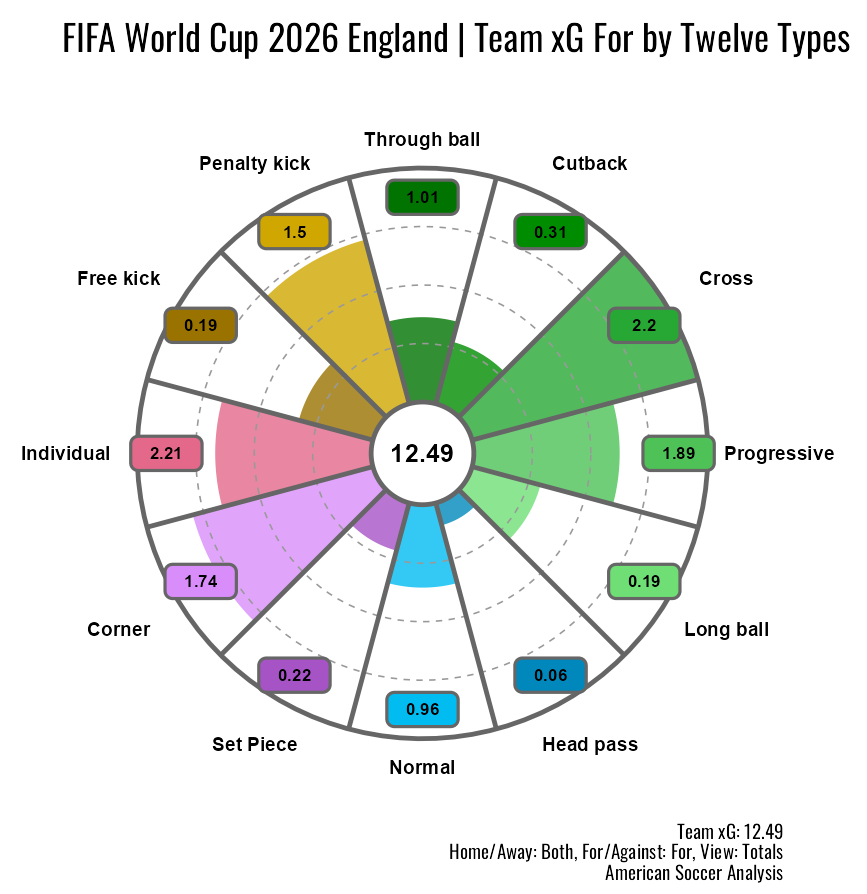
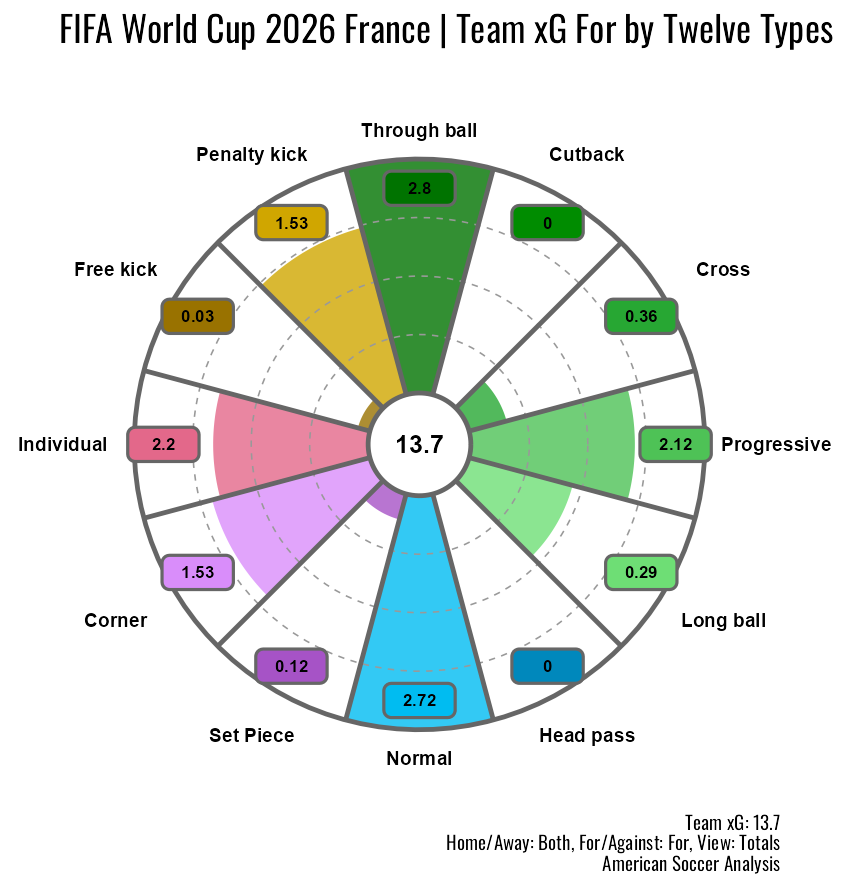
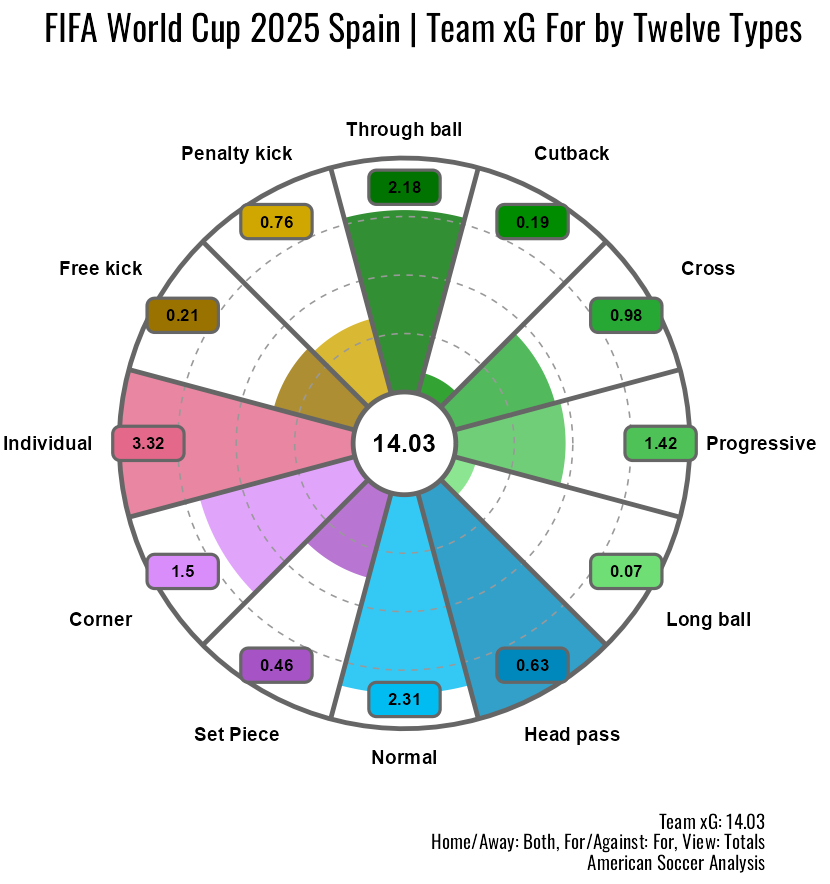
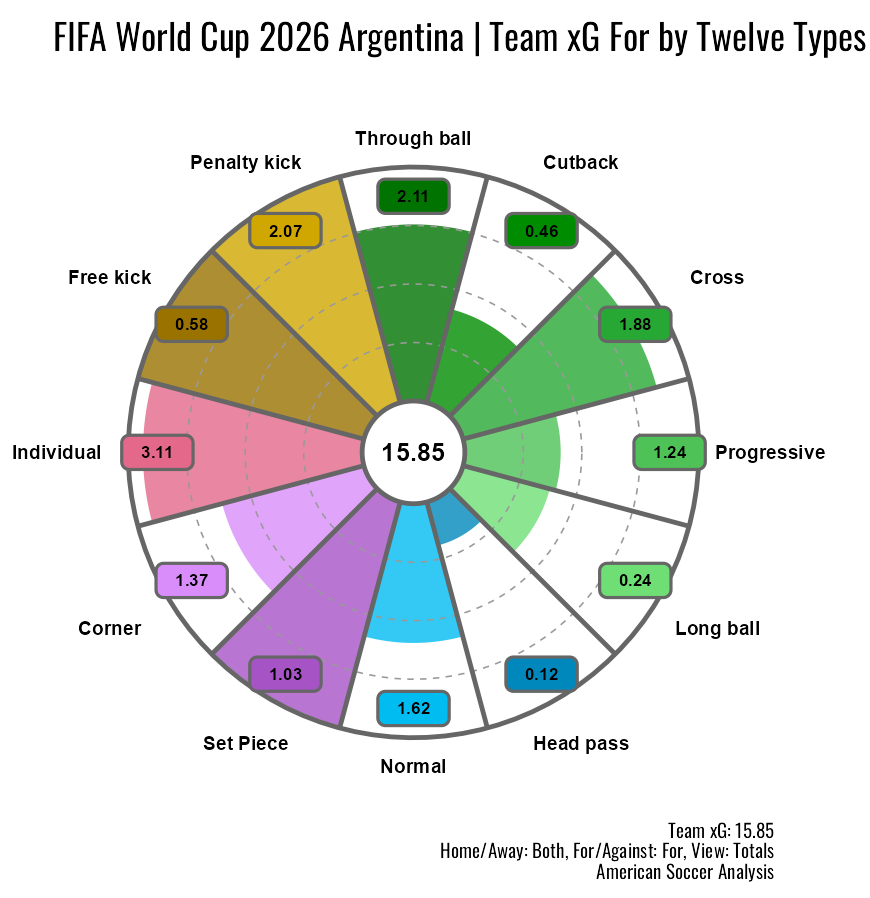
First, volume. Top teams get into dangerous attacking positions far more often per game: through ball opportunities, cutback situations, and high quality cross attempts at rates that dwarf both bottom World Cup teams and domestic league equivalents. This gap barely exists in MLS.
Second, resolution. When weaker teams do build into dangerous areas through organized possession, they resolve those situations through Individual Play (read: relying chaos) rather than through deliberate progressive passing combinations. Top teams execute the final combination.
Third, shot quality within pass types. For crosses and progressive passes in particular, the shots that weaker World Cup teams generate from the same situations are worth less in expected goals terms than the shots top teams generate. Even when weaker teams get into similar areas on the pitch, the quality of what they produce from those areas is lower.
Each of these is a distinct and trainable problem. Getting into dangerous areas more consistently — step one in building sustainable attacking success — is where the most measurable progress has happened across three World Cups. Steps two and three remain largely unsolved for most of the field.
The coaching question
Our domestic league data establishes something important: in MLS, how a team resolves attacking sequences has nothing to do with their performance tier. Top and bottom MLS teams resolve organized possession situations via Progressive Pass at the same rate. Both generate through balls and cutbacks at similar frequencies. The quality of their set piece situations is comparable.
This means none of what we're seeing at the World Cup is inevitable. Weaker teams execute combination play just fine over a full domestic season. Something about the tournament context, such as elimination stakes, limited preparation time, and defensive organization they don't face week to week, forces them into opportunistic solutions when they get into dangerous areas internationally.
Each of these is a distinct and trainable problem. Getting into dangerous areas more consistently — step one in building sustainable attacking success — is where the most measurable progress has happened across three World Cups. Steps two and three remain largely unsolved for most of the field.
We haven’t even touched in this article on what this means for the defensive side of the ball. You’ll find below the pre-finals weekend WGCF Five Categories goal differential “pizza” visualizations for the Bottom 25% and Top 25% from the 2026 World Cup. The implications are enormous for 2030 and the international competitions before then as all team quadrants continue to improve their attacking play through more frequent confederation tournaments.
Closing Thoughts
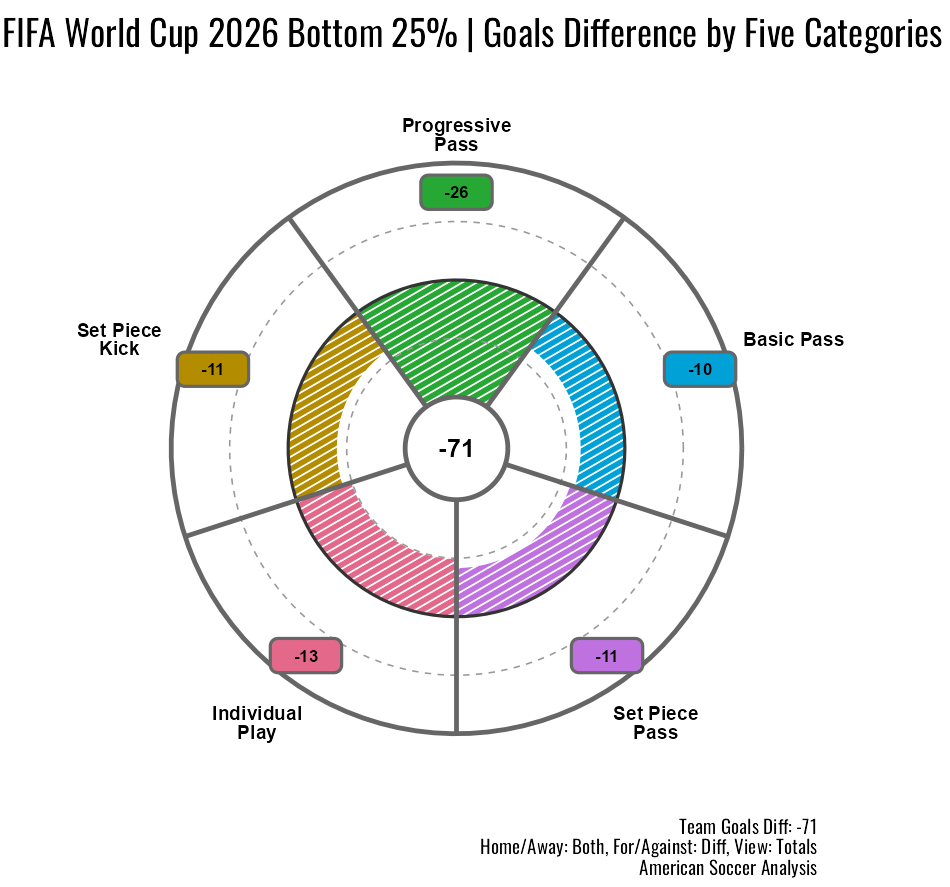
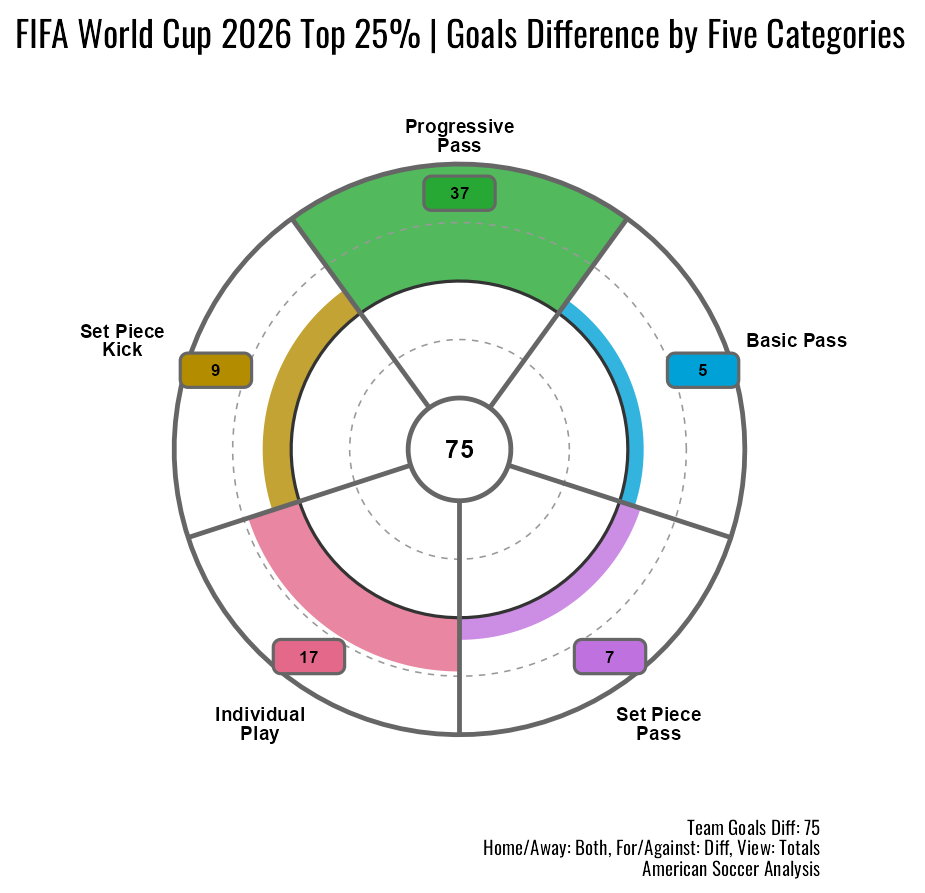
The evolution we're documenting is real. Weaker World Cup teams have demonstrably shed the pure survival strategy of parking the bus and winning penalties. Modern soccer has rewarded progressiveness and bravery. They're getting into organized attacking positions more consistently than they were in 2018.
The data also shows that teams at the World Cup equivalent of the 2018 and 2022 bottom tier are improving in the quality of chances they build. The process metrics are moving in the right direction even when the goal category output hasn't shifted yet.
But the last ten yards: executing the deliberate final combination that turns a dangerous area into a quality shot, remains the unsolved problem for most of the World Cup field.
This evolution isn’t limited to the weaker countries: The best countries in the Men’s FIFA World Cup 2026 aren't just getting to the goal more often. They also know how to finish the job together as often or better than their club teams do. The proof is in the best goals per game in the tournament in 68 years.