

Introducing Shot Locations
/On the site and on the podcast we have discussed shot rates an awful lot. A team’s shot rate is simply how many shots it has taken divided by how many shots it has conceded to its opponents. Whenever I make a Game-of the-Week prediction on the podcast, you’ll hear me use two primary pieces of information: which team is at home and which team has recorded the better shot rate. In general, shot rates help to explain not only the relative number of scoring opportunities a team has given itself, but also the relative number of scoring opportunities it is likely to get in the future. It’s predictive. There are, however, some conspicuous outliers in the league—teams that just don’t seem to follow the rules. Harrison wrote earlier this week about Montreal’s shot data. While Montreal gives up far more shots that it earns for itself, Harrison pointed out that Marco Di Vaio and company also place the ball quite well, finding the lower corners a high percentage of the time.
Perhaps Montreal’s own finishing rate is for real. But I won’t be convinced about the low rate at which teams have finished against Montreal before first delving into some new numbers. We have our own shot location data here at American Soccer Analysis, now, and I’m going to use it.
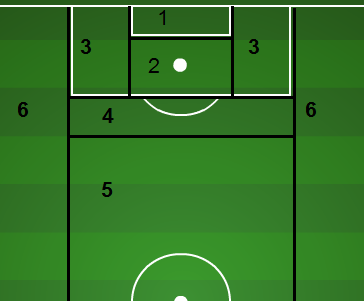 I have broken the field down into six primary scoring zones (seen to the right) in the hopes of accounting for the difficulty of both angle and distance. It is possible that some teams earn a higher quality of opportunities rather than a higher quantity—or vice versa. In addition to recording where each team gets its own shots, I have also gathered the locations of the shots that each team has given up defensively from each zone. Here are some interesting tidbits about Montreal’s defense.
Despite being ahead much of the time—which would seemingly encourage low-quality attempts—Montreal still gives up a league-average proportion of shots from high-scoring zones one and two. In fact, if Montreal’s opponents had finished their attempts from zones one and two at the league average clip, Montreal would have given up six additional goals this season. However, including all six zones, Montreal would have given up just two additional goals due to some unlucky results from distance.
Because Montreal has played a wide range of opponents, it would make sense that its goal scoring rates against would stabilize to something close to league norms. It turns out, for the most part, that those rates have stabilized. The zones help to control for difficulty of shots, and Montreal’s defense isn’t getting particularly lucky based on the shots it is allowing. The major controversy still lies in the Impact’s offense, and whether or not it can sustain a league-leading finishing rate. According to its shot locations, the Impact "should have" scored eight fewer goals this season.
On the flip side we have Sporting Kansas City. Unlike Montreal, the Wiz have dominated the league all season in shot rates, and yet find themselves third in the East in points per match. Could quality of shots be playing a role?
Possibly. Sporting KC gets more shots from zones two and four than the league average team, and those tend to be decent scoring zones. SKC has outscored its opponents by five goals on the season, but with average finishing rates from each zone, one would expect a goal differential closer to +7 or +8. SKC has underachieved by only about two goals according to the shot locations data. How much of that difference is skill versus luck is still well beyond this blogger, but maybe someday...
*Own goals are taken out of the shot locations data.