
A New Goalkeeper Metric: Clean Sheets Earned (CSE)
/At the end of a season in soccer, the Golden Glove is awarded to the goalkeeper that has kept the most clean sheets. It seems intuitive, as being the last line of defense, their job is mainly to stop any shots that make it past the defense from entering the goal. However, a clean sheet is when the team prevents their opponent from scoring, not just the goalkeeper; it’s a team effort.
Using the English Premier League as an example, David Raya (Arsenal) and Matz Sels (Nottingham Forest) both won the Golden Glove award in the 2024/25 season with 13 clean sheets each. Arsenal, however, are clearly the stronger of the two teams and we can speculate that Matz Sels likely had to do more work to earn his clean sheets as a result of playing behind a relatively weaker defensive line than Arsenal's. In fact, looking at goals prevented (derived from post-shot xG) Sels prevented 4.5 goals compared to Raya’s 2.0 (source: FotMob).
But there’s still a slight credit assignment problem. How can we separate the goalkeeper’s effort from the team’s effort when a clean sheet is kept? This would certainly be helpful to determine if the goalkeeper is just being protected by his elite defenders or if they’re putting in the sweat to earn their clean sheet and I’d like to call this metric Clean Sheets Earned (CSE).
The core of Clean Sheets Earned (CSE) is Post-Shot Expected Goals (PSxG), aka Expected Goals on Target (xGOT) which evaluates the quality of a shot after it has been taken. This tells us the probability of a shot on target would have become a goal. Now, this is important because it in itself strips out the team (or defense), only focusing on the shot and the goal.
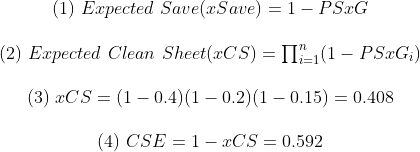
Using PSxG, I then derive the probability that a goalkeeper should have kept a clean sheet based on the quality of shots faced. For one shot faced in an entire match, the probability of not conceding on that shot is equation (1). Therefore, the probability of conceding zero goals across all on-target shots is (2). If we math it out with an actual example in (3), we can see that Clean Sheets Earned (CSE) for a given match is (4).
Building on the example, this goalkeeper would be credited with about 60% of the team's clean sheet. A higher CSE value indicates the goalkeeper did most of the heavy lifting; a lower value suggests the defensive line carried more of the burden.
It's worth being clear about what CSE is and isn't here. CSE allocates credit for the clean sheet itself, it is not a measure of overall shot-stopping quality. A goalkeeper could have an outstanding match, saving shot after shot, and if they concede once, their CSE for that game is zero. That's the point. Goals Prevented already handles the question of general shot-stopping value across a season. CSE is specifically asking: when a clean sheet was kept, how much of that belongs to the goalkeeper?
However, there’s one slight problem. Right now, CSE is contingent on the opposing team making shots on target but does not account for certain shot prevention actions a goalkeeper might take. For example, CSE would not credit a goalkeeper for claiming a cross or whipped corner, or for running out to stop a through ball before the attacker could take their shot.
In essence, a keeper who is completely in charge of his box on a clean sheet day but faces zero shots gets a CSE of 0, which undersells his contribution. So, we must attempt to incorporate this.

If the keeper also successfully intervenes in ways that kill a goal-scoring opportunity, like claiming a cross, smothering a loose ball, or sweeping a through-ball, we can extend the clean sheet probability by multiplying xCS by an additional factor for each such action. The extended formula becomes (5) where threat_j is the probability the attacking team would have scored from that situation had the keeper not intervened. The goalkeeper's prevention‑adjusted CSE is then (6).
Now every claim, punch, smother, or sweep that snuffs out danger makes the expected clean sheet probability smaller, so the goalkeeper gets more credit for earning the shutout. This adjusted CSE is still driven by shot-stopping, but with subtle credit for shot prevention layered in, using the probability values provided by the Goals Added (g+) framework, which estimates the scoring threat of every on‑ball situation, shot or no shot.
2025 MLS Regular Season
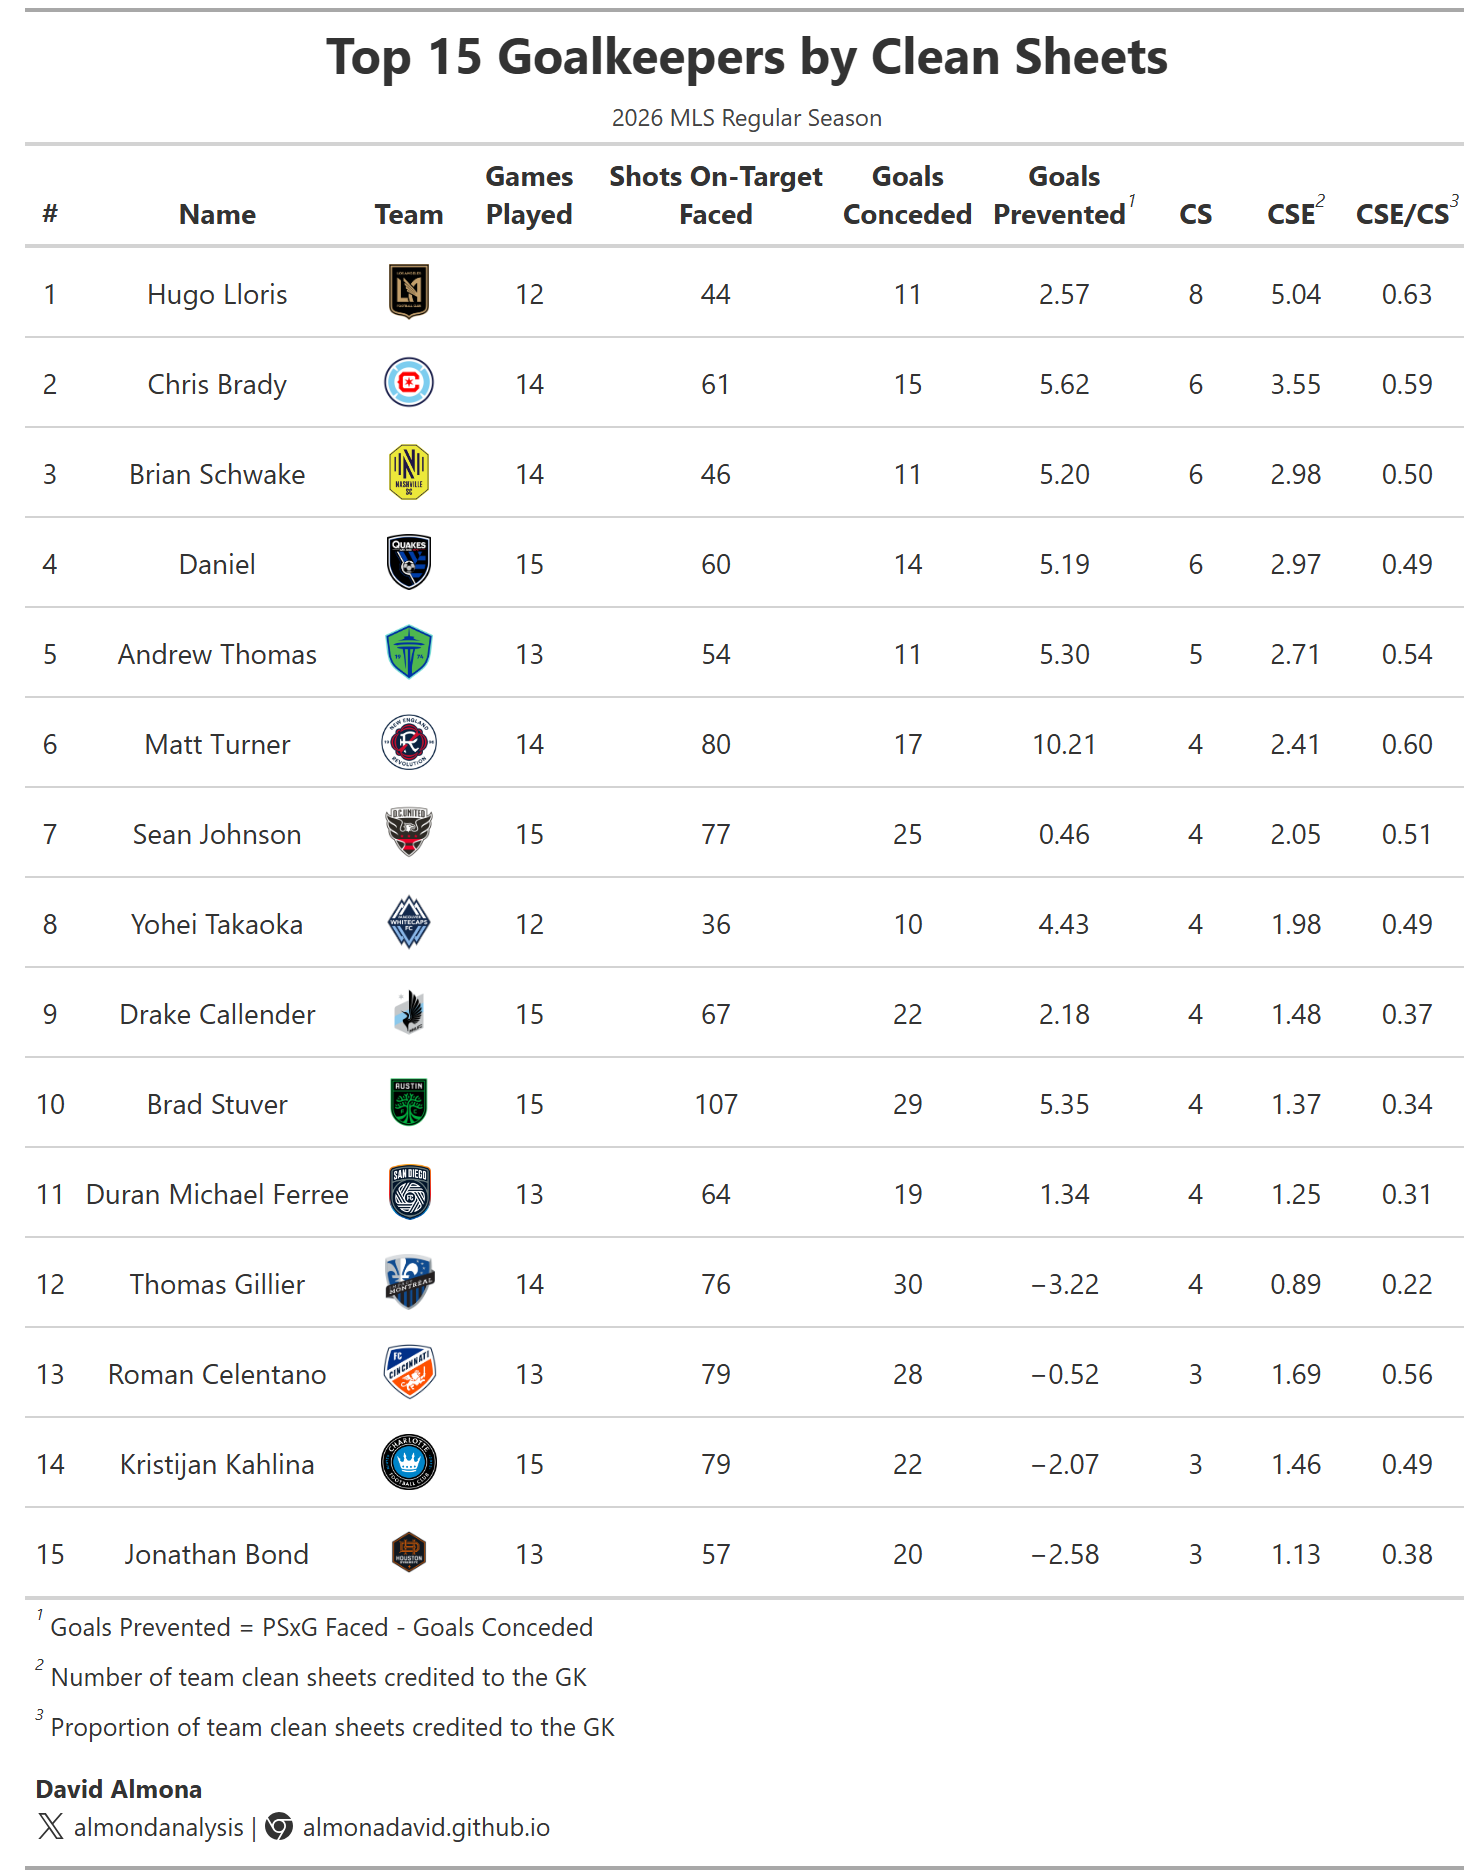
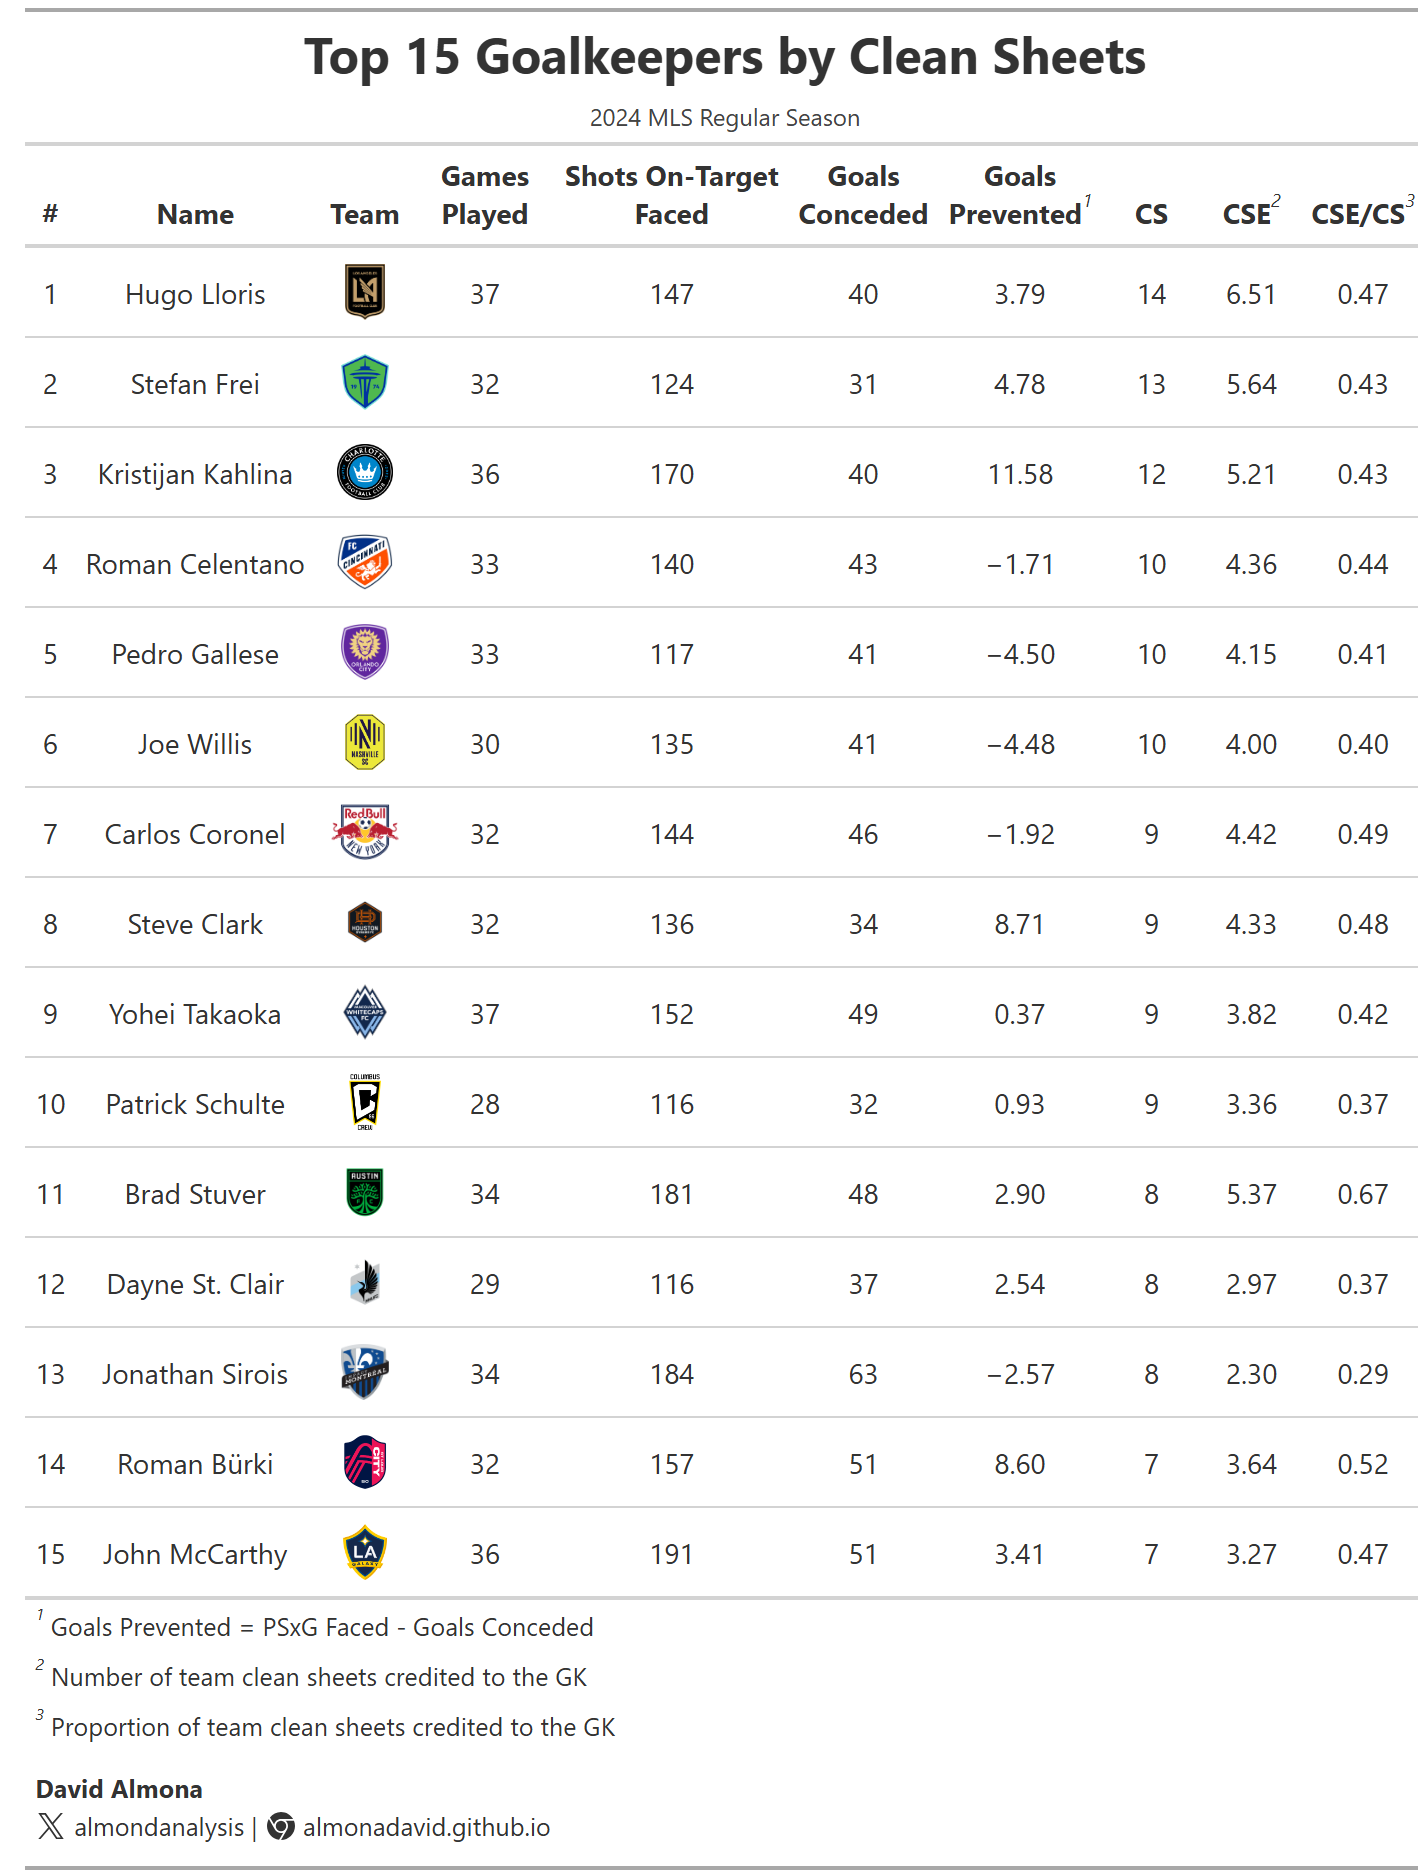
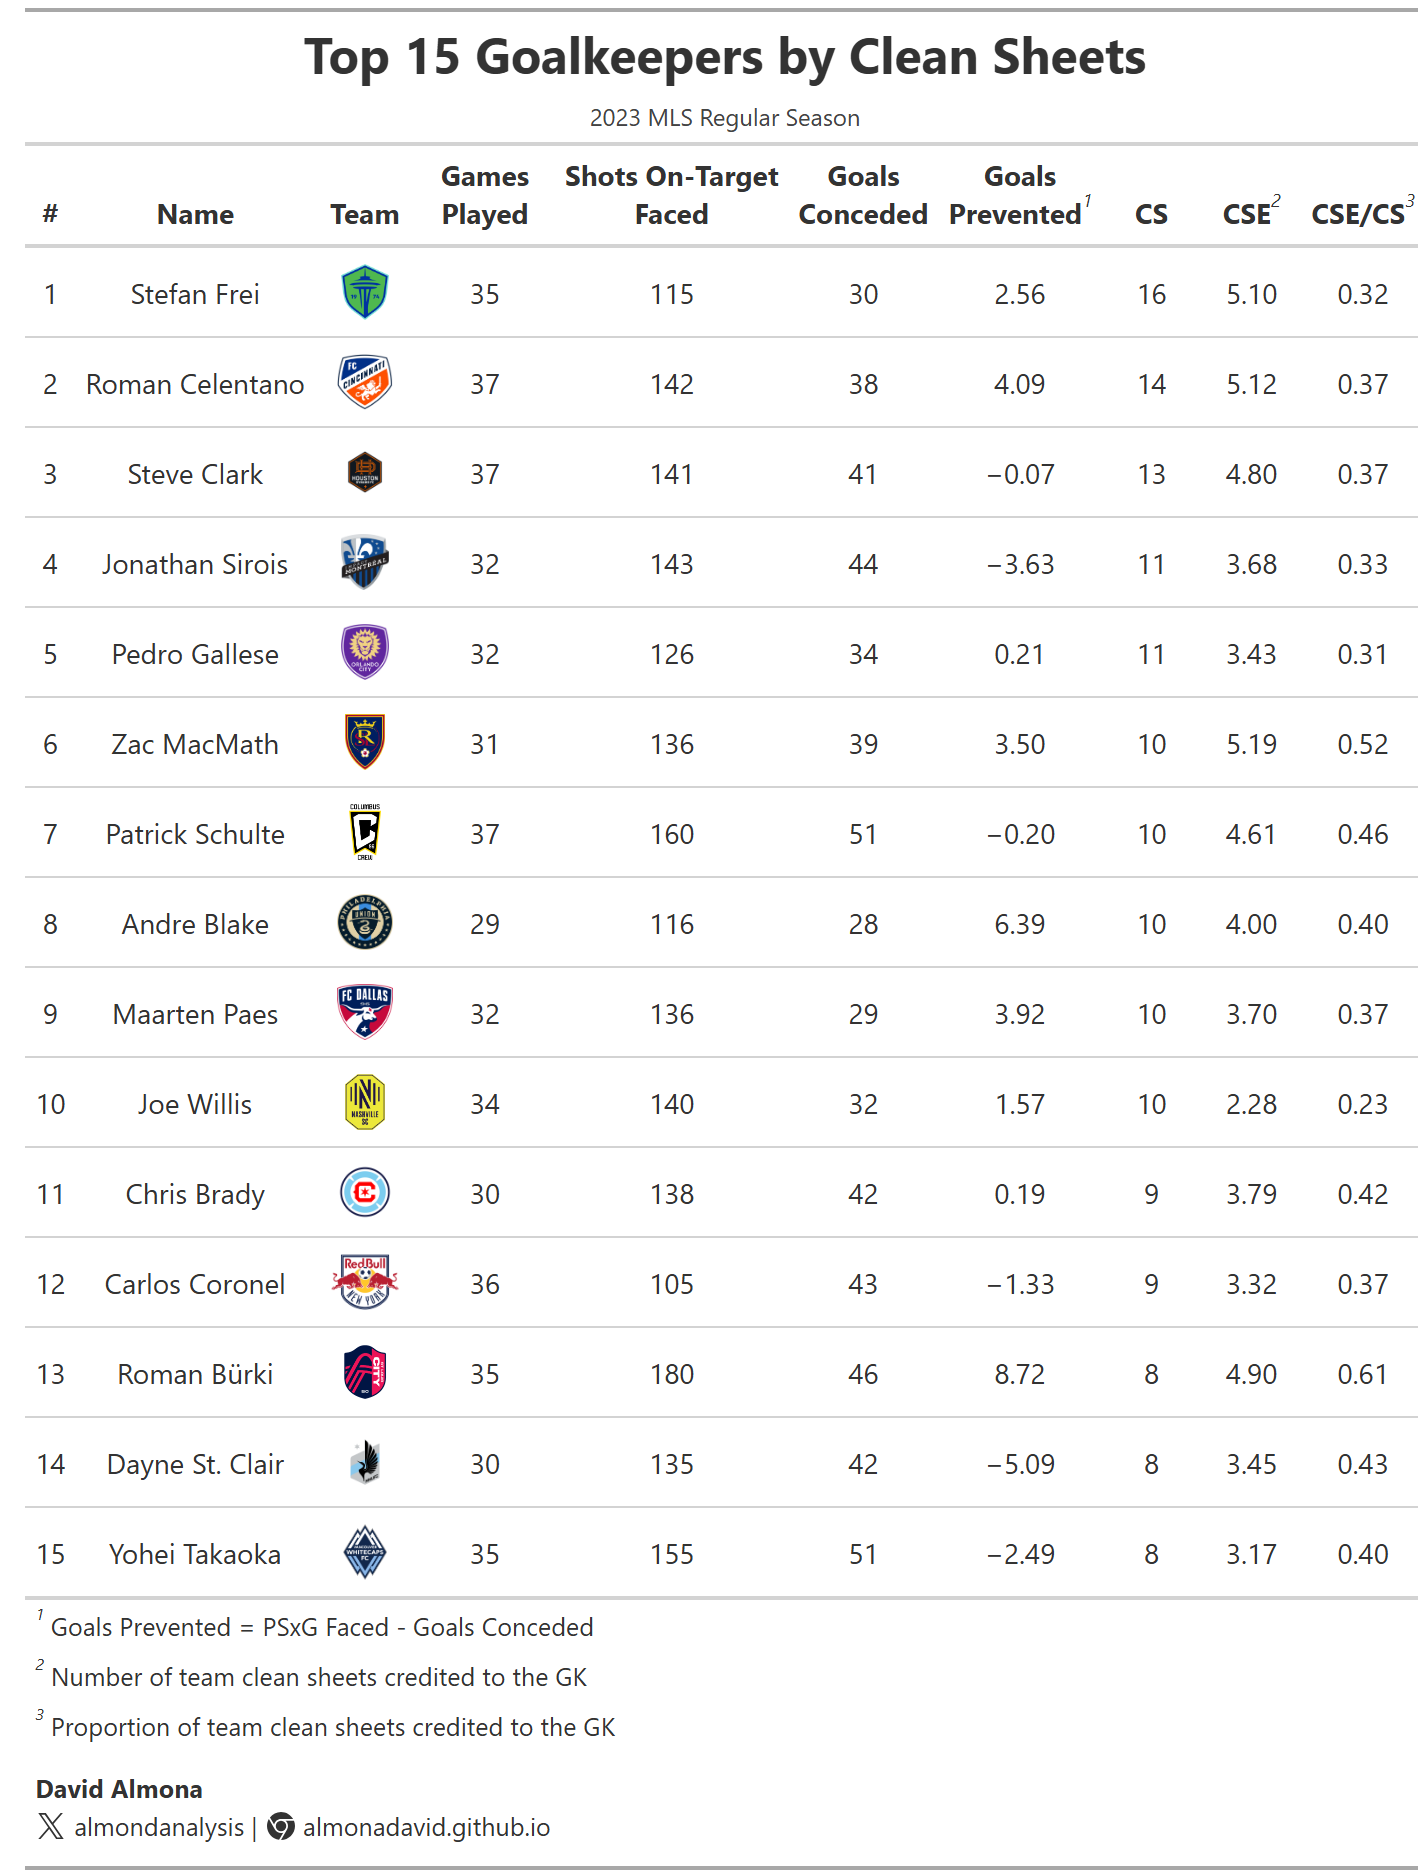
It is important to note that MLS does not award a Golden Glove; instead, it awards Goalkeeper of the Year via a weighted voting system. The table below shows the top 15 goalkeepers by total clean sheets in the 2025 MLS Regular Season. Full season tables for 2023, 2024, and the ongoing 2026 season are included in the appendix.
Kahlina and Takaoka are tied at the top with 13 clean sheets each, but CSE immediately separates them. Kahlina's CSE/CS of 0.63 is the highest in the 2025 season while Takaoka sits at 0.30, meaning Charlotte's clean sheets had significantly more goalkeeper input than Vancouver's did.
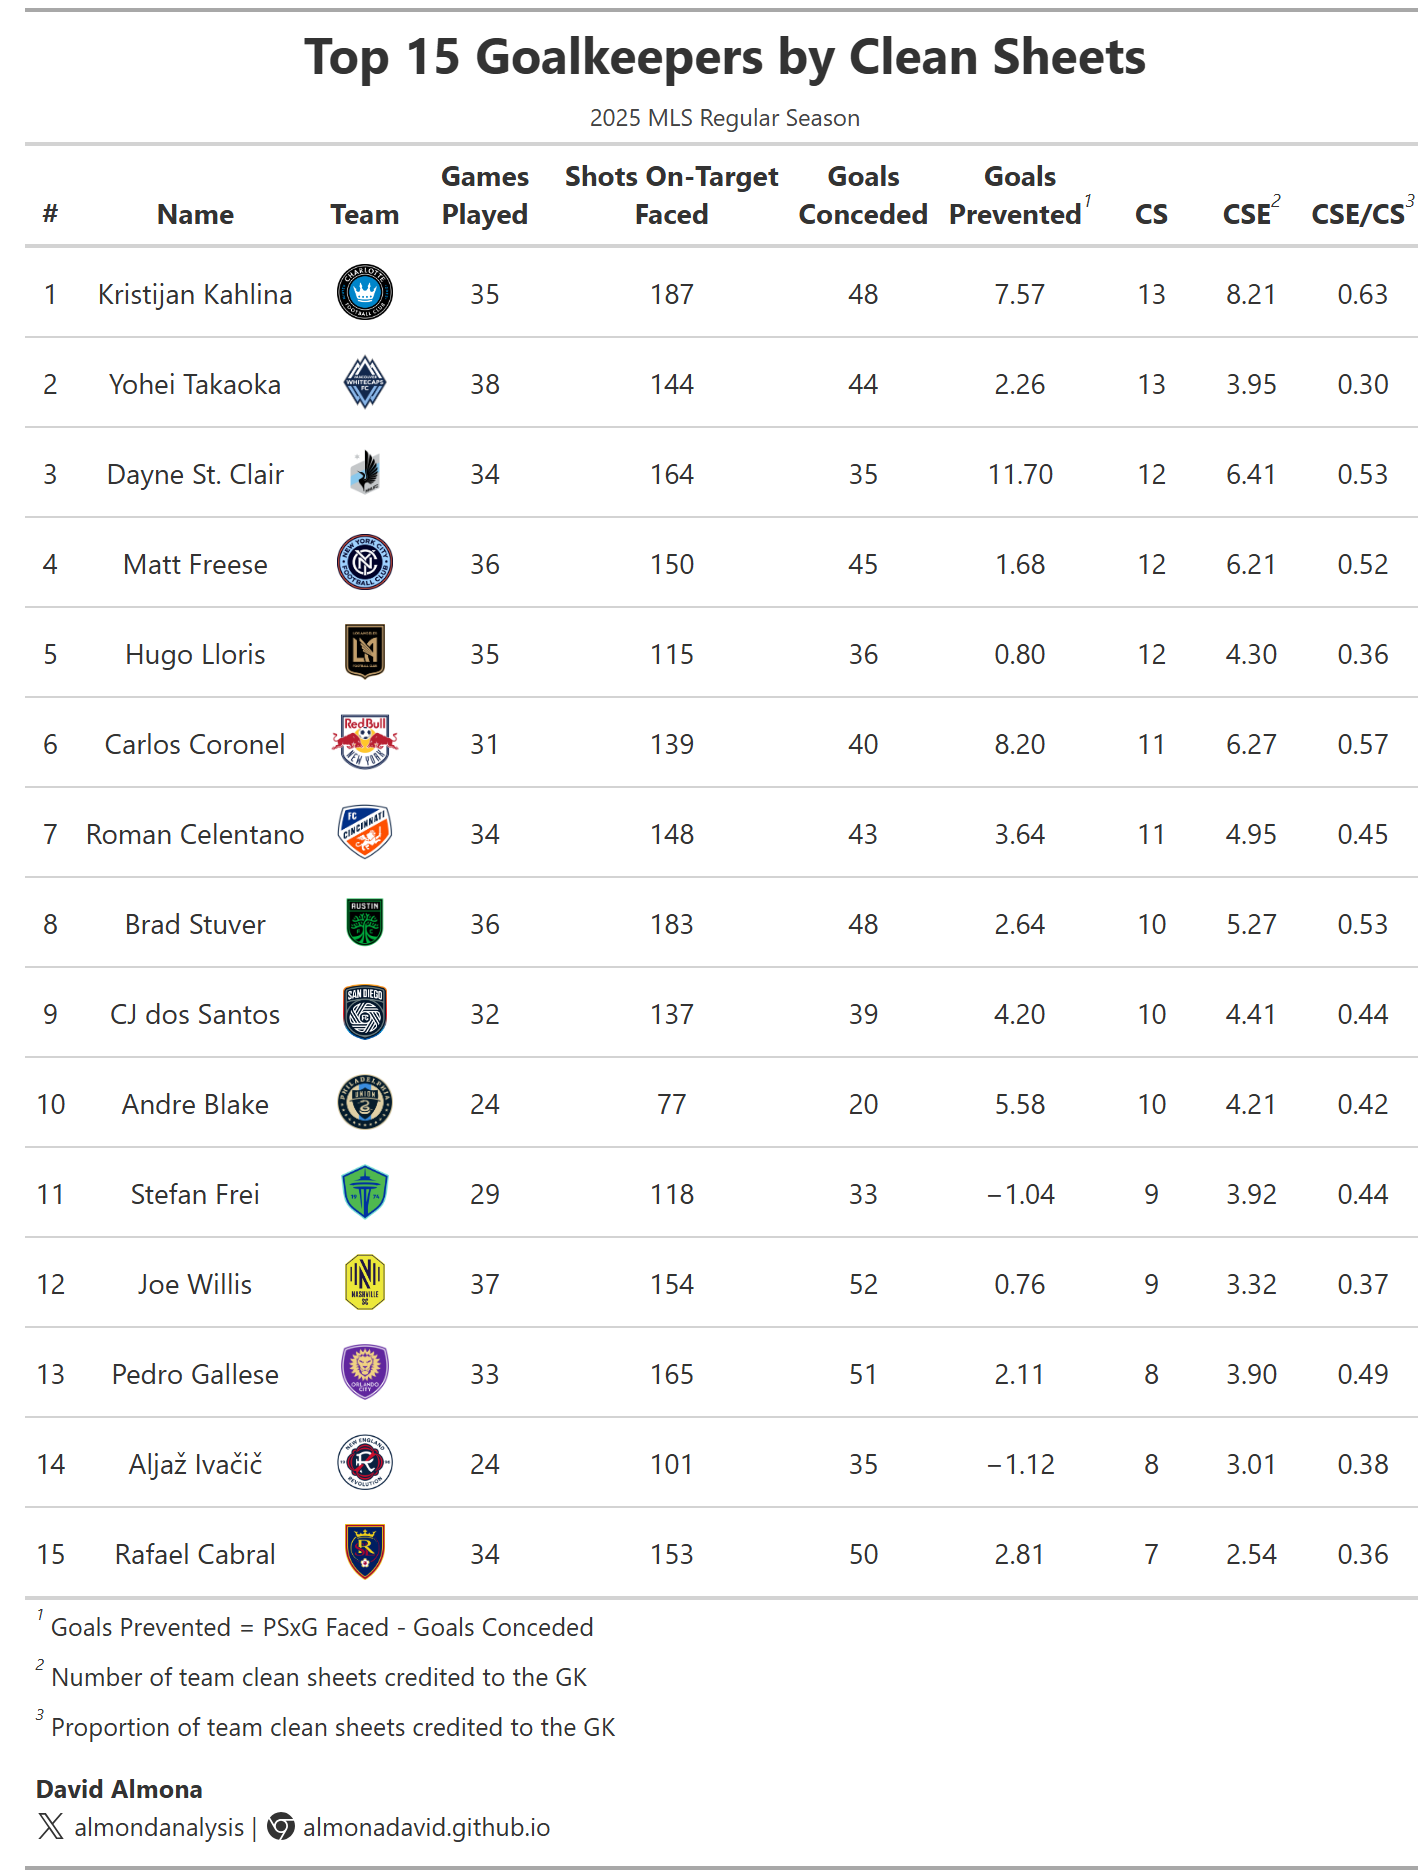
The next three, St. Clair, Freese, and Lloris, are all on 12 clean sheets, but their CSE/CS values expose how differently those shutouts were earned. St. Clair leads the group at 0.53, indicating that Minnesota's clean sheets required notable individual input from the goalkeeper. Freese is close behind at 0.52; when NYC did keep a clean sheet, Freese was actively pulling his weight. His season-long Goals Prevented (1.68) is modest, but that reflects a relatively quiet overall workload (few shots, or low‑quality shots, across the full season) not a lack of contribution on the days that mattered. Lloris sits lowest at 0.36. His similarly modest Goals Prevented (0.80) tells us that LAFC's defense regularly limited opponents to low‑quality shots on target. On clean sheet days, Lloris was primarily the beneficiary of that structure rather than its primary engine.
The contrast between Kahlina and Takaoka at the top, 0.63 versus 0.30 CSE/CS, paired with St. Clair, Freese, and Lloris shows that CSE separates goalkeepers with identical clean sheet totals by isolating how much of each shutout they personally earned, accounting for both shots stopped and chances snuffed out before a shot ever happened.
The correlation between total CSE and Goals Prevented across the dataset is 0.45, and between CSE/CS and Goals Prevented is 0.28. Both are moderate at best. This suggests that while CSE and Goals Prevented both respond to shot difficulty, they are not measuring the same thing which is expected, given CSE is conditional on clean sheets while Goals Prevented is not.
At the team level, CSE/CS correlates with team xGA at just 0.13 and with xGA per game at 0.11, meaning even when you aggregate across goalkeepers on the same team, CSE/CS has almost no relationship with how much defensive pressure that team faced overall. A high CSE/CS is not a sign that a goalkeeper faced a lot of dangerous shots across the season in general, it purely reflects the defensive environment on the specific days a clean sheet was kept.
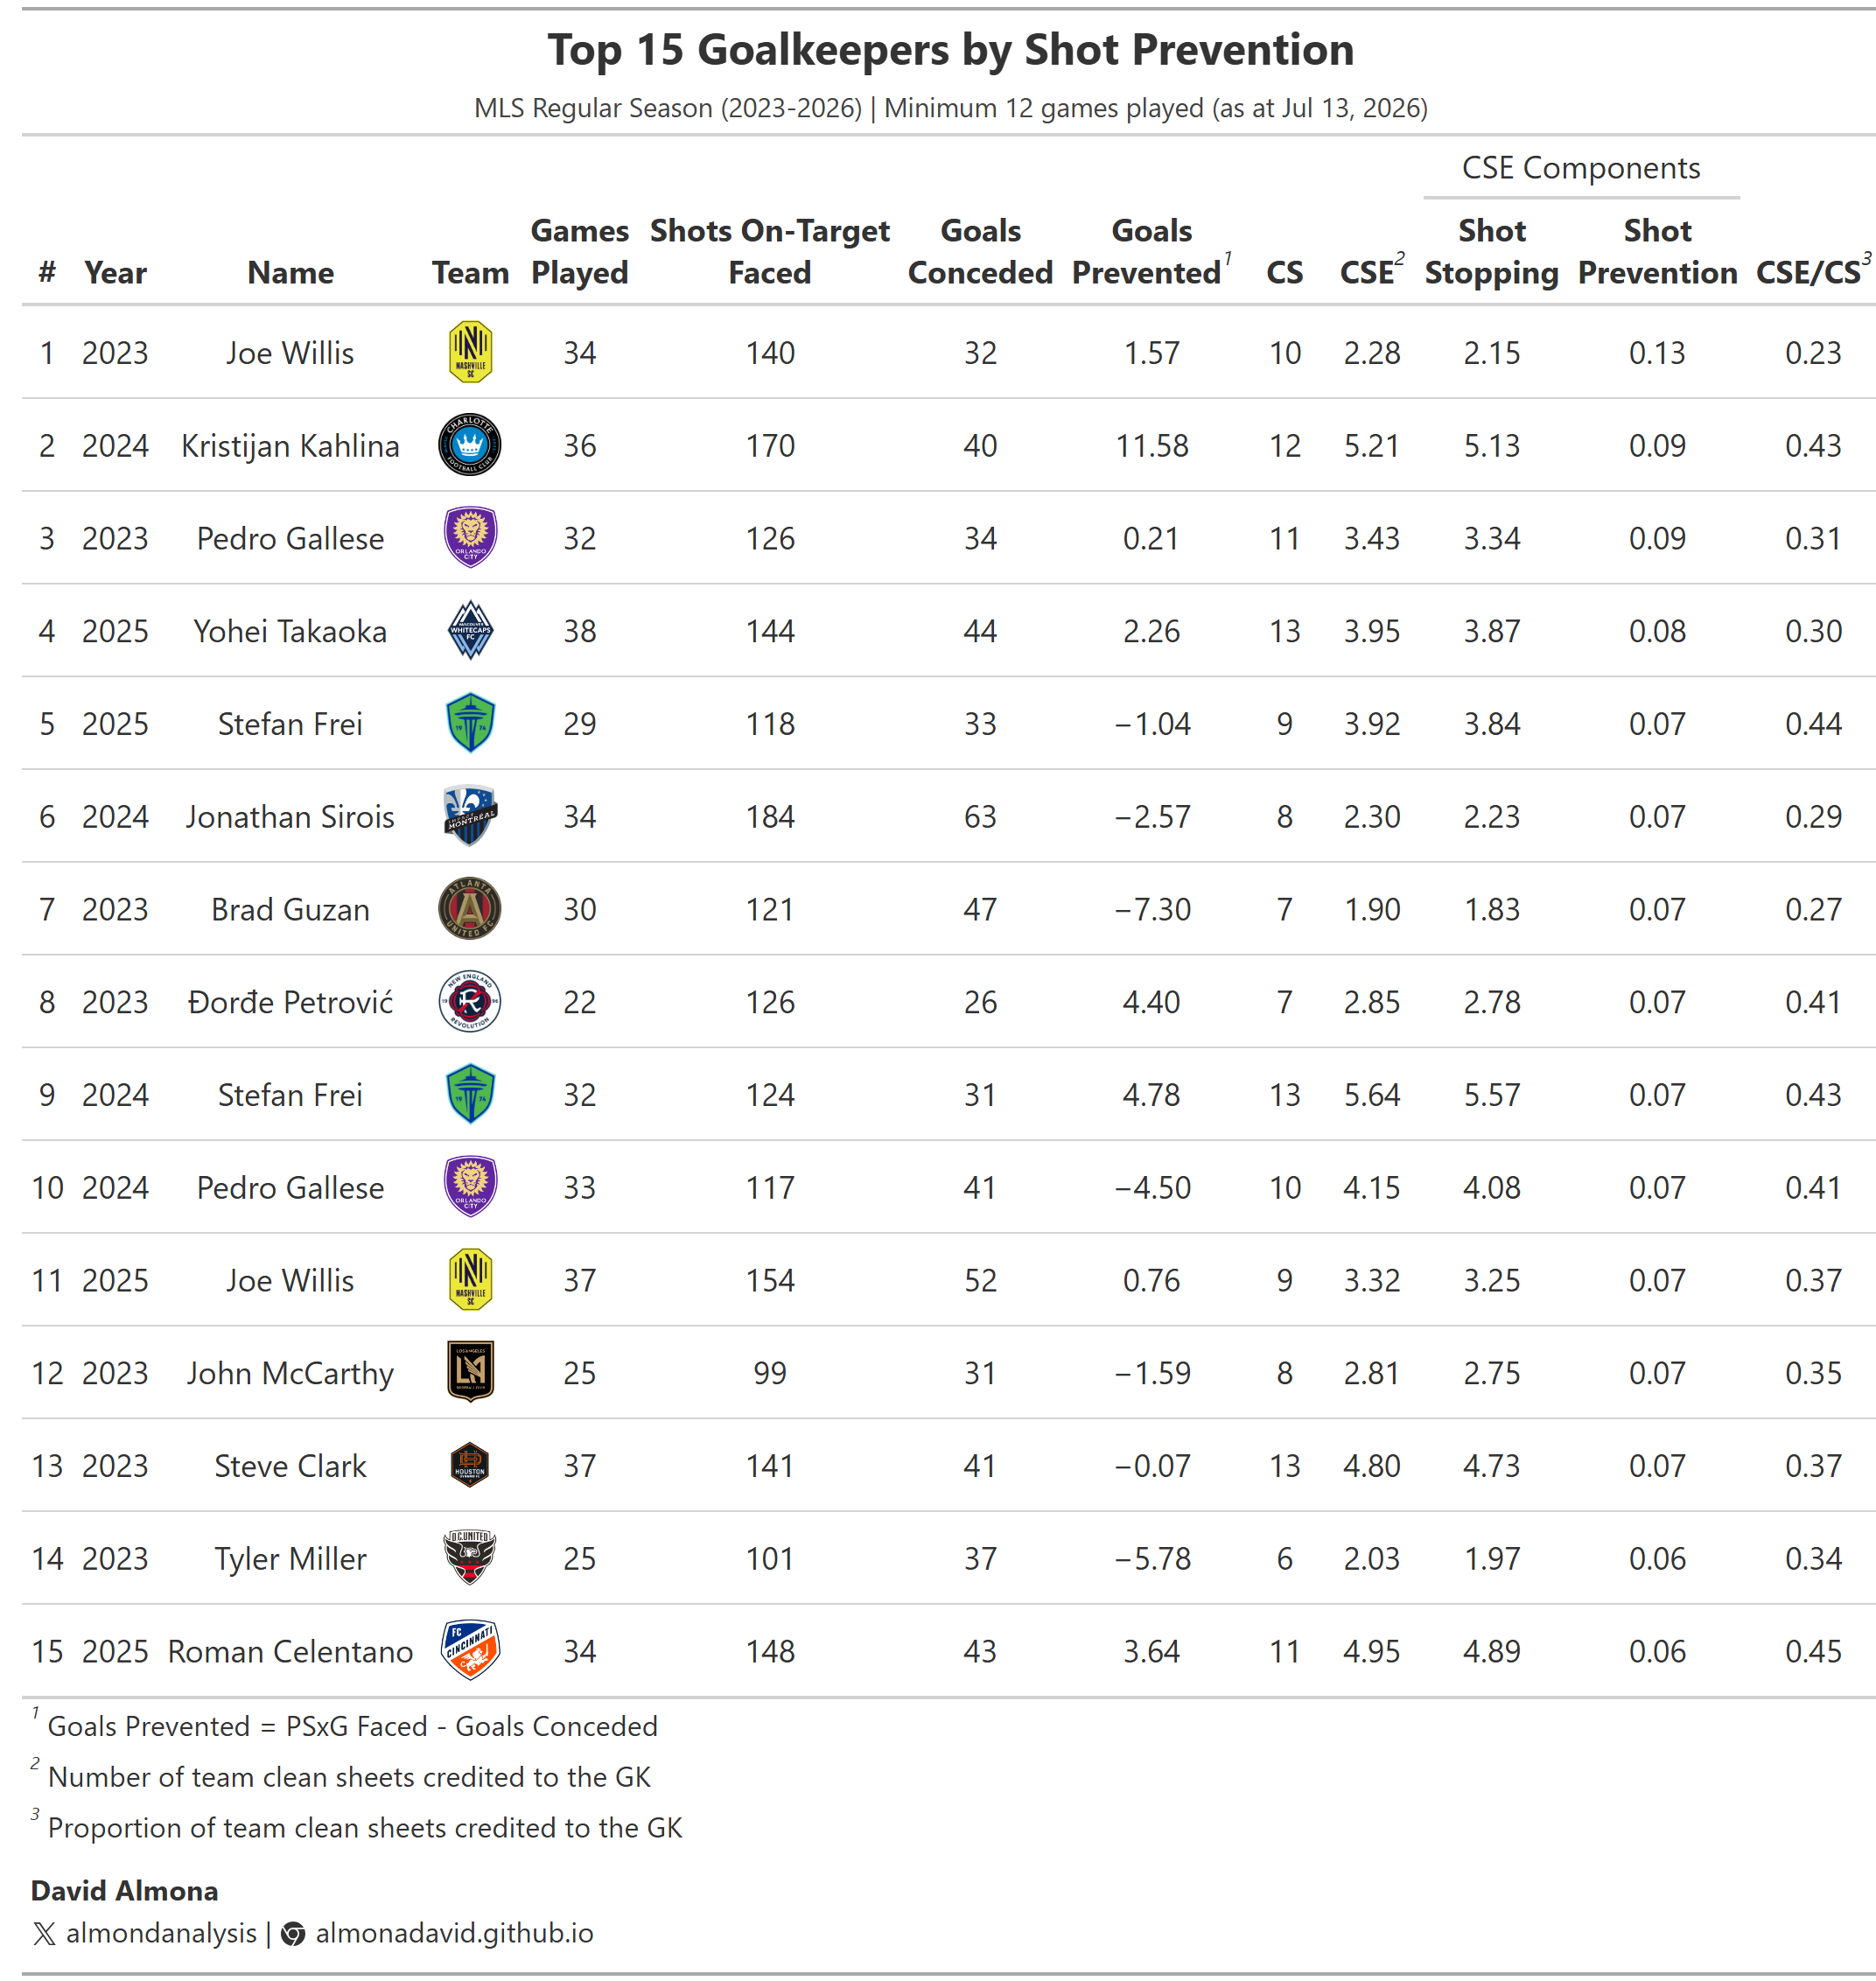
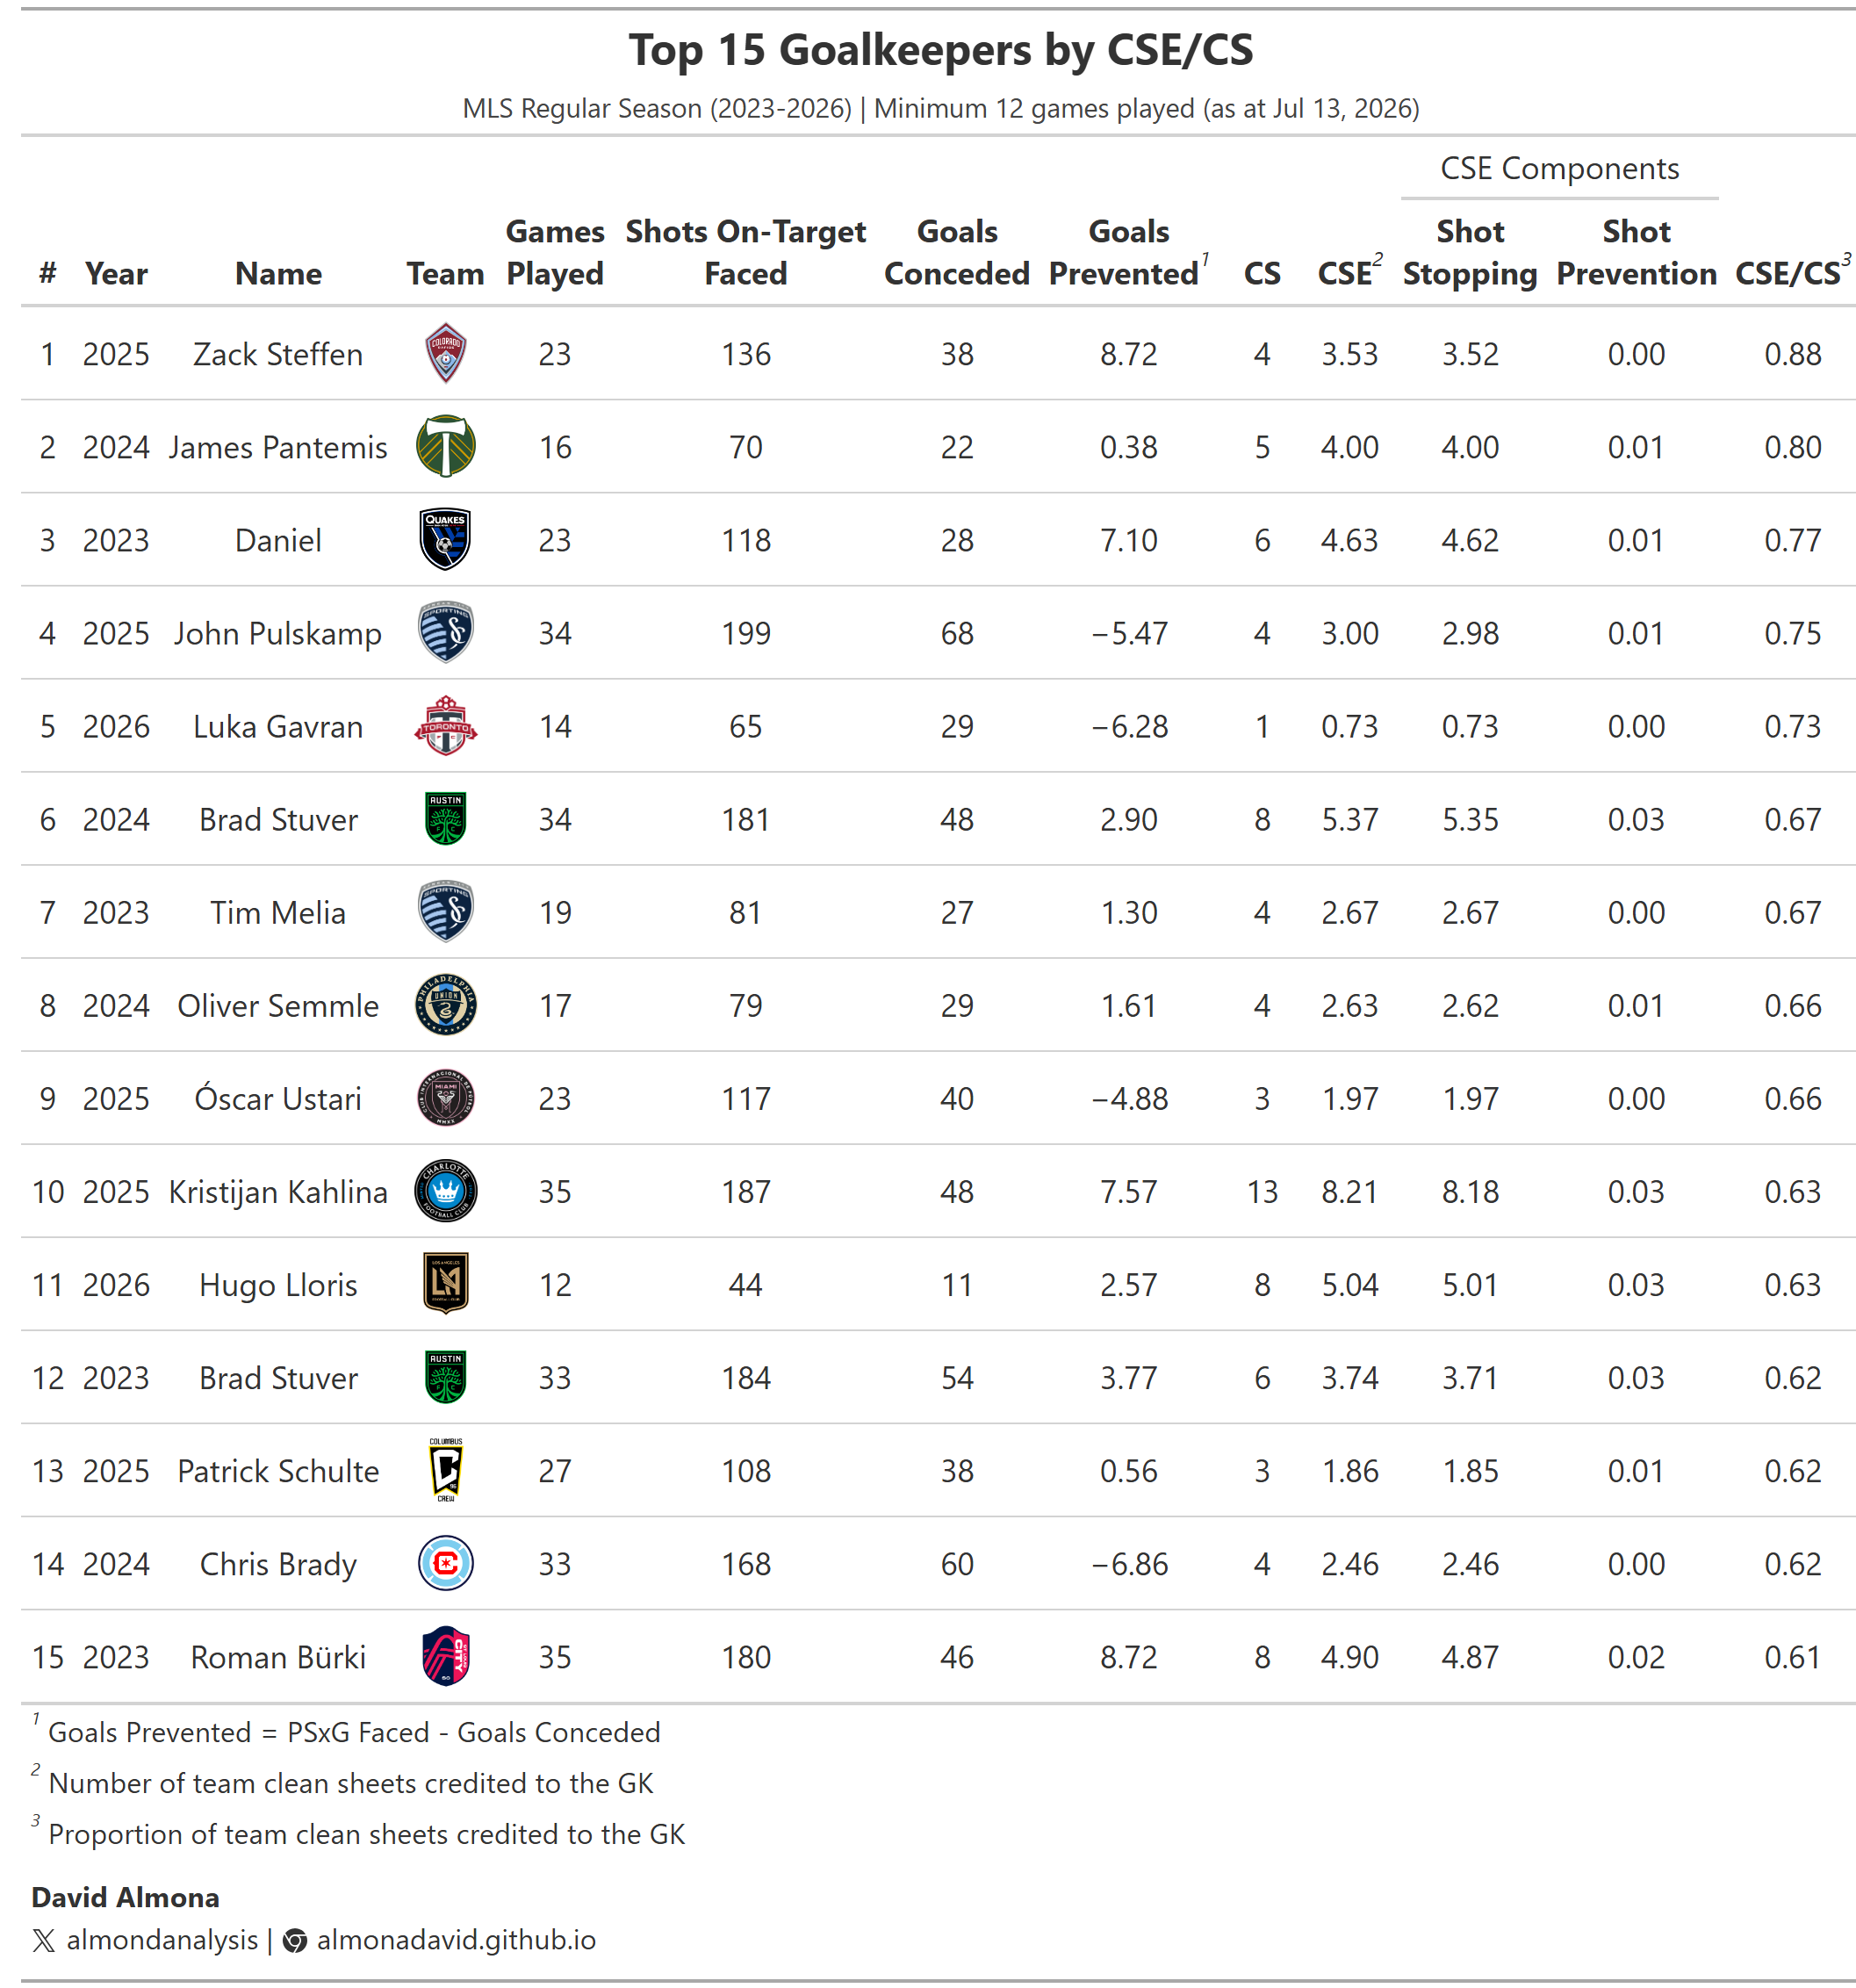
For context, across the 2023-2026 MLS seasons, the mean and median CSE/CS both sit at approximately 43%. A goalkeeper consistently above that mark is earning their clean sheets under above‑average difficulty.
Appendix
What CSE Is
CSE is a clean sheet credit allocation metric. For any match that ends in a clean sheet, it measures what share of that shutout the goalkeeper personally earned, based on the difficulty of the shots faced and the preventive actions they successfully executed. Across a season, it accumulates into a total that reflects both how many clean sheets a goalkeeper earned and how difficult those contributions were.
What CSE Isn't
CSE is not a measure of a goalkeeper's overall ability or shot-stopping quality. It does not reward goalkeepers for outstanding performances in games they ultimately concede in. That role is better filled by Goals Prevented (PSxG-G), which evaluates shot‑stopping across all games, regardless of the final scoreline. It's better understood as reflecting the effort a goalkeeper had to exert given the strength of the defense and the quality of opposition attacks on clean sheet days.
Kahlina and Takaoka both kept 13 clean sheets in the 2025 MLS Regular Season, but Kahlina owned 63% of Charlotte's clean sheets on average while Takaoka owned 30% of Vancouver's. Both performed well, with positive goals prevented values, but given their individual circumstances, Kahlina was carrying his team on clean sheet days while Takaoka was working with a more organized defensive unit behind him. Takaoka conceded fewer goals and faced 50.31 xGA compared to Kahlina's 61.67, which reflects just how different their defensive environments were.