

Scream and Shout: an xClaim Model for Goalkeeper Cross Collection
/Ever since we built goals added (g+) oh so many years ago, I’ve largely been unhappy with how we’ve treated goalkeepers here at ASA. ASA, the masterful puppeteer in the shadows crafting the rise of Matt Turner and Djordje Petrovic to the Premier League, letting them down! And so, my fellow analytics practitioners, ask not what your goalkeeper can do for you, but what you can do for your goalkeeper.
ASA and the analytics community at large has gotten to a pretty good place with goalkeeper shotstopping, at least with event only data. You scale the saves they make by the quality of chances they face, you accept that’s a pretty noisy metric season to season, it tracks directly to goals, it’s sort of easy. We have done a somewhat less good job looking at how the other parts of being a goalkeeper impact the game. Goals added does an okay job, assigning the value of their sweeping to the situations they interrupt. But it’s an imperfect picture, the whole point of sweeping is that you are preventing a much more dangerous situation from occurring further down the road, but where you are now is not actually that dangerous on its own. The ball playing side is similar, goalkeepers are so far from goal that aside from long kicks up the field, virtually all the passing they do is meaningless in the eye of a possession value model.
Today, though, we start with cross claiming. If you take the entire MLS dataset we have at ASA, the most productive cross claiming season by g+ is about +0.5 g+ across the entire season. Half a goal. Intercepting a cross in the 6 yard box off the head of a striker itself is worth half a goal! It’s wrong, and I won’t stand for this goalkeeper cross claiming erasure #GKUnion.
The Cross Kate Moss
I’m going to bury the boring technical details at the end, because nobody except the people willing to scroll to the end wants to read about gradient boosts and TabPFN tabularized transformer models, but we’ll start with the soccer details here.
I felt very strongly that the features for a cross claiming model are going to look very different from the features that appropriately predict the possession value of an action, or the xPass % calculated on the site, for example. Thinking back to many moons ago in my time as a goalkeeper, I focused these features quite heavily on three main avenues. 1) Where does the cross end up? 2) How does it get there? And 3) What does the box look like? Obviously, a cross that ends up close to the goalkeeper or the goal is going to be easier than a cross further away, but the trajectory of a cross matters heavily. A cross might “end” as a throw-in on the far side of the pitch, but that ignores that it whizzed past the goalkeeper’s face moments before. Similarly, what the box looks like is going to heavily determine your decision to stay and protect the goal or come and claim a cross. Is it packed with bodies like a meat wall corner? A counter attack where you have an awkward decision given the pace of the attack? A deep low block holding a 1-0 lead with 18 players stretched in front of you?
I played around with this a lot, and ended up with 24 features, that you can see arranged by model importance in the table somewhere nearby. Of the 24, I would describe 15 of them as “geometric”, or relating to points one and two above. There is some overlap between some of the features listed, particularly the geometric ones, and if we wanted to simplify things further we could trim some of them down. One thing missing from the list of geometric features you would want to include is the “swing” on the ball, whether it’s curving towards or away from the goalkeeper. This isn’t recorded anywhere in our dataset, and we don’t have player footedness on the cross attempt baked into our dataset, but it almost certainly matters. I tried using player position and which side of the field the cross came from (and the combination of the two) to infer this, and no matter how much I tried I couldn’t make it have any impact on the model.
Of the remaining nine, seven are inferring how crowded the box is. There are many situations such as corners or set pieces where it’s very difficult for a goalkeeper to come out and claim a cross six yards from the center of the goal mouth. I tried to infer some of these with both passes/seconds in the final third before the cross features, as well as information like goal difference, and match minute. I also tried the use of player difference (ie. red cards) to try and suss out packed box situations, but it didn’t help the model. We’ll talk about things I wish this model had later, but this is a place where tracking data or StatsBomb 360 data would make a big difference.
The last feature worth talking about is “league”. This model was trained on both MLS and NWSL data, and the league flag is used as a feature. We have seen with ASA’s own xG and g+ models that this provides a much larger training set and you get better results on the women’s side than training a women’s soccer specific model. Statsbomb also spoke about this when they started releasing a lot of women’s data in 2022. It appears that for this model it matters almost zero. I was and remain pretty surprised by that finding. I was a women’s goalkeeper coach for quite some time and that does not match what I felt in my brain, but I tried training a model on only NWSL data and got largely the same feature importances and predicted xClaim values.
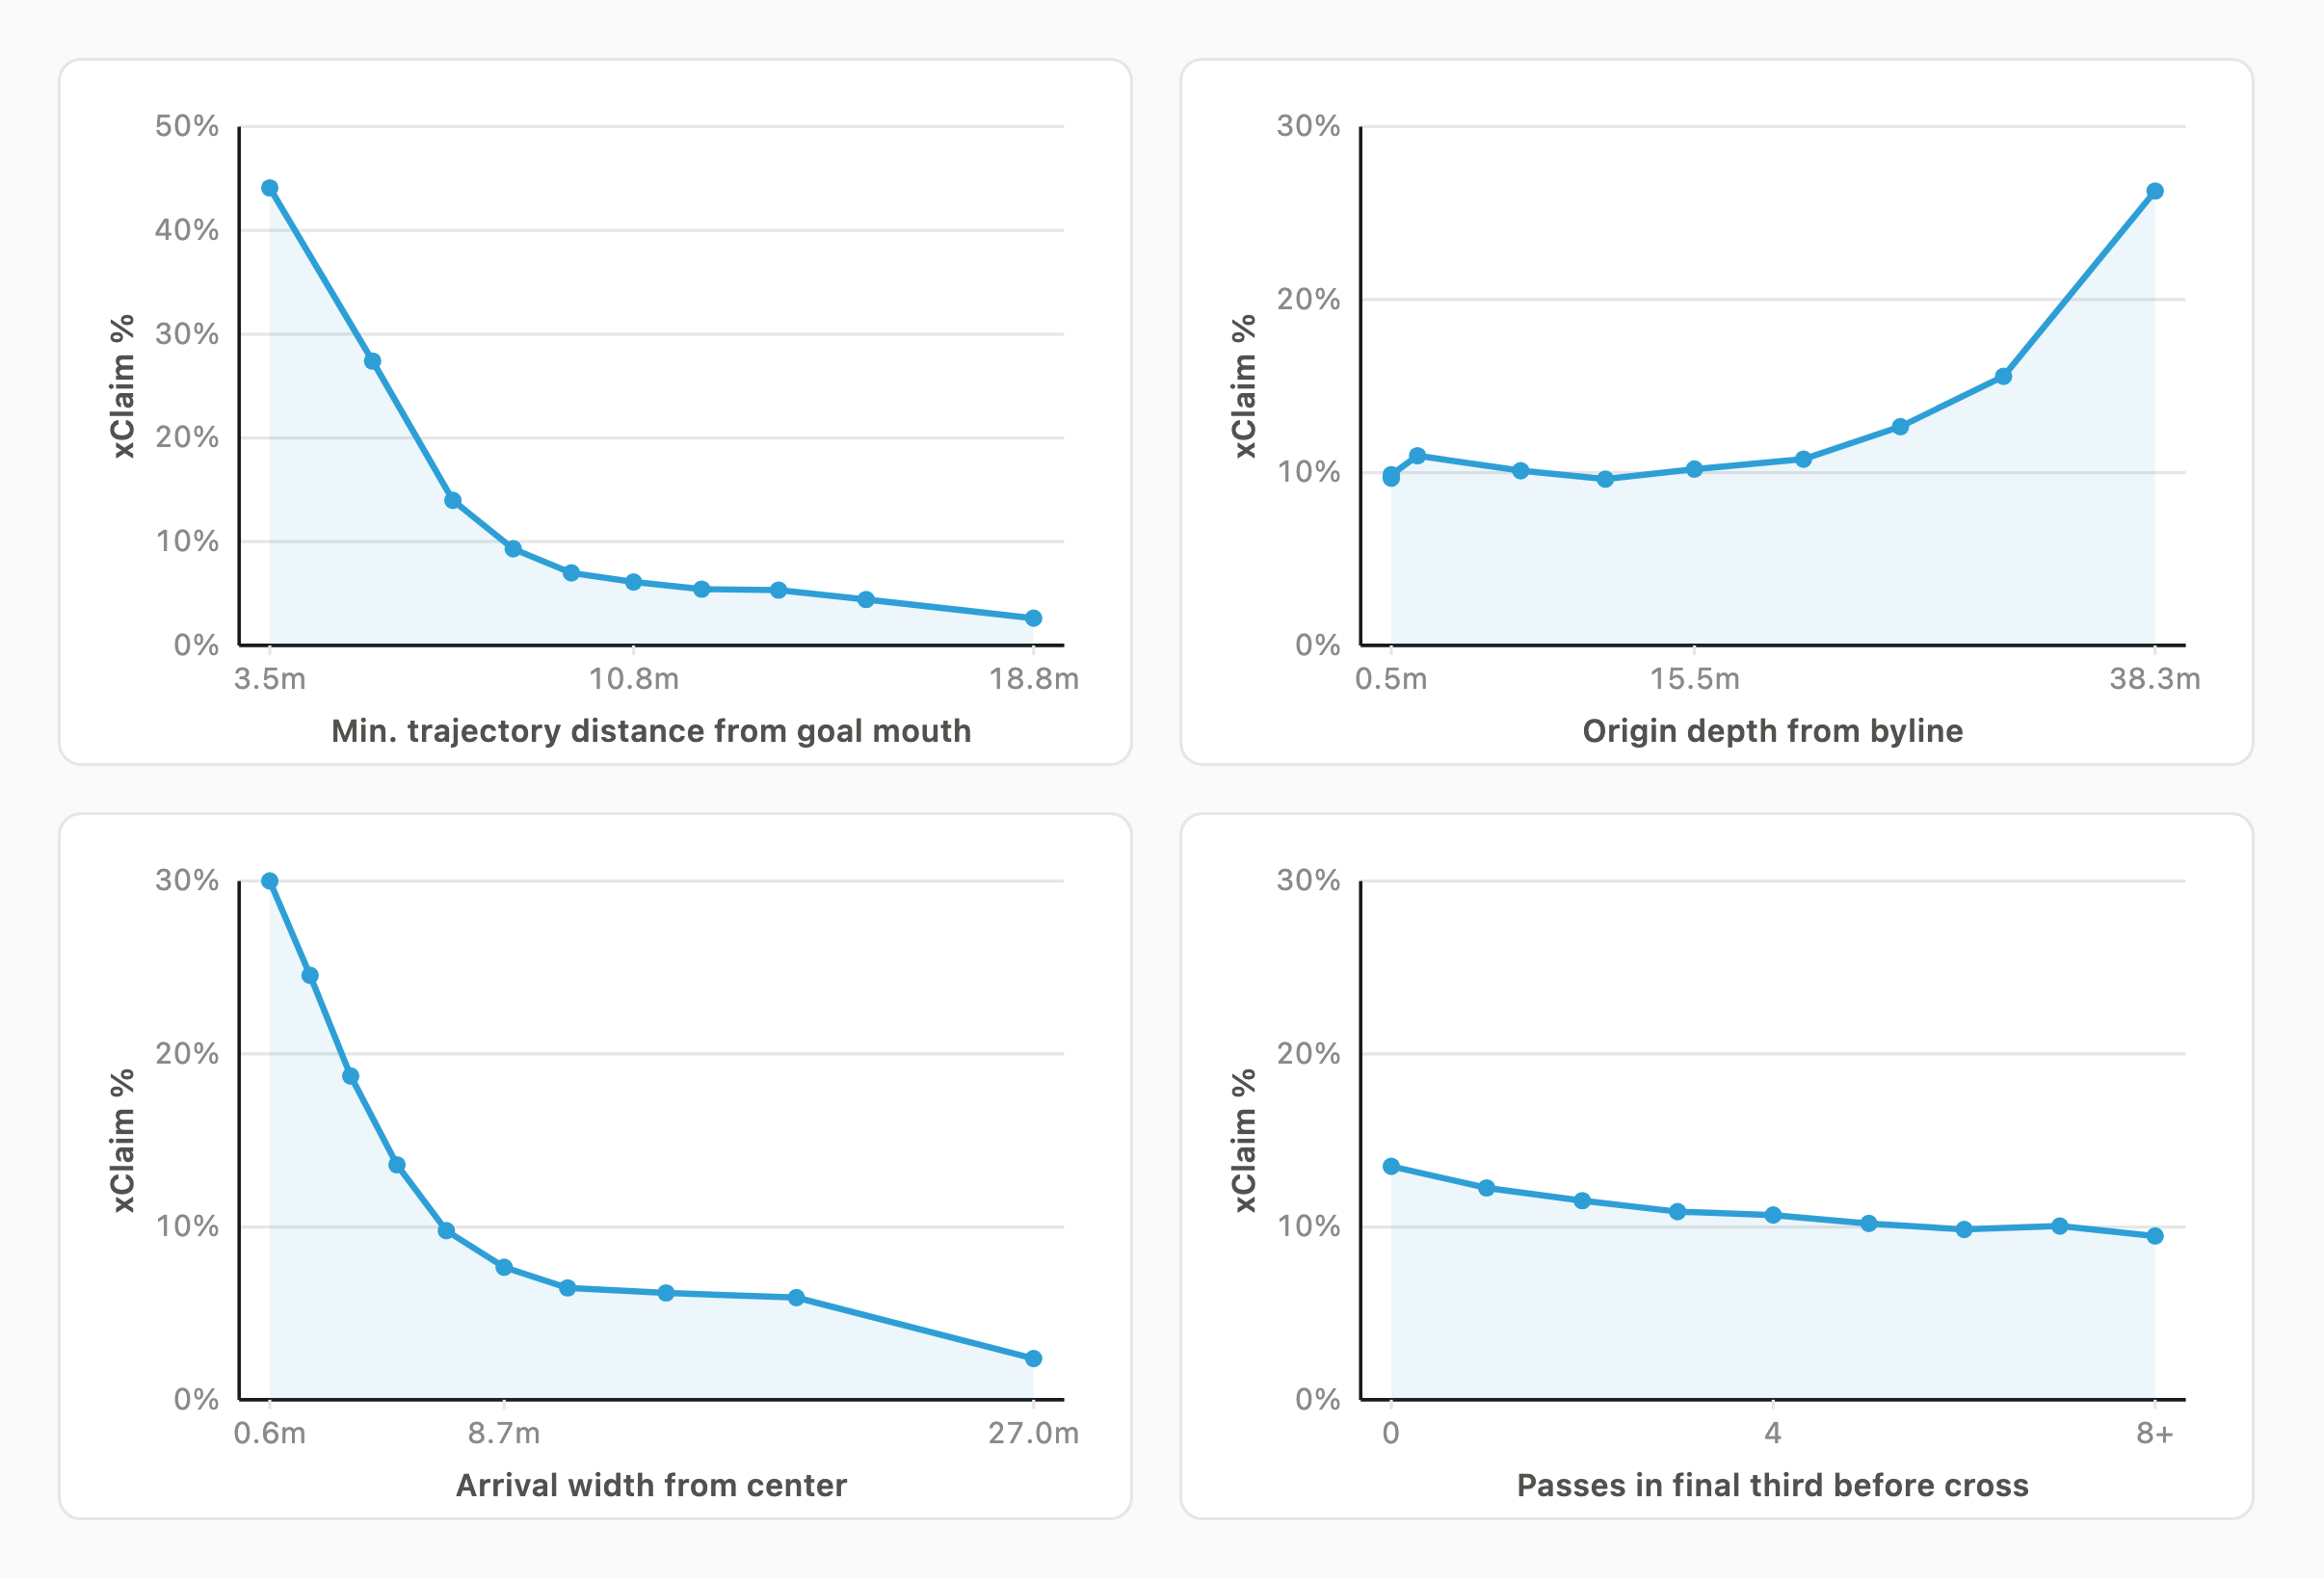
The 23 geometric and contextual features we’re left with all do what they’re supposed to. For example, the hypothesis that a longer possession in the final third before the cross results in a penalty area with more players in it should drive xClaim down. It does!
The Insights - Goalkeepers
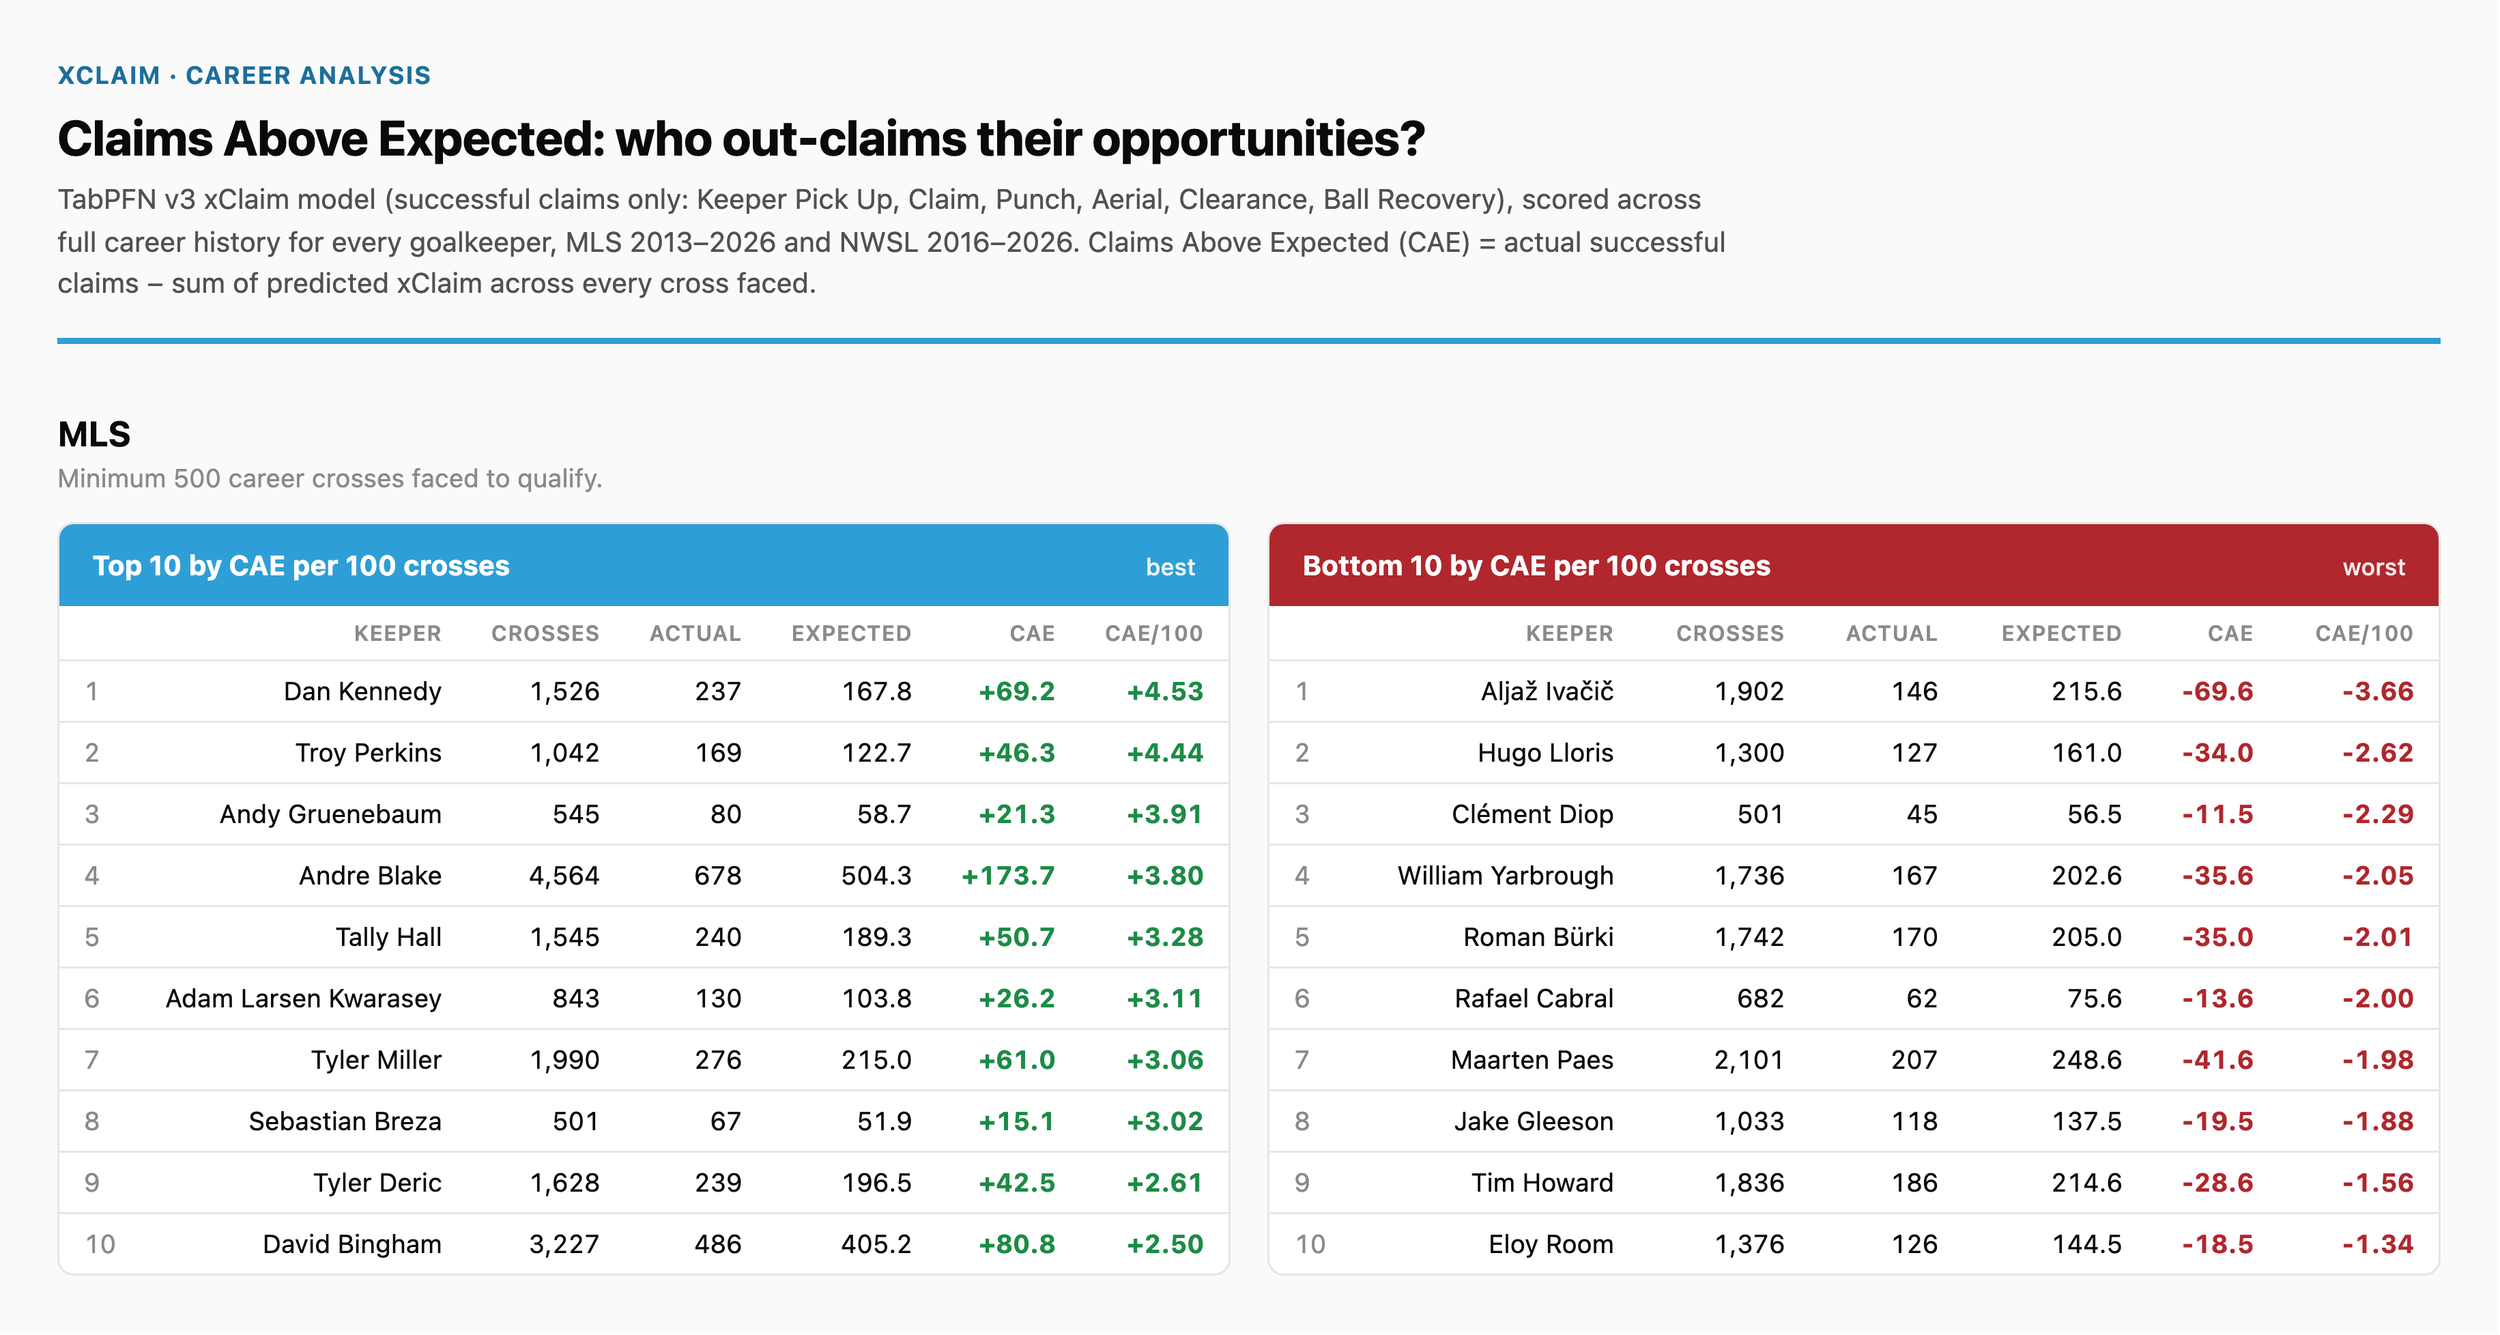
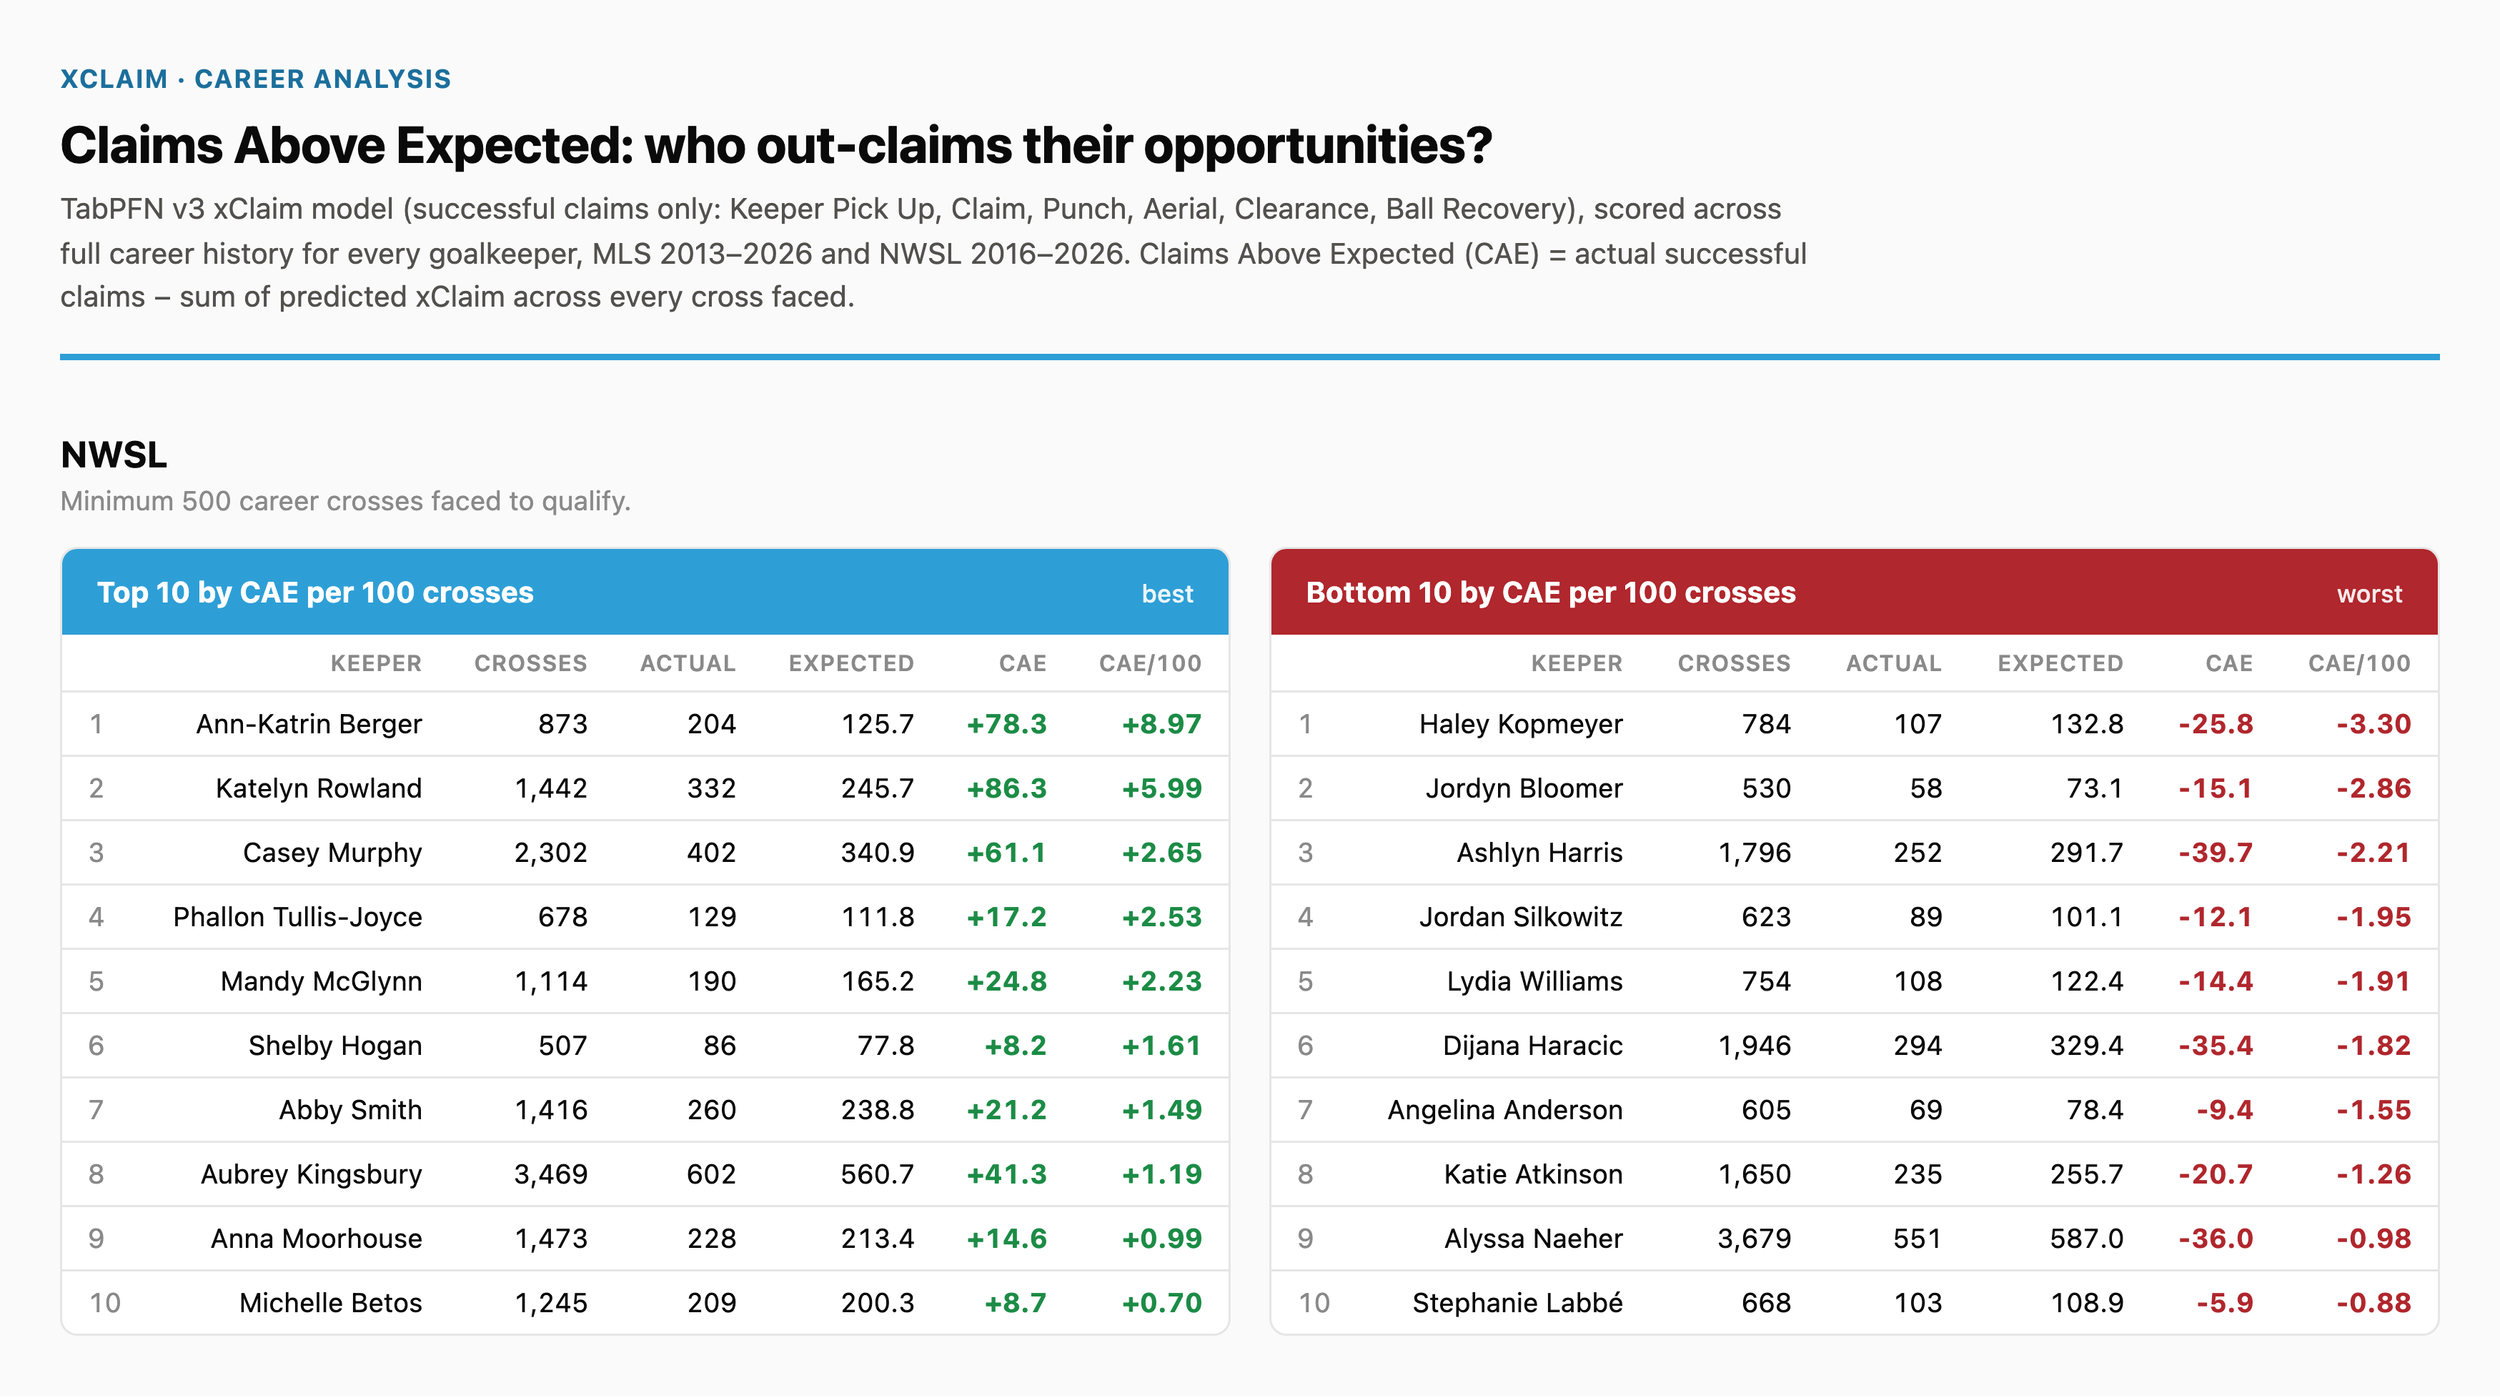
So what does this tell us? Here are the top 10 for both MLS and NWSL by total cross claims above and below expectation. I sent these lists to basically every goalkeeper coach I know who watches NWSL and/or MLS, and got pretty solid feedback that it definitely seems right. I’d agree. The NWSL list is virtually perfect to my eye. Anne-Katrin Berger, in my opinion, is the best cross claimer in the history of women’s soccer, so that’s a win. And having previously looked at some claim-adjacent data, Rowland popped ahead of Bay picking her up in their inaugural season. On the weak side, all of Labbe, Naeher, Anderson, Silkowitz, and Harris make total sense.
On the MLS side, Lloris, Diop, Howard, Room, Ivacic are goalkeepers that struggle with crosses. The positive side is more interesting. None of these guys really pop in my brain as highly active cross claimers, but I’m not sure MLS has a Thibaut Courtois or David Raya with a reputation as that kind of goalkeeper.
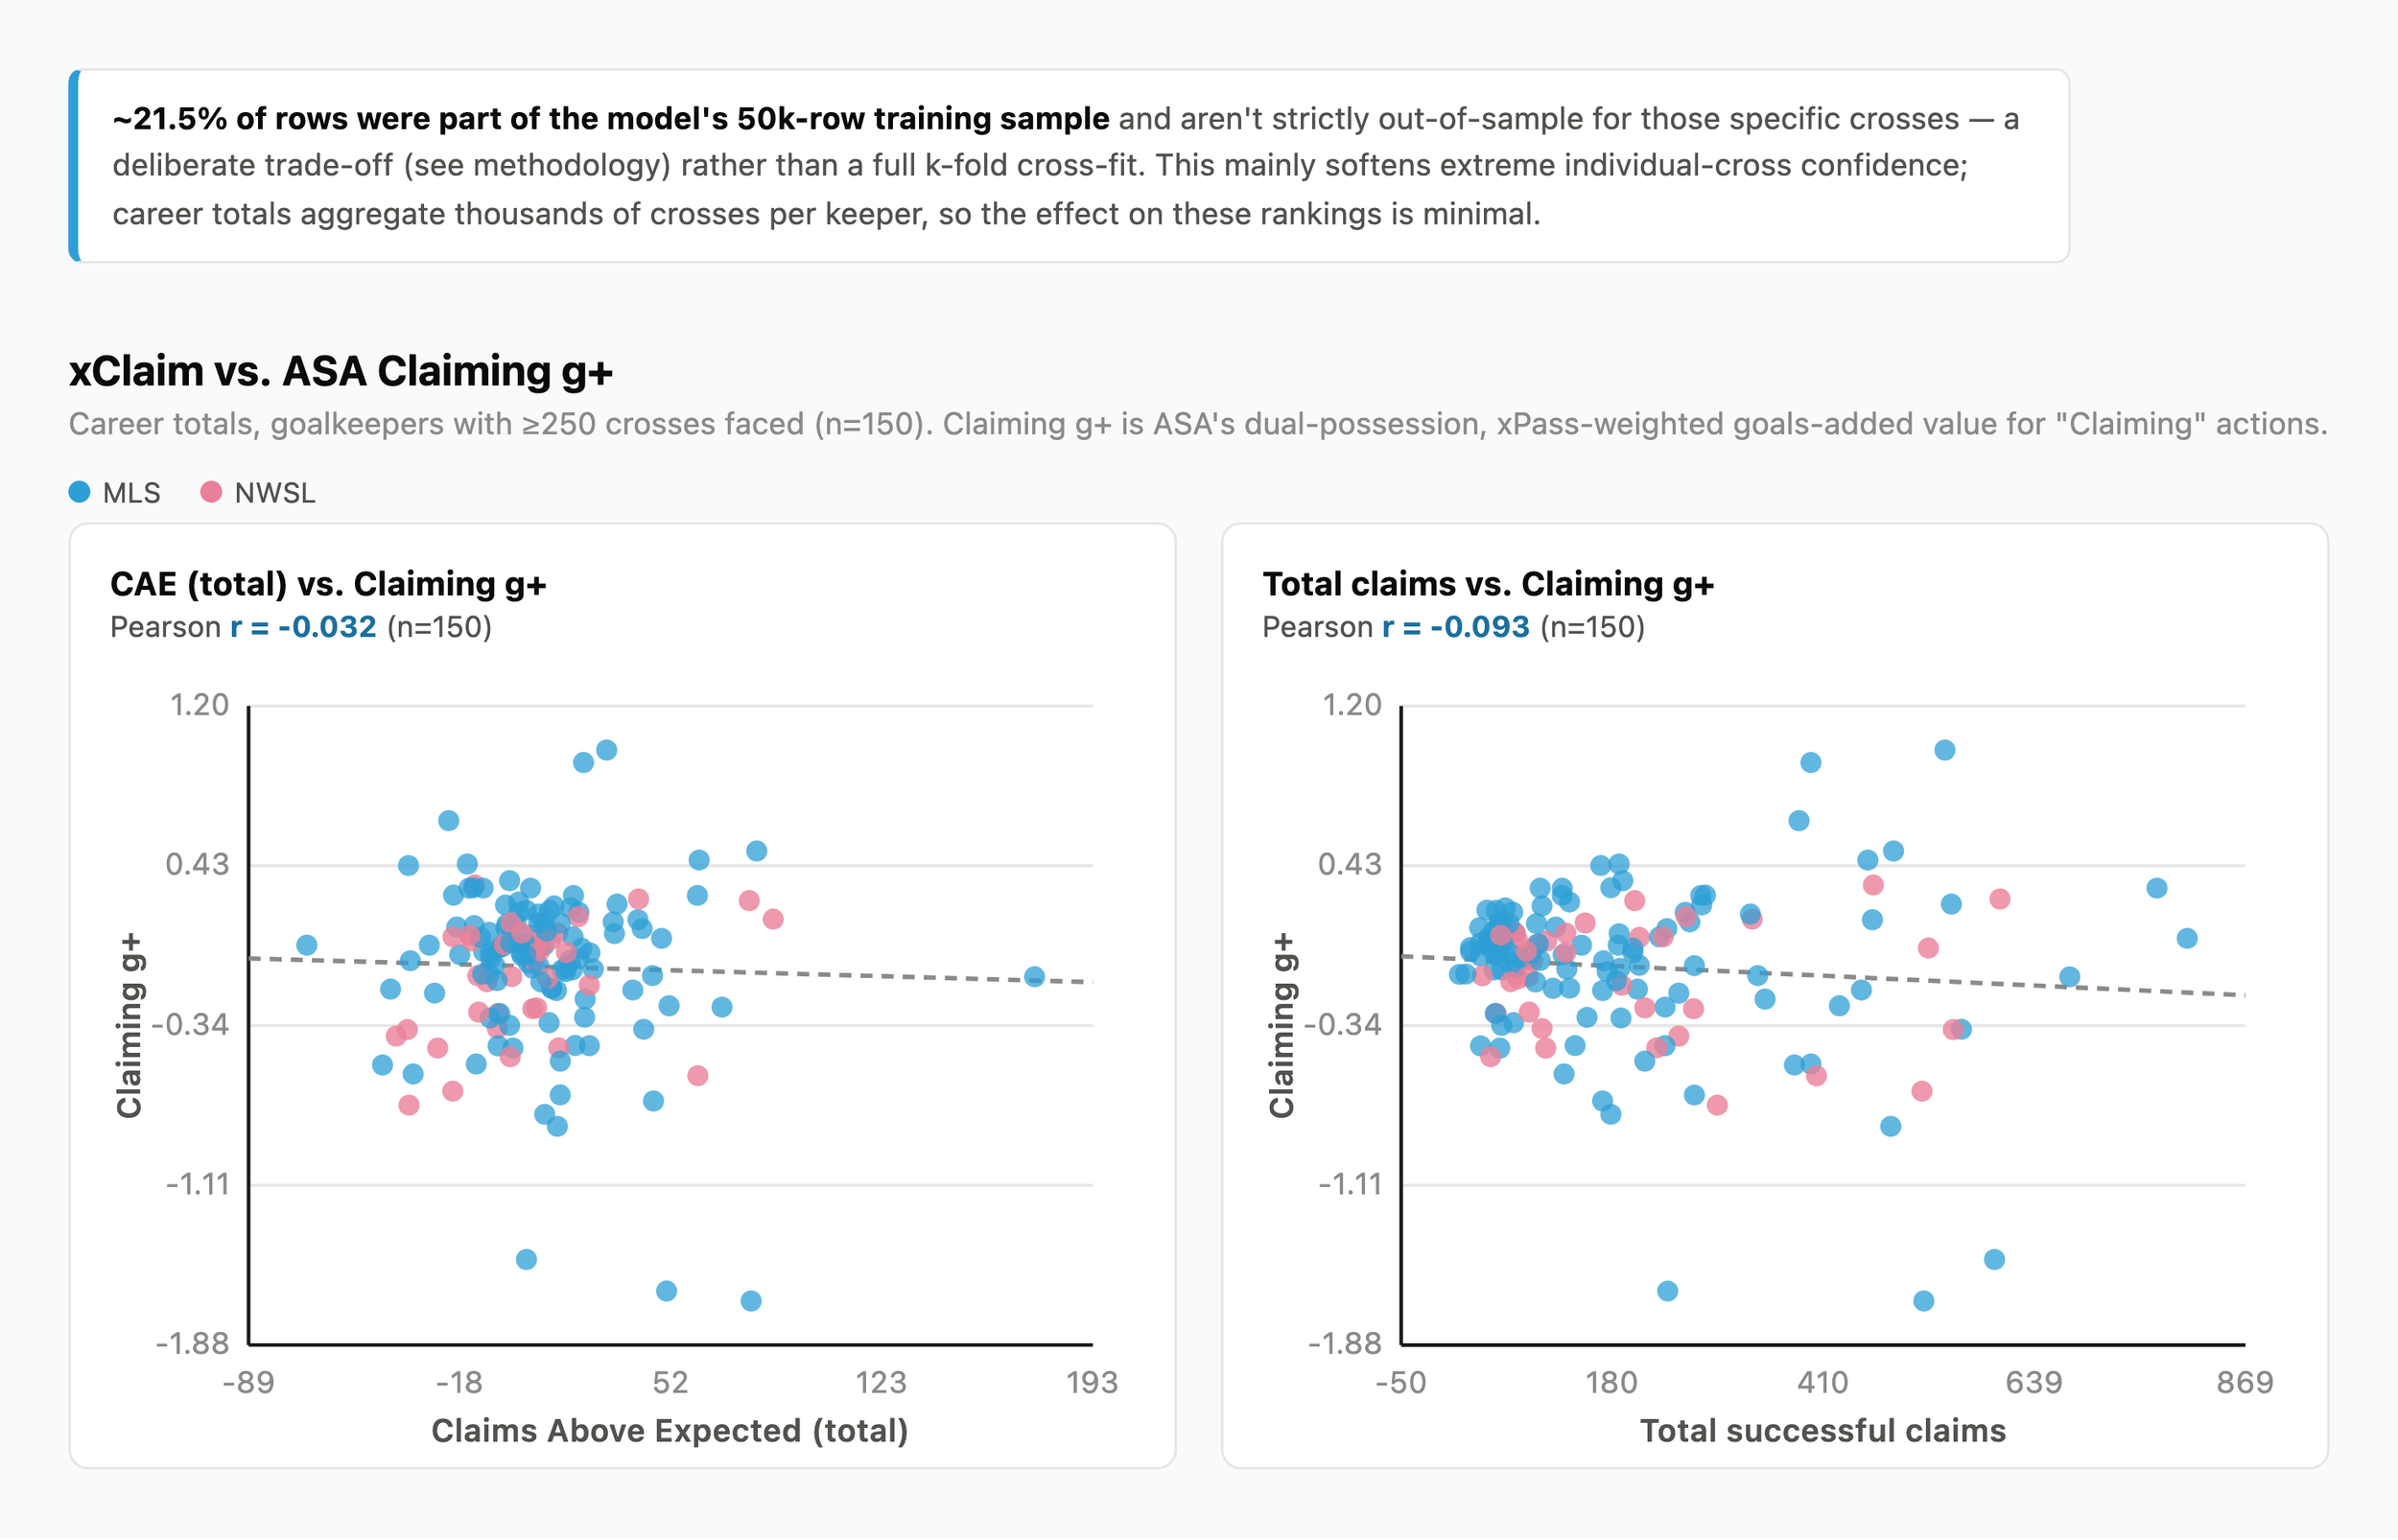
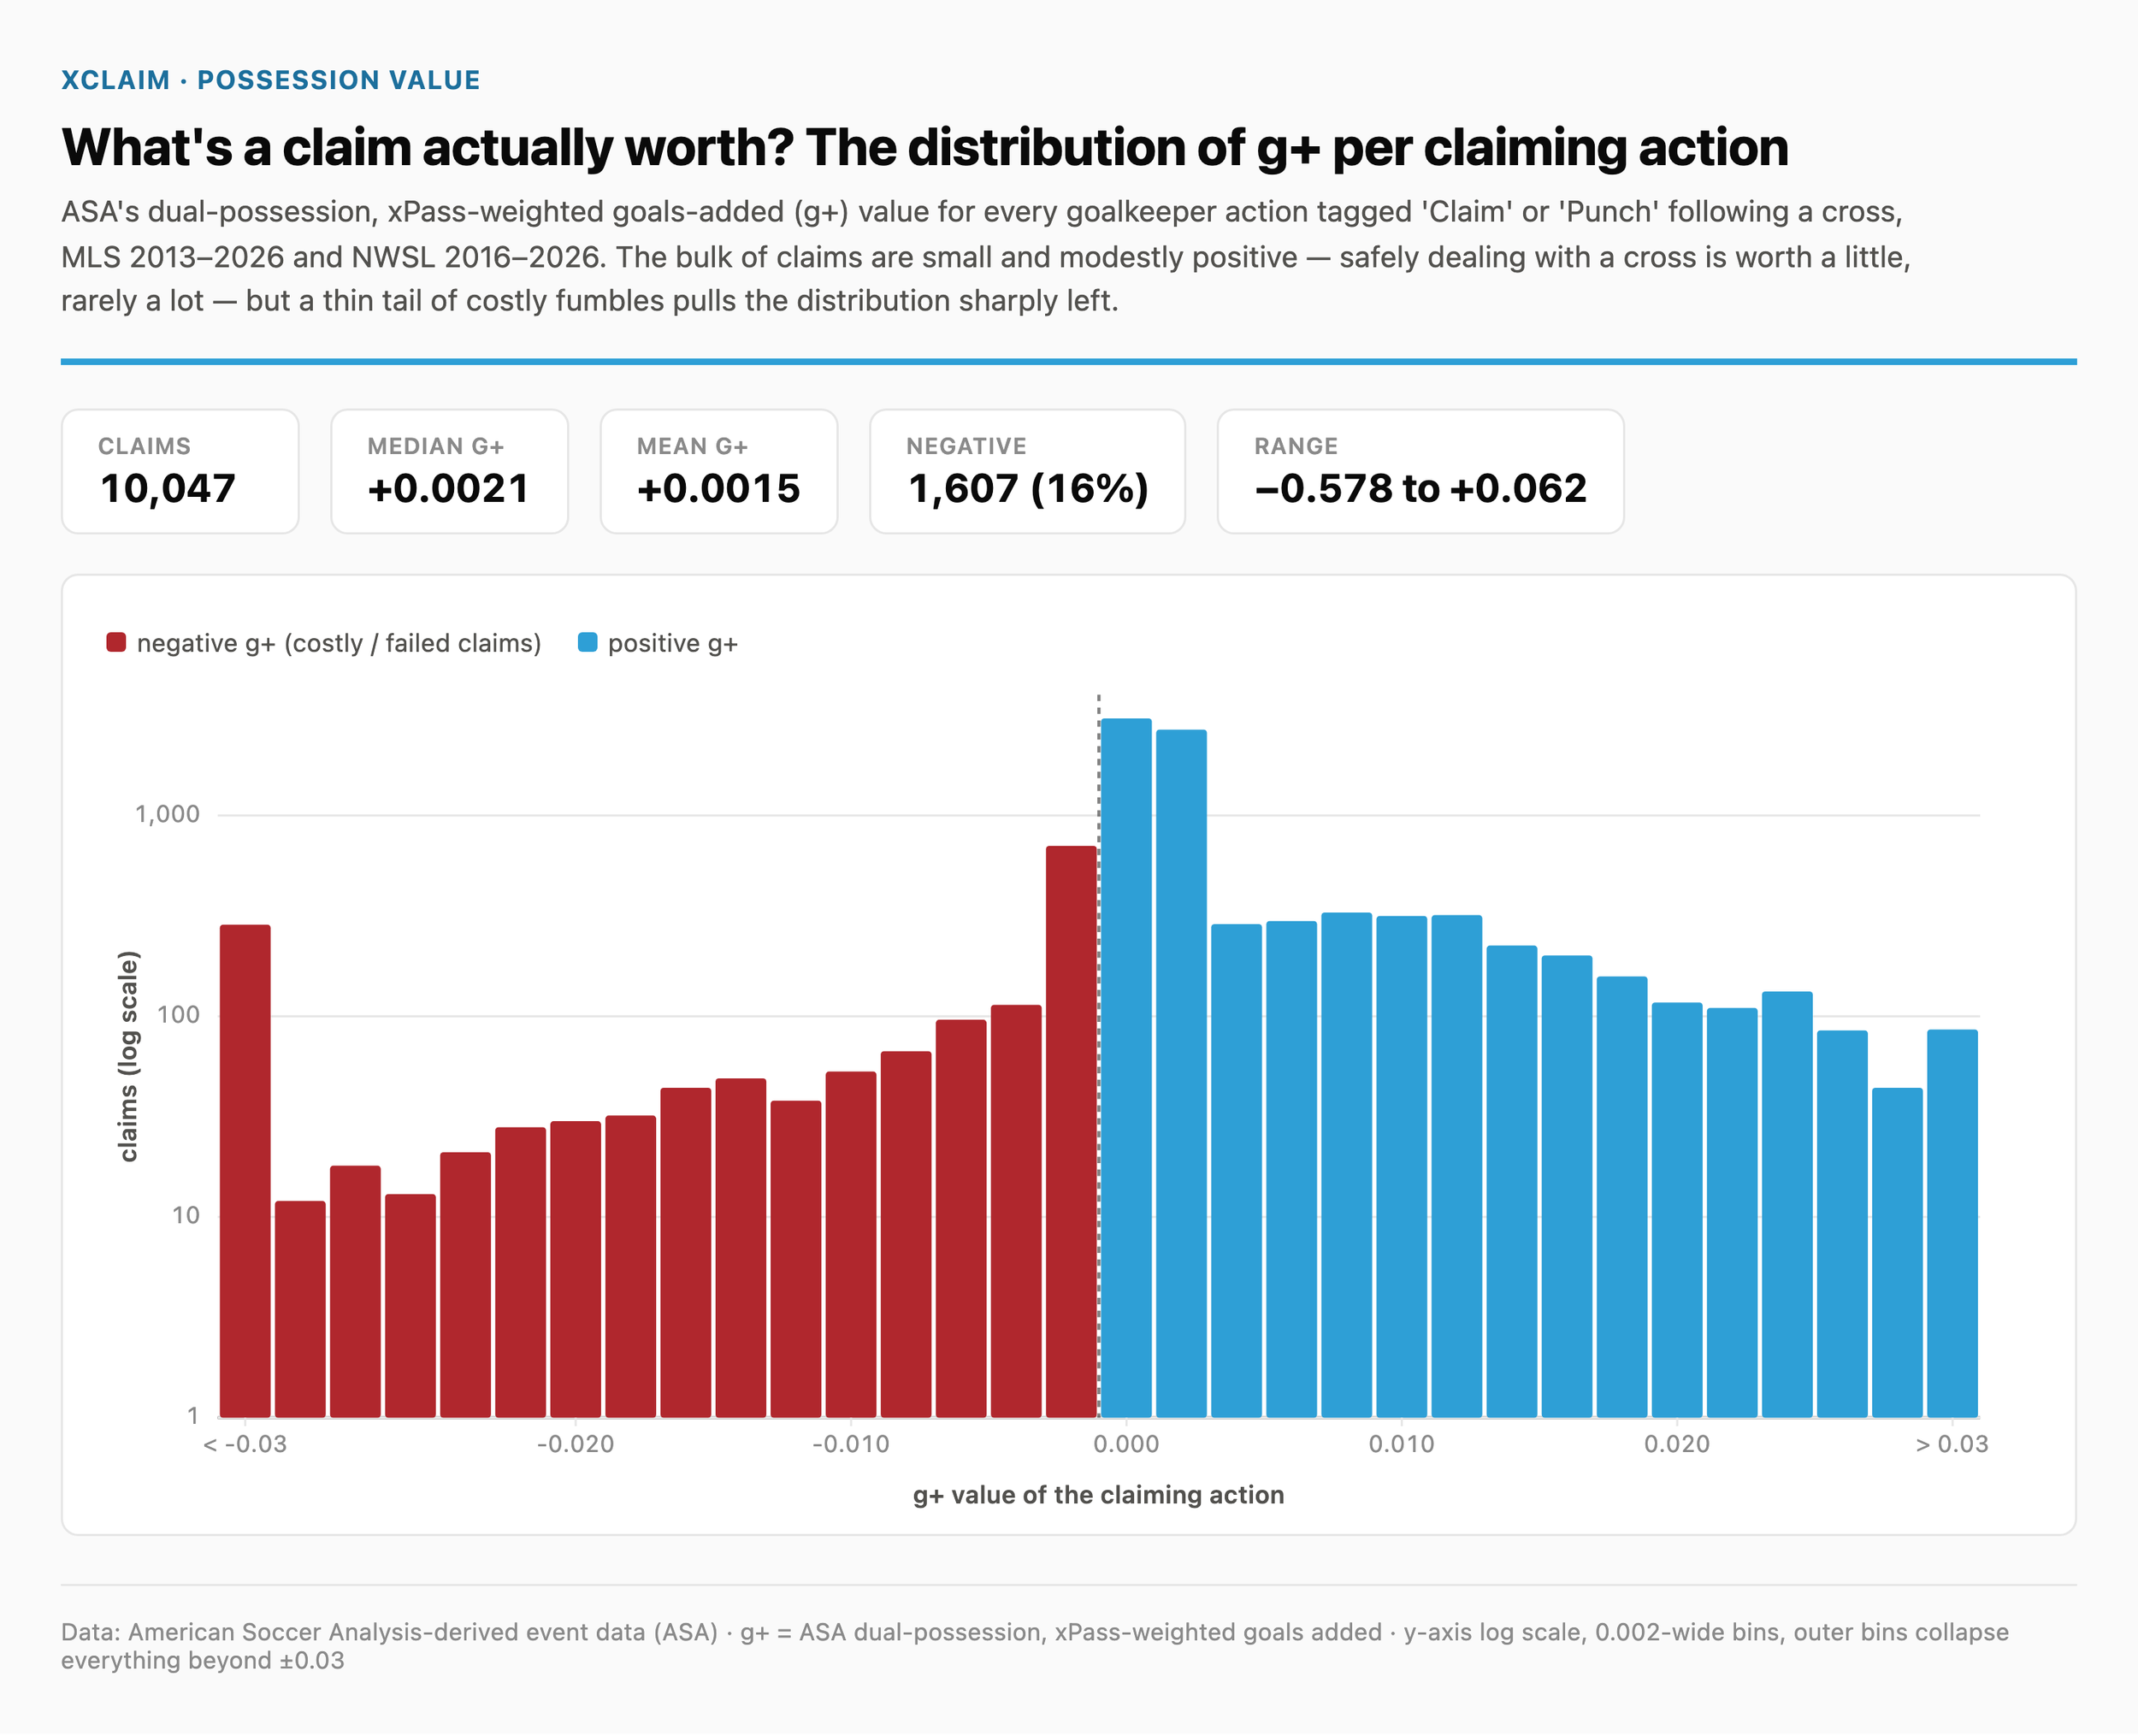
To check this phenomenon, I plotted xClaim vs Claiming g+ to see how correlated they are. They are not, this is a cross claiming activity metric. If you came for every single cross, even if it had a xClaim of 1% and you absolutely categorically should not come for that cross, you’d come out better. Specifically, of the most negative g+ claiming seasons in the ASA MLS dataset, both Dan Kennedy and Tally Hall appear, despite being top five by activity. Come out a lot, miss a lot. Claiming g+ appears to be lots of Lilliputian wins, getting negated by a failed claim resulting in a Brobdingnagian negative g+ the other way. 16% of claim attempts in the dataset have a negative g+ value, with the worst being -0.58 (and a mean of -0.007). Meanwhile, of the 84% of claims that are positive, those have a mean value of just +0.002. Interestingly, there is a small portion of successful claims that actually have a negative g+ (mostly punches that end up in the box still, which is a win for g+ and a loss for the success/fail accounting).
To try and account for this, I added a possession value layer to the model. For unclaimed crosses, we don’t actually have a g+ claiming value, so I matched every unclaimed cross to the most similar claimed crosses (by end location and the other features for crosses that ended in the box, and by initial trajectory and other features for ones that didn’t) and took the average g+ value of a claim for those crosses without a claim attempt. We can then multiply the theoretical g+ value of a claim on that cross by the xClaim probability number to get an “expected claiming g+” value.
To simplify: if the average goalkeeper faced this diet of crosses, how much claiming g+ would they generate from them? If a goalkeeper beats it, they’re probably good, if they’re behind it, they’re probably bad. Here are those tables across a goalkeeper's career. The magnitudes remain really low, but again, I think these tables largely look pretty good.
Interestingly, this is where we see our first NWSL vs MLS variance. You can see the expected claiming g+ value for every single NWSL goalkeeper here is negative, despite actually having a higher claim rate on average. This is a byproduct of a whole lot of fumbles and punched crosses that don’t clear the box. I once theorized that the optimal cross claiming strategy for all but the very best cross claiming WoSo goalies was to claim the most obvious absolute have-to’s, and choose to protect the goal on everything else. Probably more research to be done here.
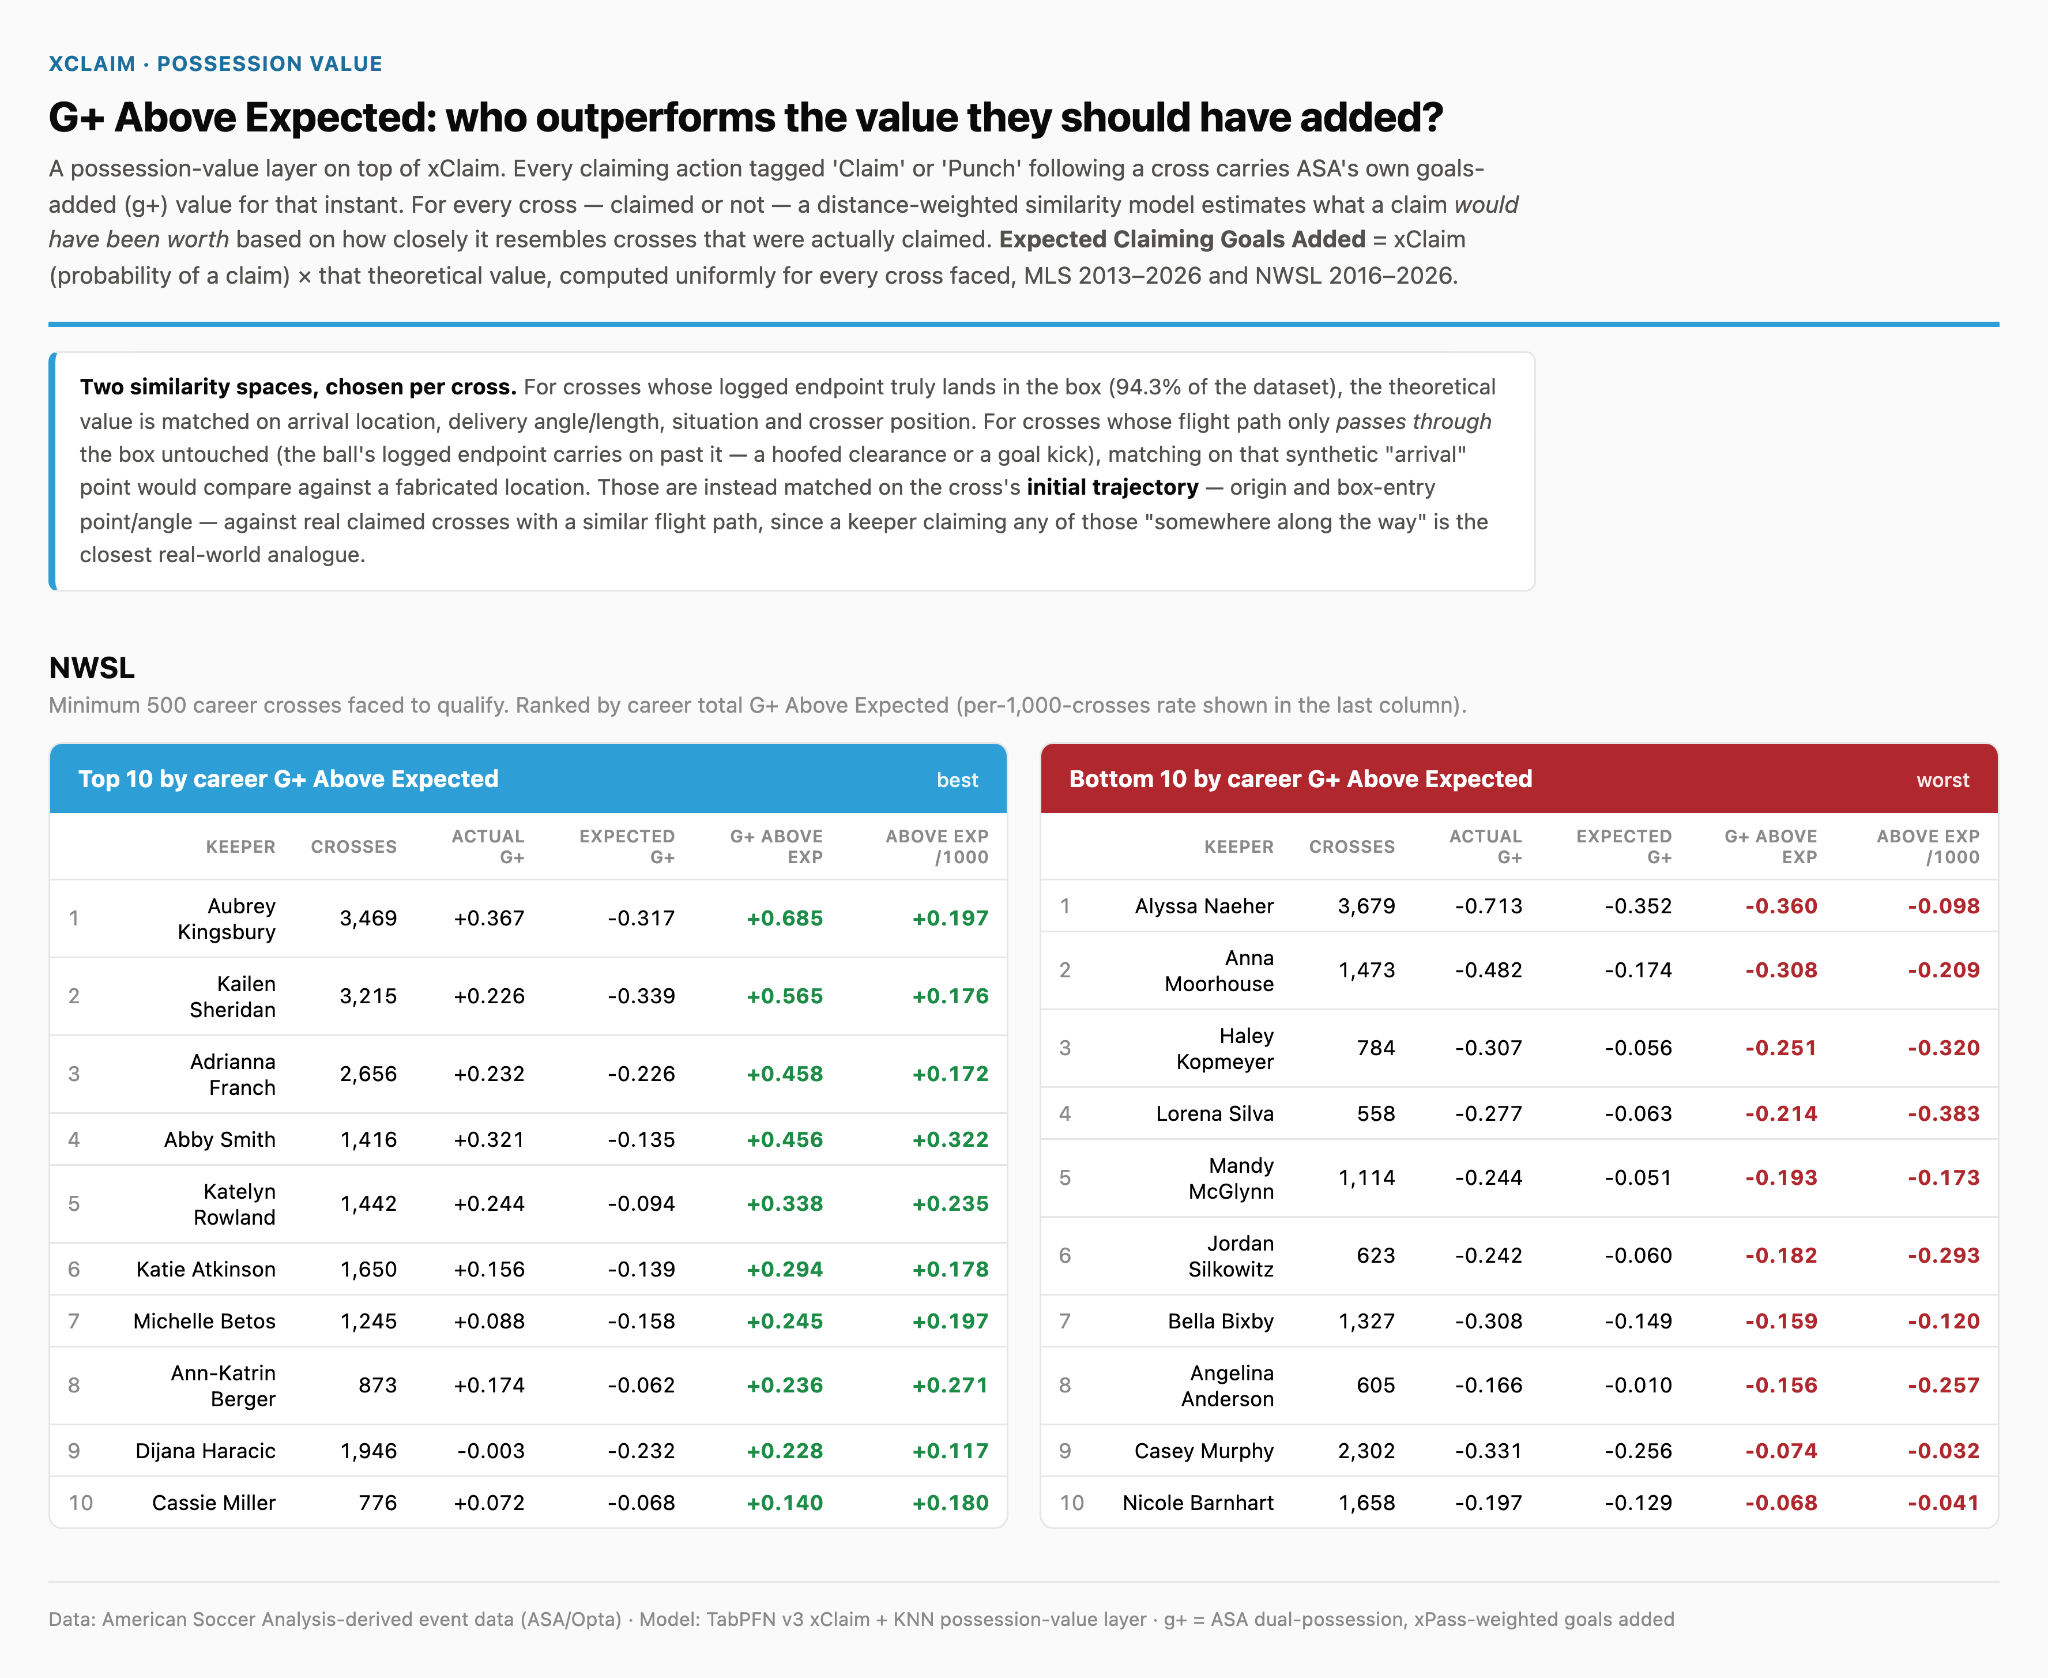
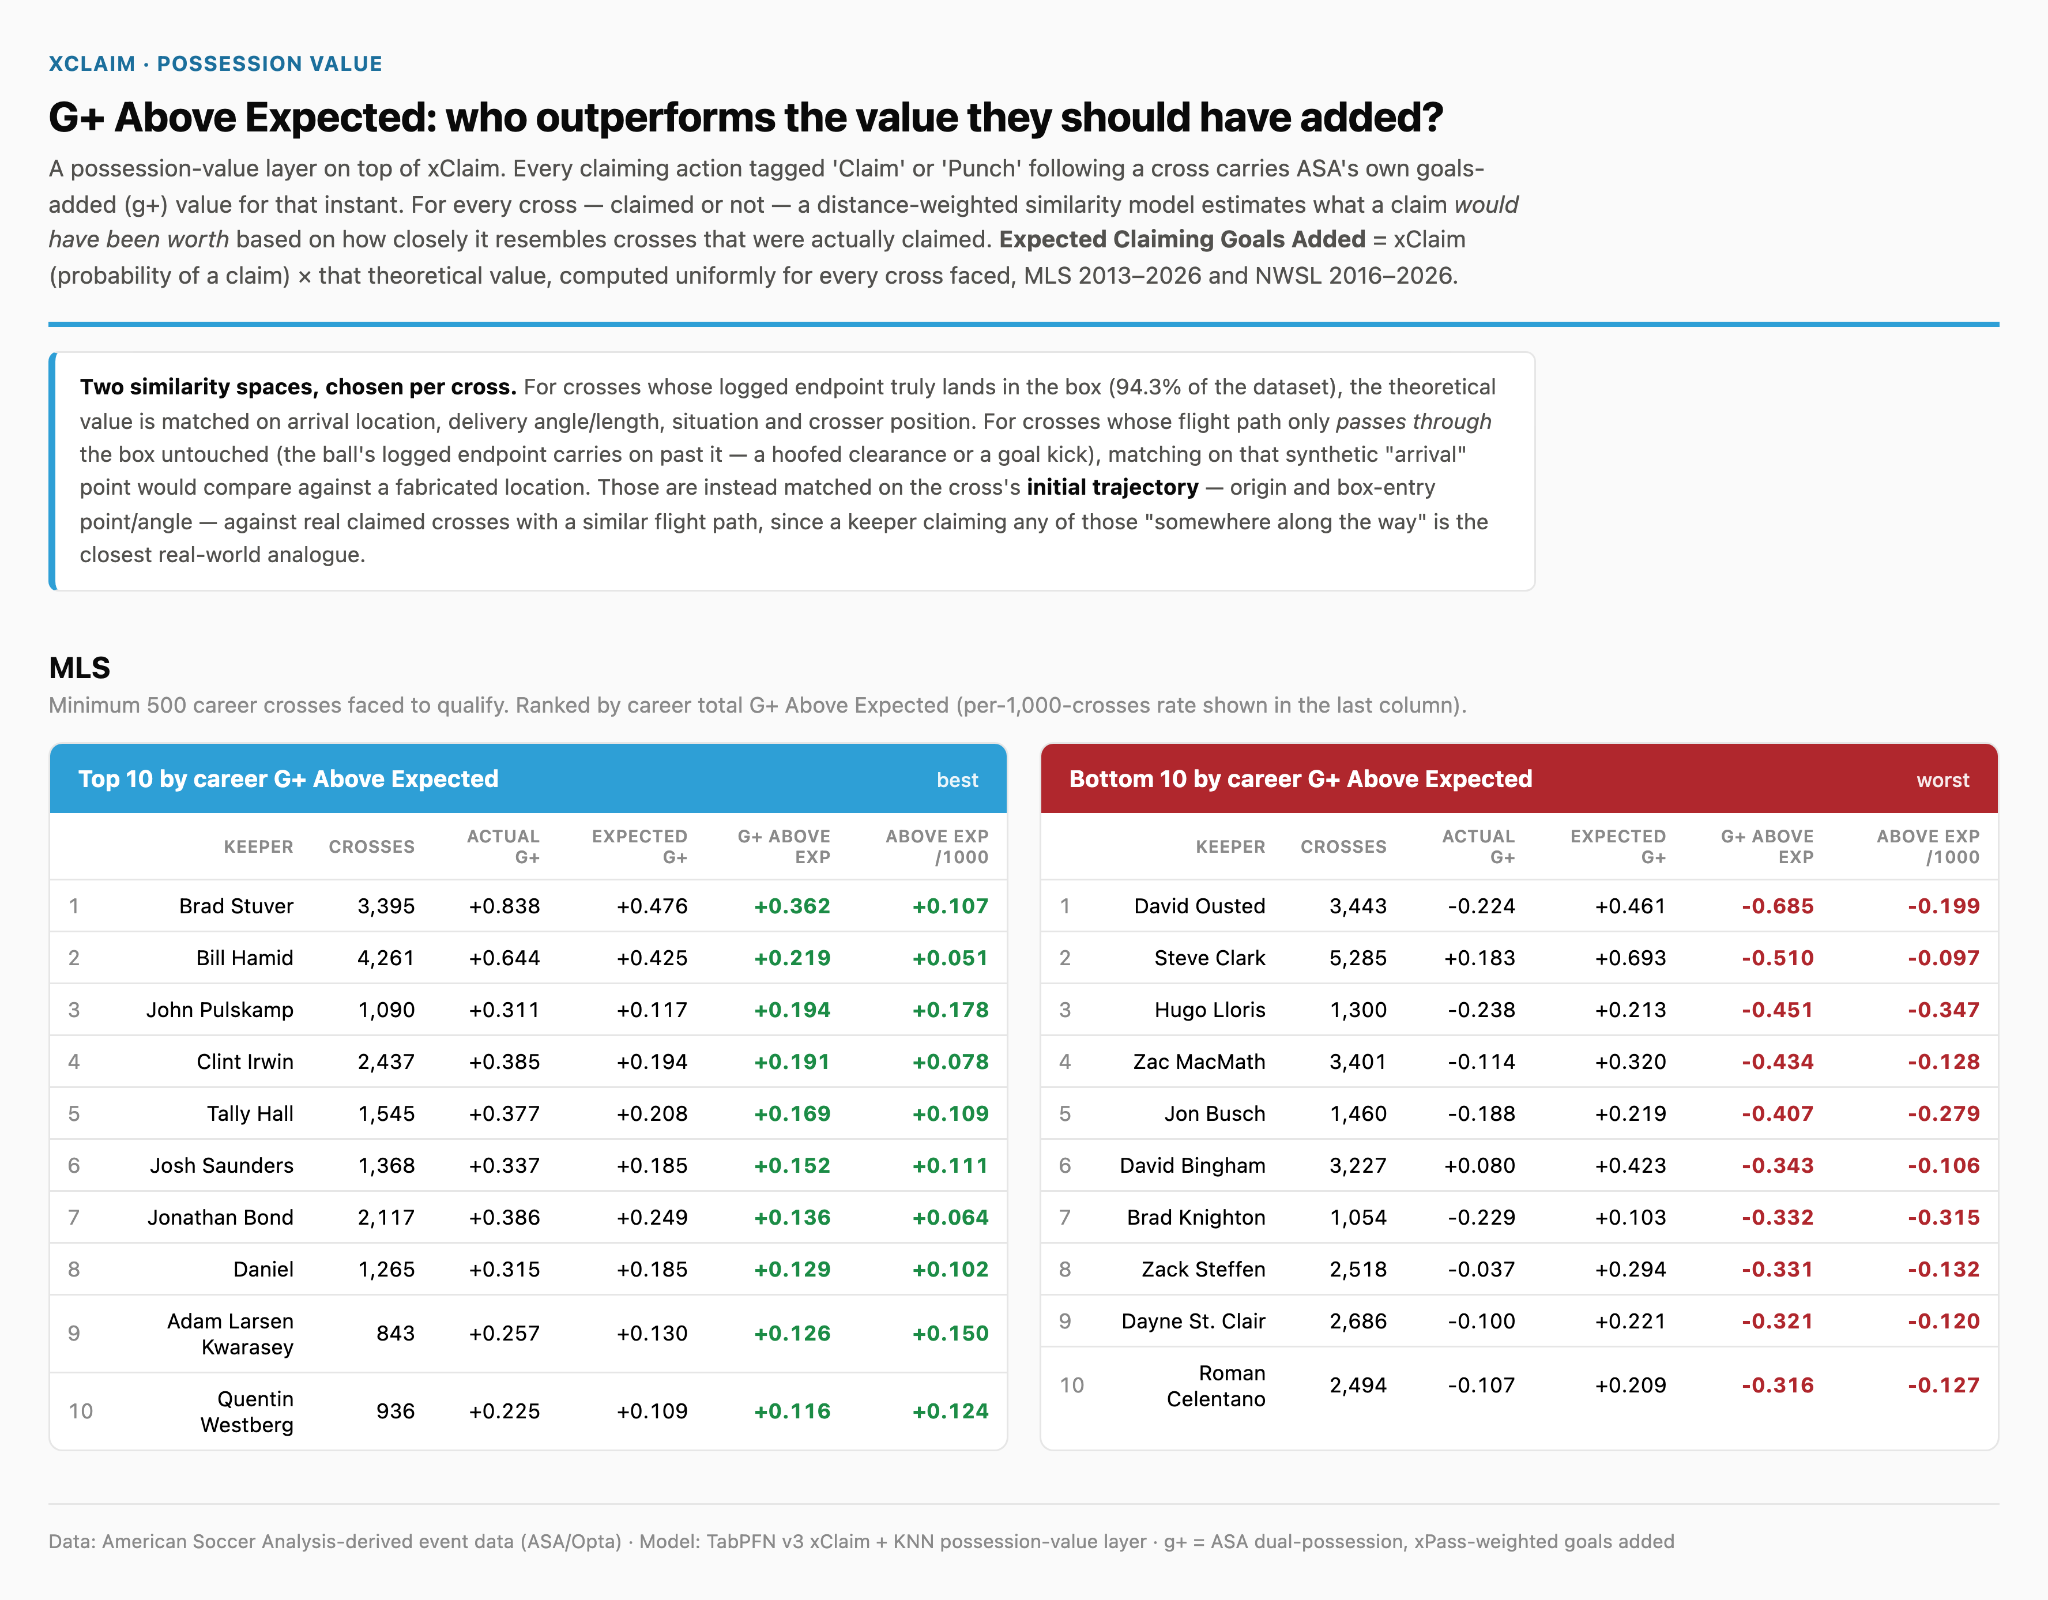
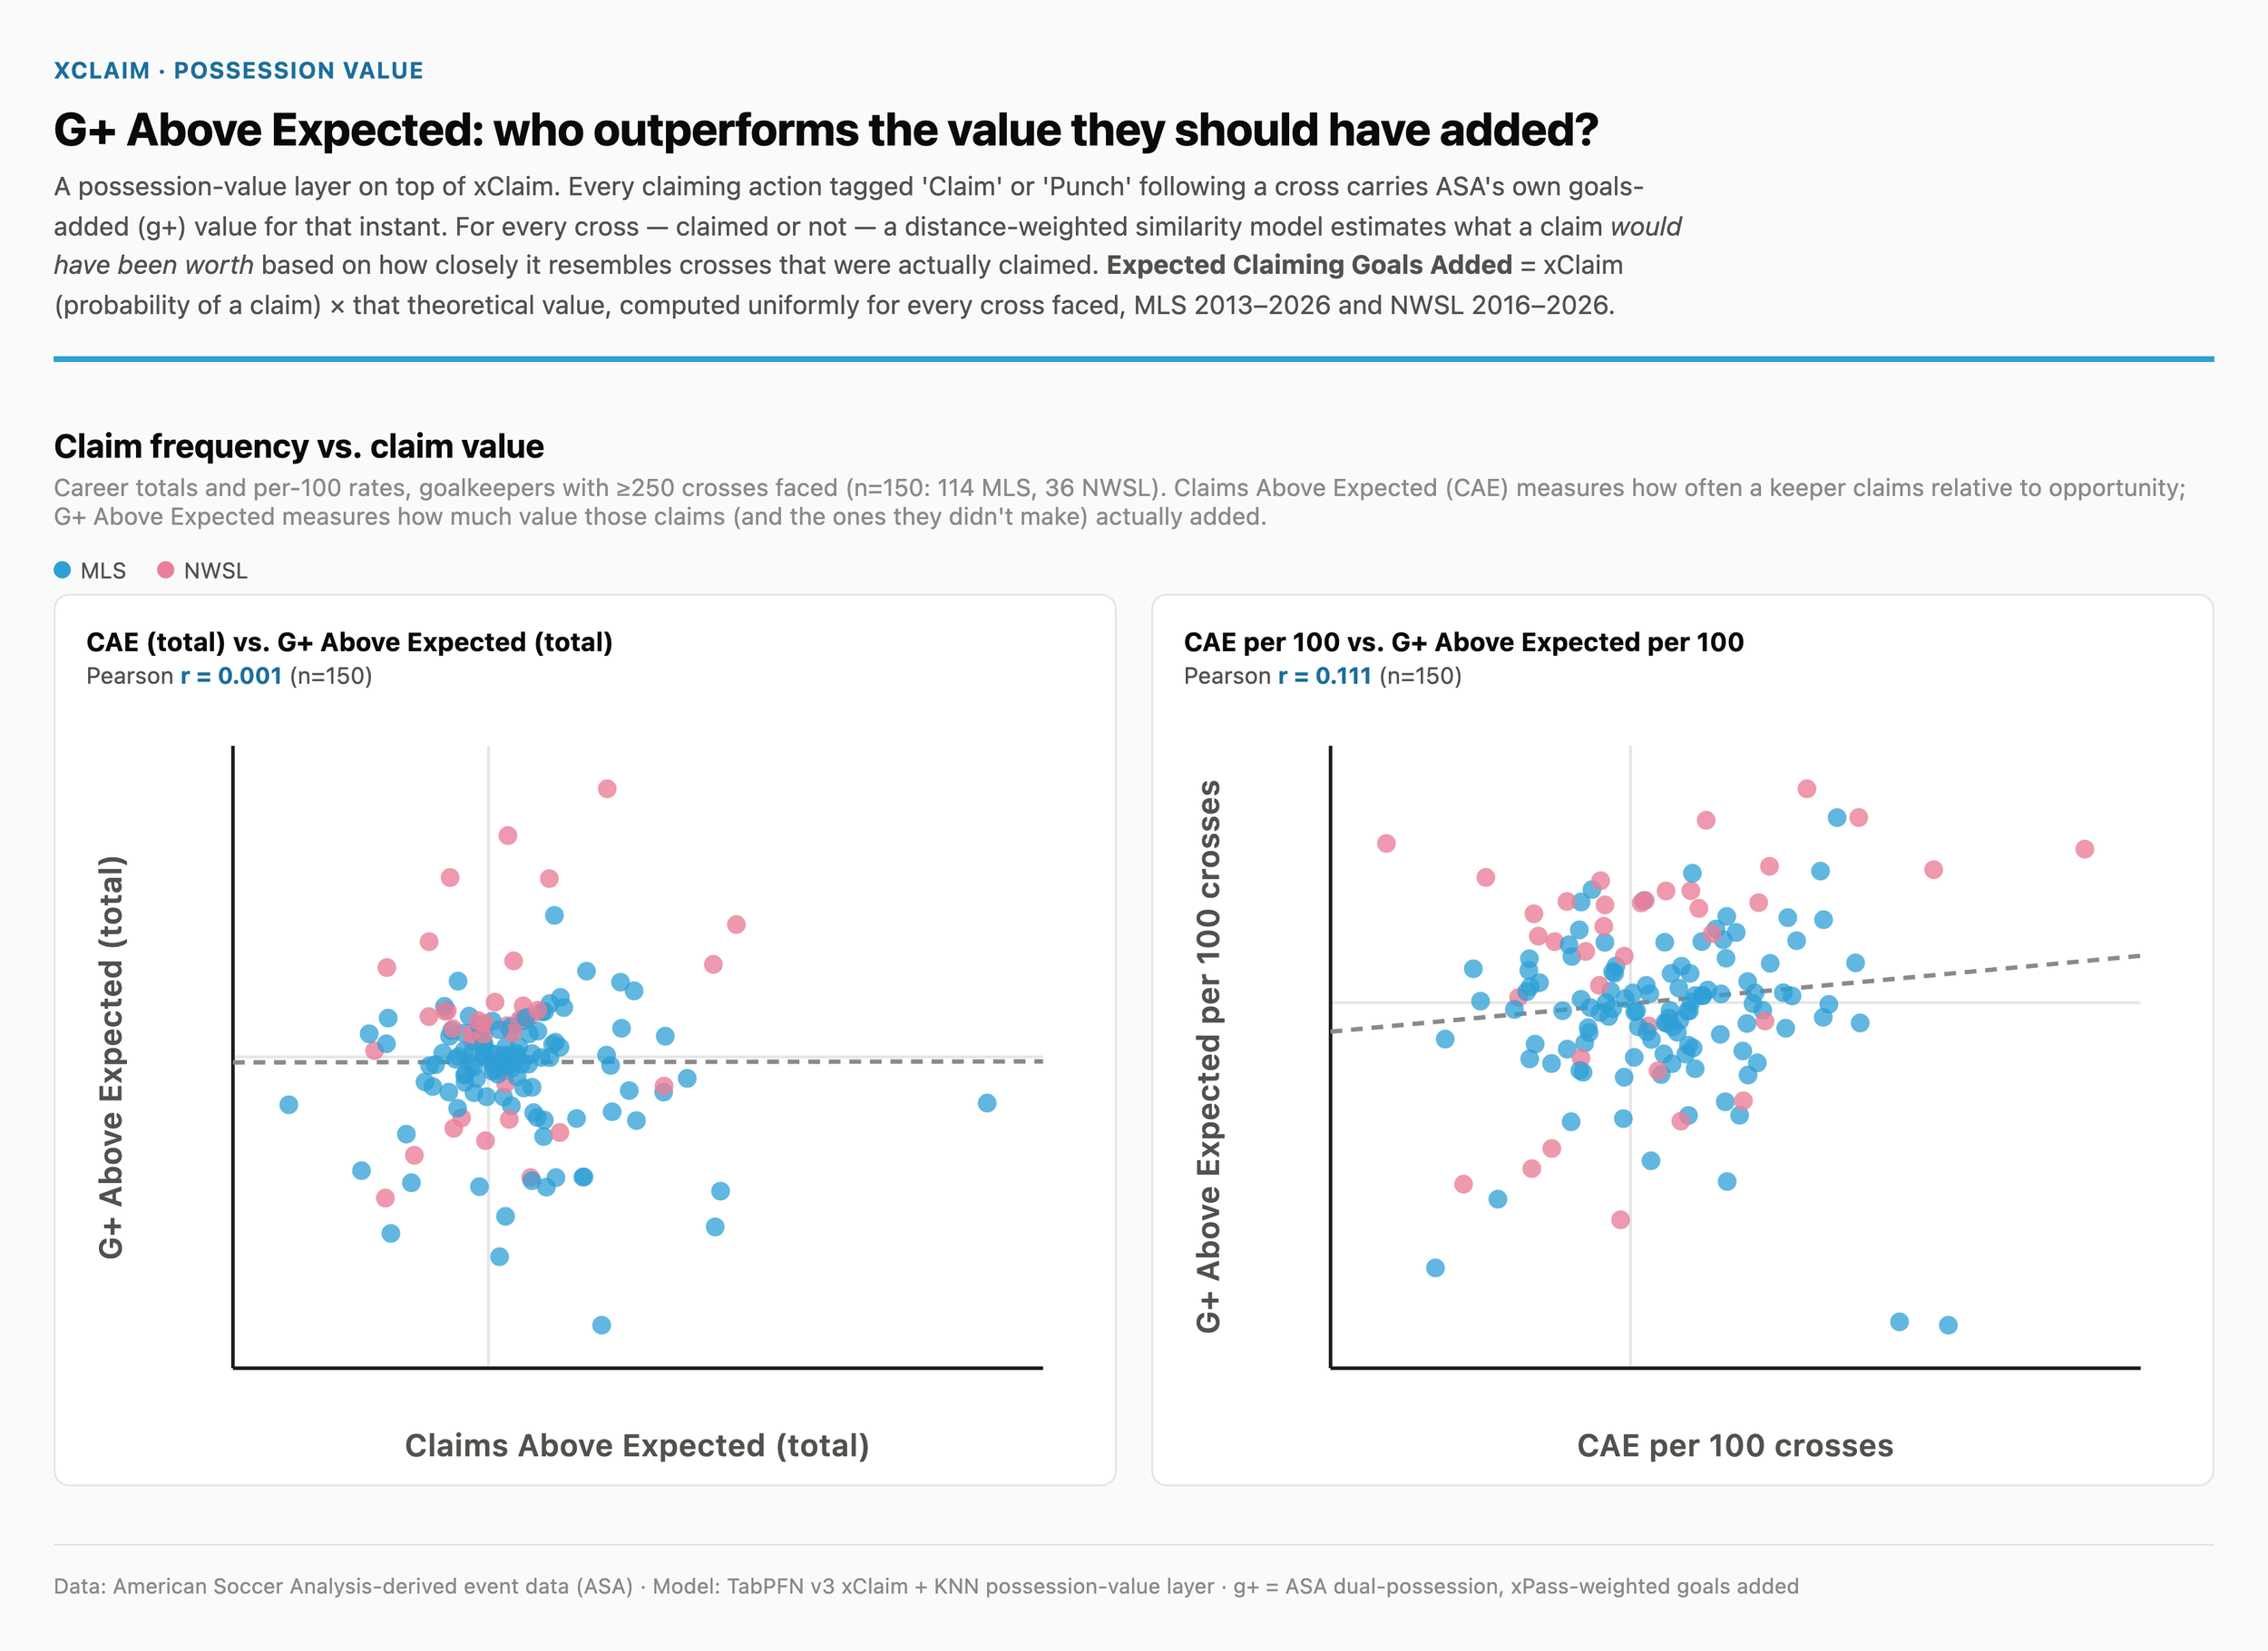
Adding the value layer provides essential information about the quality of the claiming actions attempted. Someone like Casey Murphy, who was showing up as an active claimer but most coaches and analysts I spoke to felt struggled, now pops into the bottom 10. Interestingly, Quentin Westberg is someone who had unbelievable positioning metrics on Statsbomb’s data long ago, so it’s somewhat unsurprising to see him just be a quietly smart dude. If you want to go find your goalkeeper, there’s a play-withable table at the very bottom of the article.
One thing I would like to extend this work towards is to add a “decision making” component. You could theoretically layer an xClaim % and the g+ of a successful claim against the g+ of a failed claim, 1-xClaim%, and the xG of any shot you’d be giving up and give a thumbs up, thumbs down claim attempt decision.
The Insights - Crossers
Of course, there is an opposite side to the goalkeeper coin. To start, here’s an interactive map of xClaim values by the end point of the cross, the origin of the cross, and one where you can click a zone and see the xClaim’s for the corresponding endpoints. What do you notice? (If the chart doesn’t work for you on mobile, you can go here).
To me, there are a few obvious trends. 1) Don’t cross it to the goalie. Great start, thank you for the information Kieran. However, there are nice zones sort of in line with each post where the xClaim drops precipitously, but the xG of a header wouldn’t drop as much as you think. These were always brutal to play as a goalkeeper. A ball comes in with a lot of pace and the striker can help it on, guiding it to the back post, or snap it towards the near post. But because it’s whipped into that near post zone, you mostly have no chance to come.
2) Target the back post. xClaim skews near post over far post. There is almost certainly a “survivor” bias of sorts here, where the only crosses that make it to the back post have a trajectory such that they couldn’t be claimed before this (someone referred to this as a claim shadow when providing feedback, which I quite liked), but it also makes some sense intuitively. Keepers are oriented between the ball and the goal, if you draw a line from the ball to both posts, the goalkeeper will almost always be situated more closely to the near post line, even if they shouldn’t be. To the astute World Cup watchers among you, you can think of the Belgium header goal against the US. Matt Turner is “dragged” to the near post, where he can’t really impact the play, making the stood up cross to the back post an excellent option.
3) Work the space. Long, deep crosses are not worth it, but deep stuck in the corner flag crosses aren’t worth it either. The sweet spot is 15-25 yards out “early” cross, either whipped near post 8-10 yards out, or curled to the back post.
4) Cutbacks are God. The single most important model feature is how close the trajectory of the cross is to the middle of the goal. The second most important model feature is how close the cross ends to goal. The third is the vertical distance travelled by the cross. Cutbacks: don’t come that close to the goal, don’t end that close to the goal, don’t travel a long distance vertically. But all of those things happen VERY close to the goal in shot terms. Very low chance of goalkeeper involvement, really good shot generated.
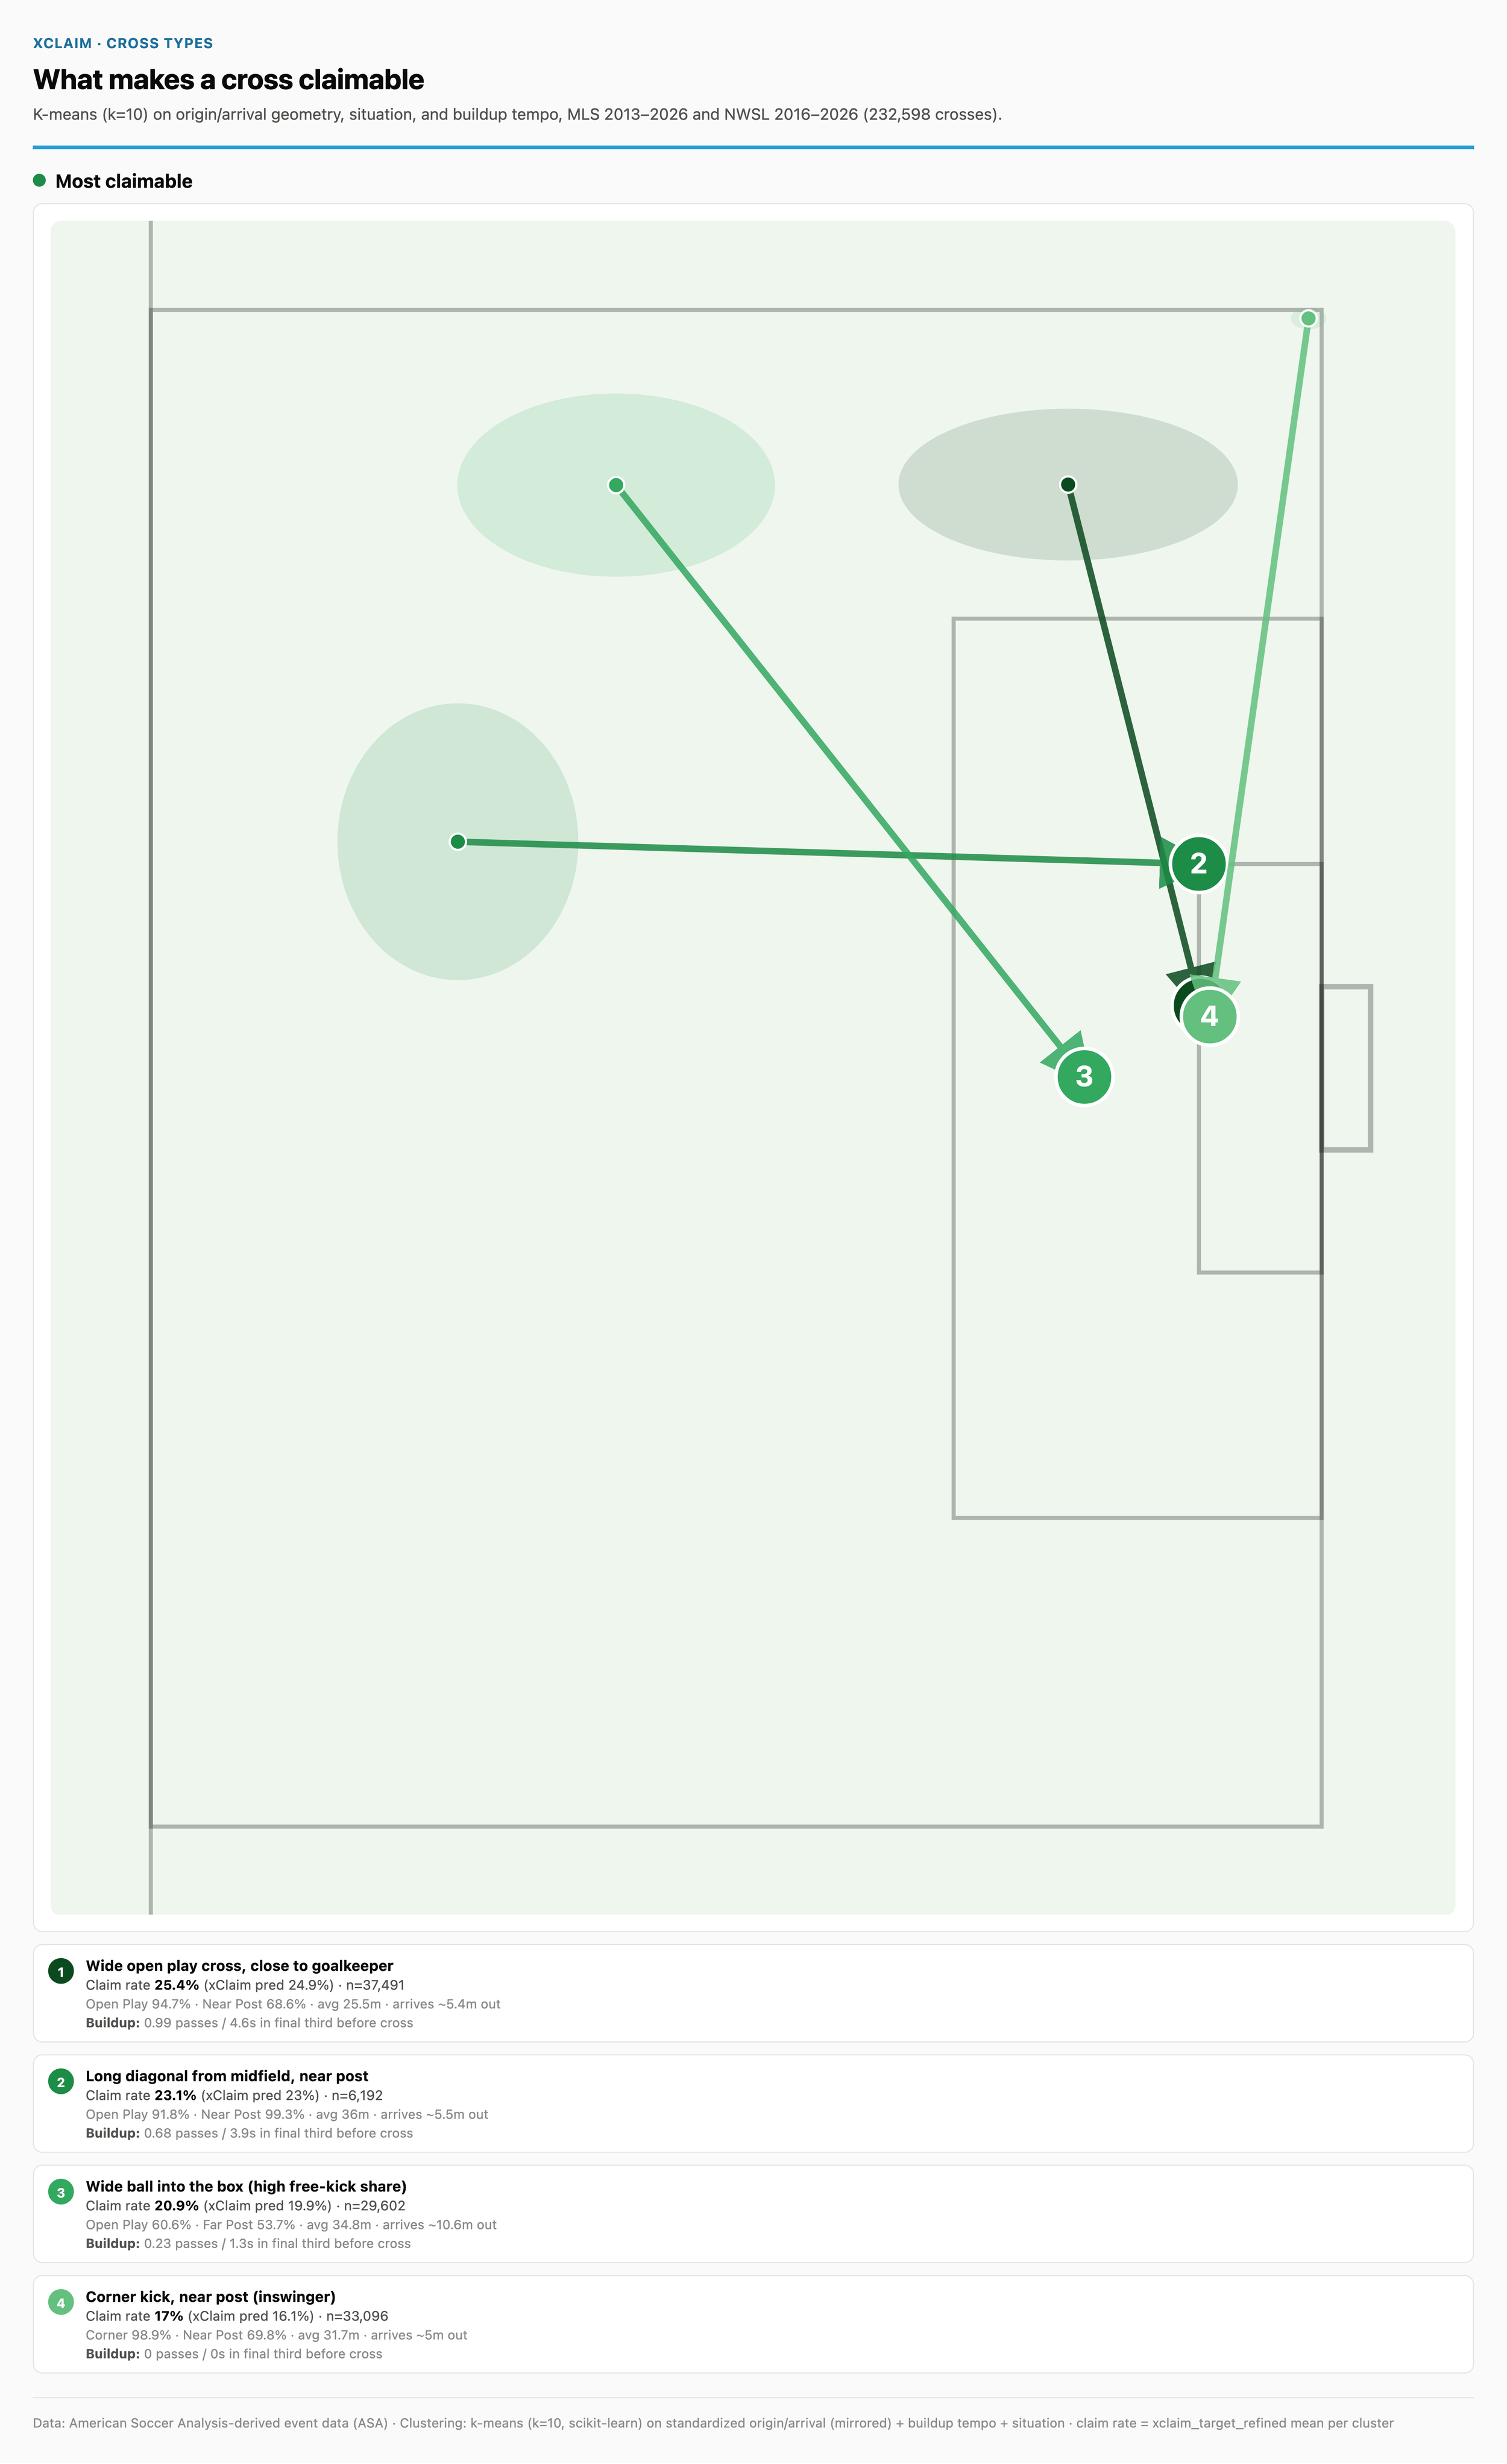
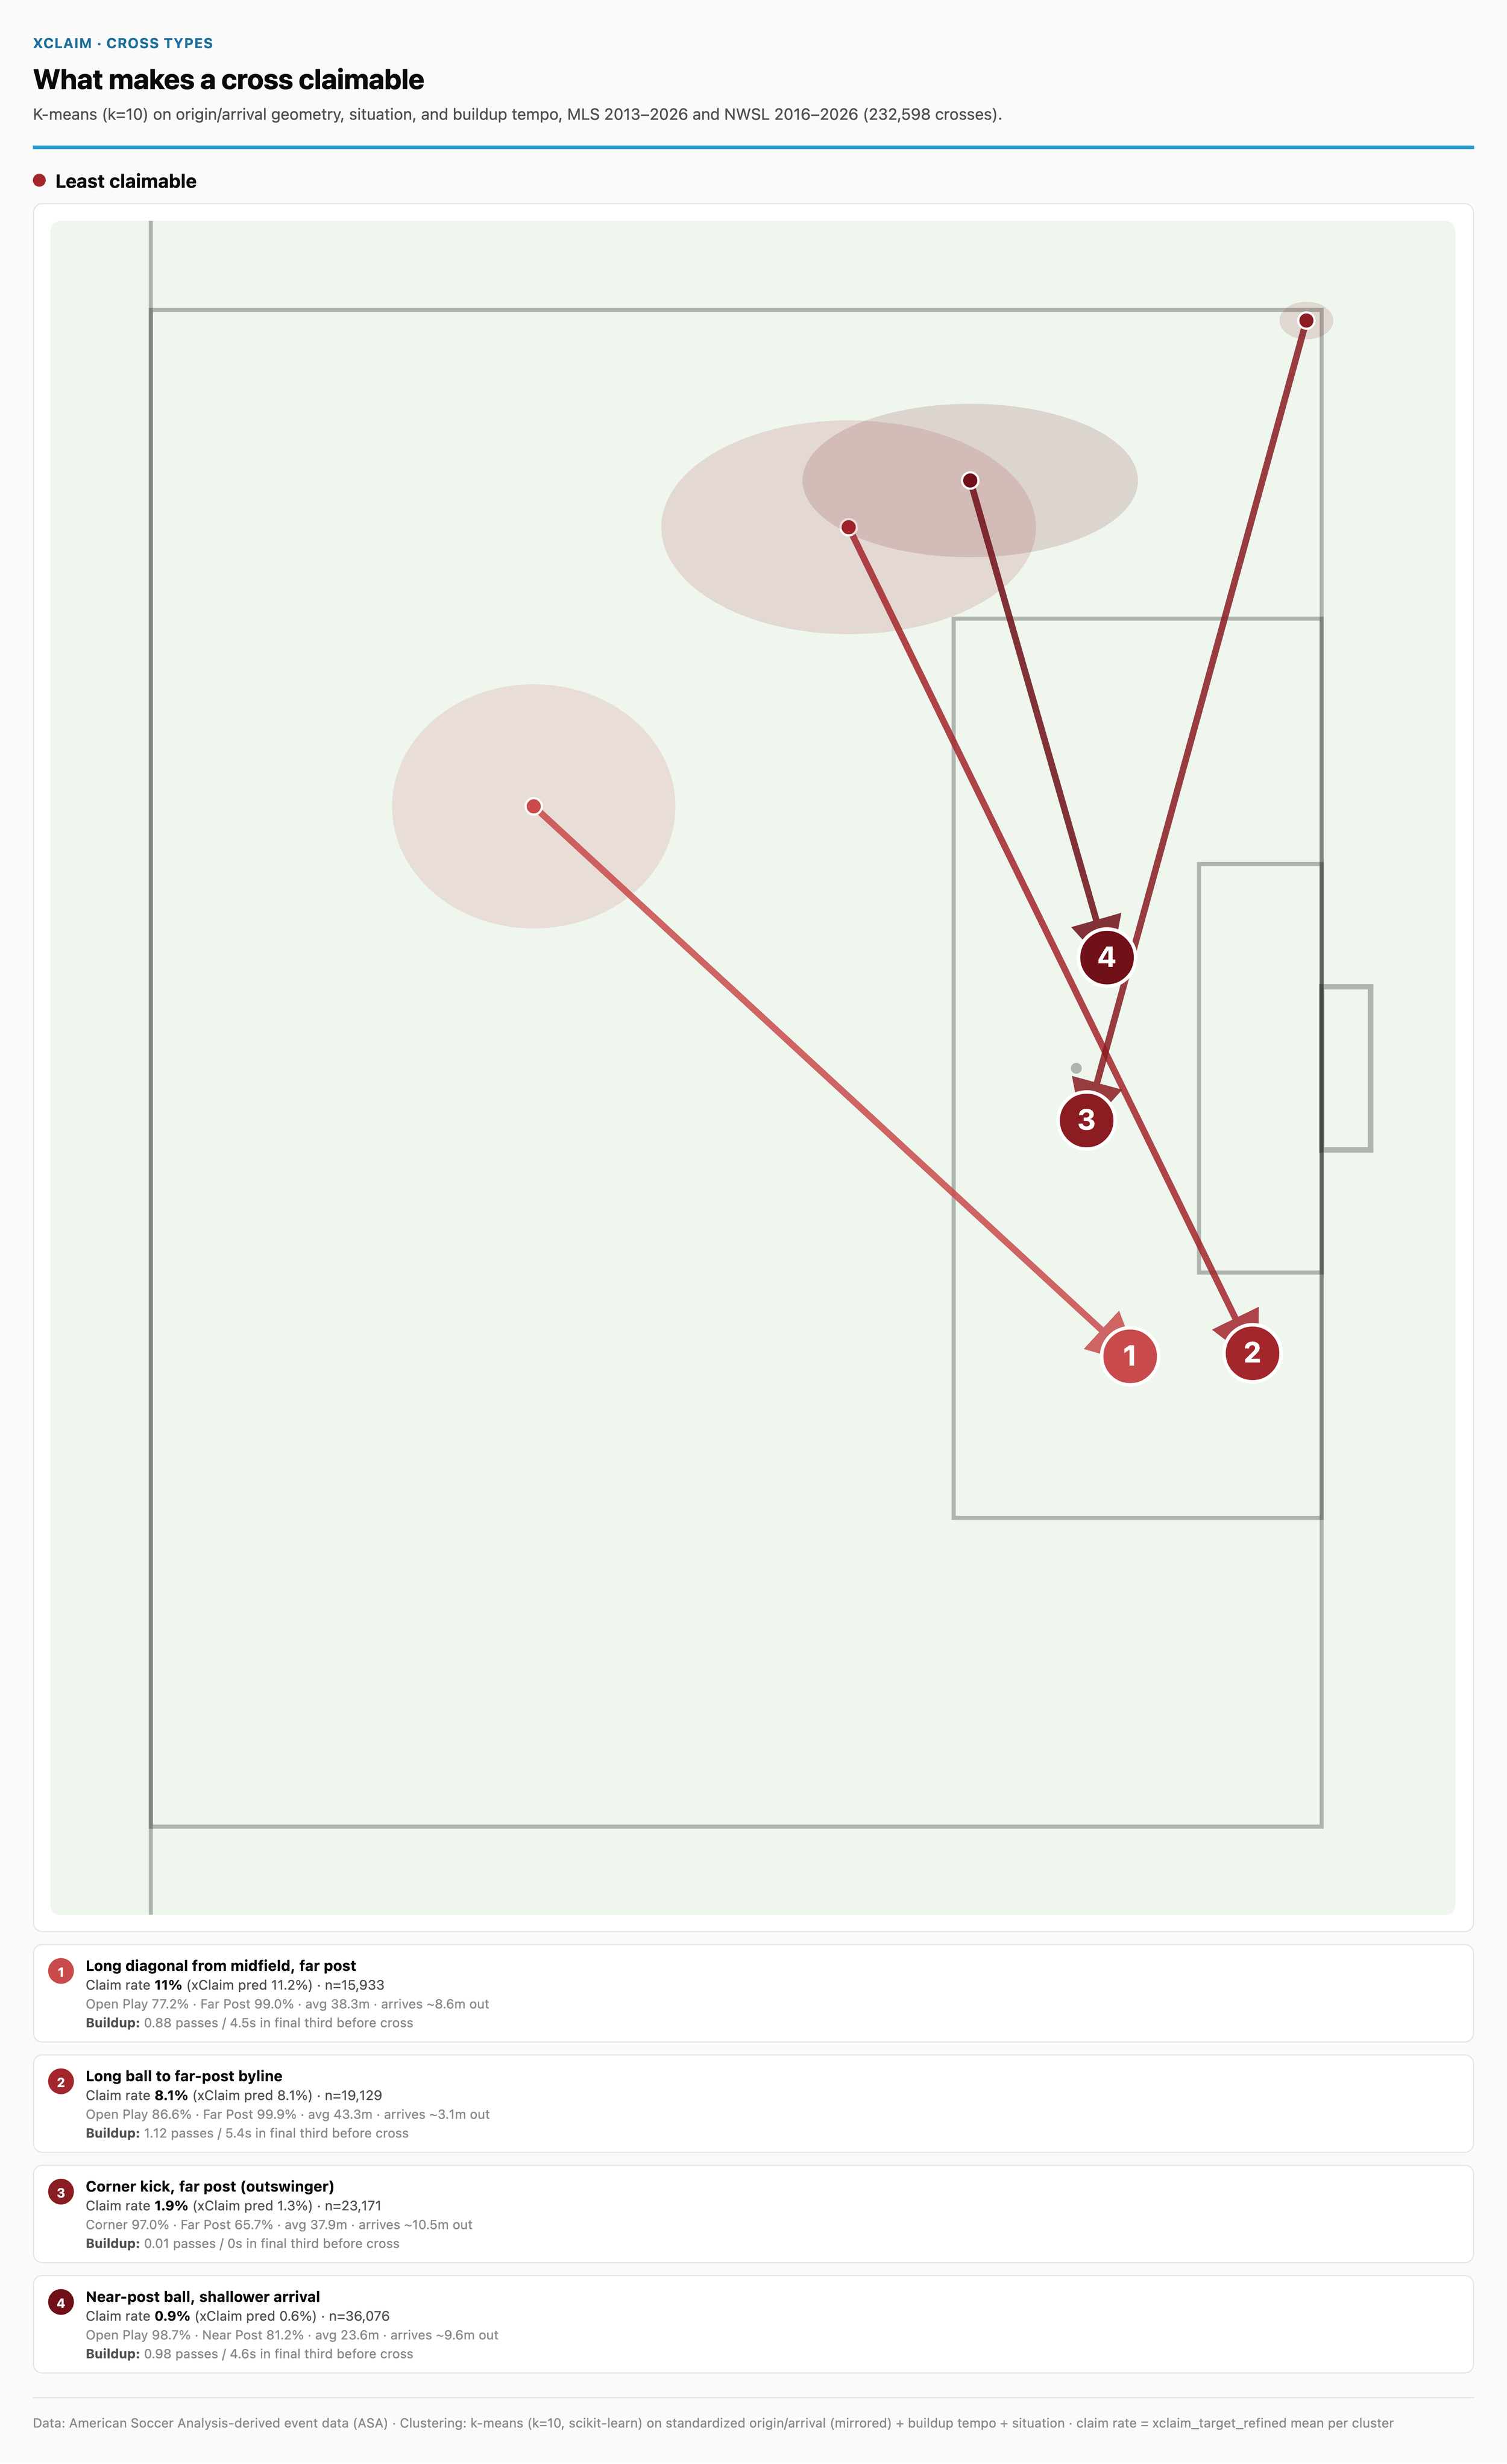
It’s important to note, again, this is just the goalkeeper claim rate. For example, I clustered all the crosses and got four very claimable clusters and four very unclaimable cross clusters. One of the least claimable is a high out swinging corner to the back post. That’s probably not a very good cross, but the goalkeeper definitely isn’t getting it.
Things I Didn’t Do or Did Poorly
There probably are some insights to look at the connection between team defensive performance and the kinds of crosses they do/do not allow, as well as what they ask of goalkeepers. I’ve long believed that cross claiming is as much a team/coach style thing as it is a player thing, when I watched Antonio Conte’s Chelsea pack the middle of the pitch with as many horrible horrible Easter Island Statue sized human beings as possible and force teams into lobbing wide, deep crosses into Thibaut Courtois’ gaping maw.
Similarly, I know saying that adding tracking data to a metric would improve it is the thing we’ve said for 10 years, but it actually very much would here. Specifically, numbers in the box, does the trajectory pass an attacker? A defender? The actual trajectory of the ball! Height, curve. So much you could add.
When we’ve done stuff like goals subtracted (g-) in the past, we let set pieces be their own weird and special thing. For this analysis, I bundled corners and freekicks into the regular xClaim model, but I’m quite confident that’s not the best approach. They’re such a unique game within a game thing that I can imagine a separate set piece model would perform better.
Ugly Technical Details
I specifically chose to try this with TabPFN because of the work from the Leuven group showing that tabularized foundation models can outperform traditional xG models with much smaller datasets. TabPFN isn't trained the way gradient-boosted trees are — it's a pretrained foundation model for tabular data that does in-context learning: at inference time it treats the training set as a context window and reasons over it directly, roughly analogous to how an LLM conditions on a prompt. v2.5 only trains off of 50k rows, but v3.0 goes up to 1M, we tried both. I also tried TabFM, the current leader in the foundation model test arena, but it didn’t perform better and took 3-5x more time to train.
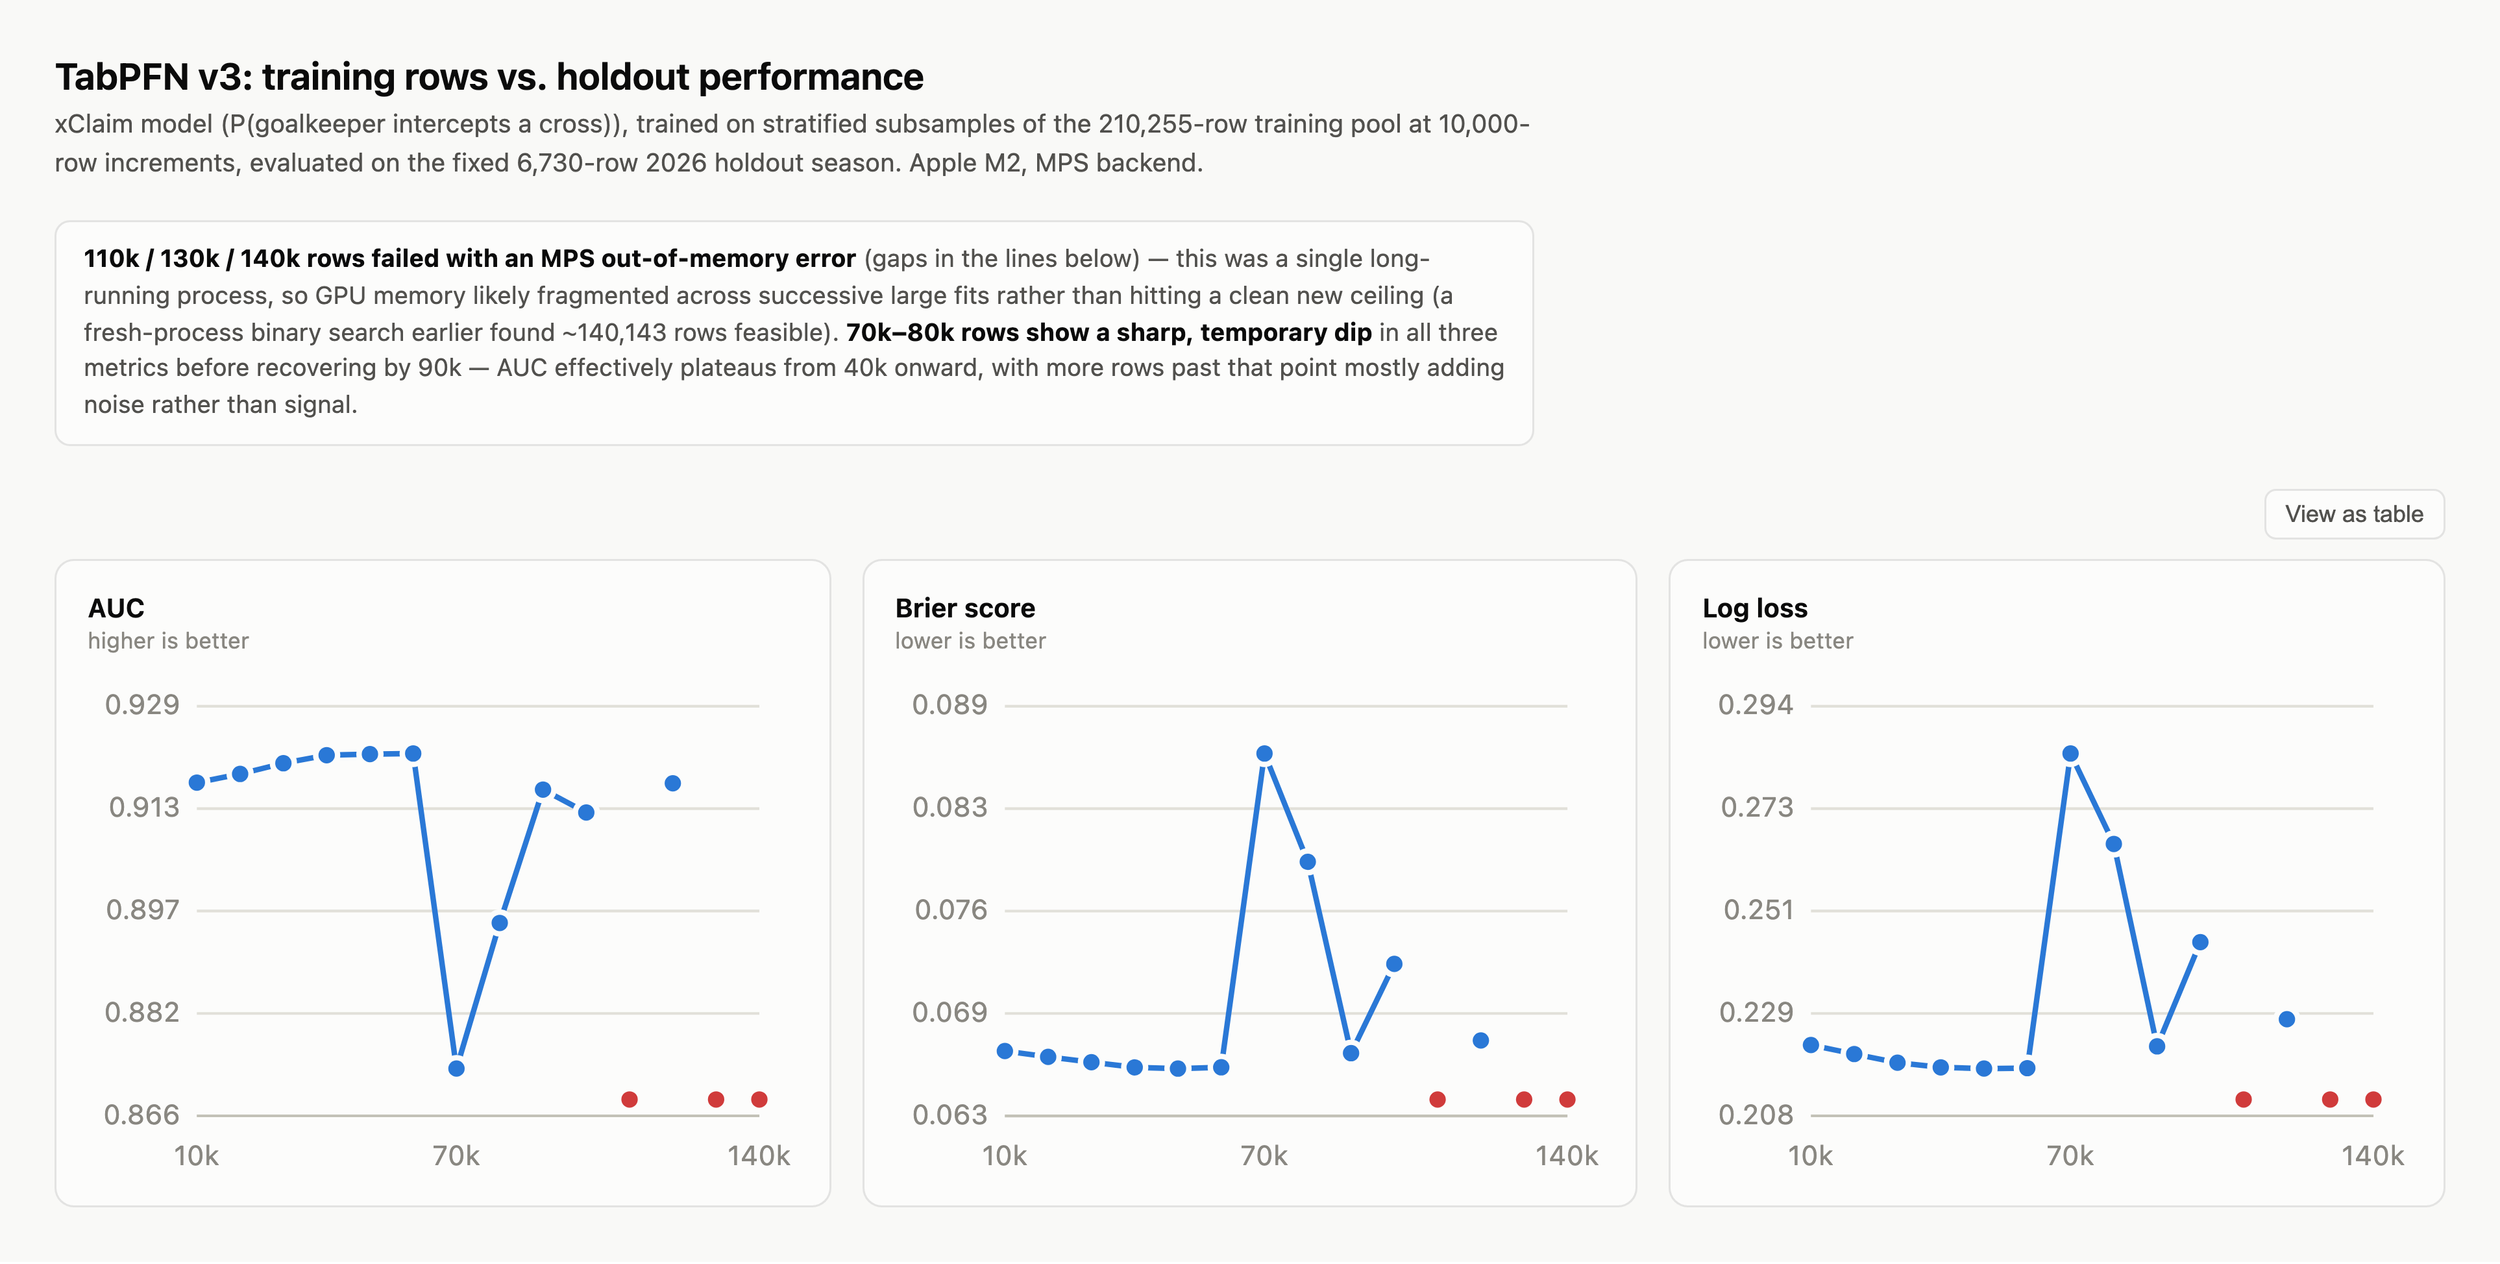
Theoretically, more training data should make these models better, we had 230k crosses across the entire dataset here. But I ran into two specific limitations: First, hardware. Fitting TabPFN on the full training set continually threw out of memory errors on my Macbook M2 Pro when I trained anything larger than 55k rows. I could get up to 140k rows a few times, but it was a coin flip whether it’d fail, and it actually had worse model statistics. Because TabPFN attends over its entire context for every prediction, a 120k-row sample spanning 12 seasons and 2 leagues turned out to be problematic. The second limitation was just time. 50k rows was a 10 minute prediction time, whereas 120k was about an hour.
Goalkeeper Claiming Tables
If the table doesn’t work on mobile, you can go here.