

Replication Project-ish: Projecting MLS Performance based on MLS Next Pro Data
/In 2022, Daniel Dinsdale and Joe Gallagher of Stats Perform (the artist formerly known as Opta) released an arXiv of a paper titled “Transfer Portal: Accurately Forecasting the Impact of a Player Transfer in Soccer”. The paper is a worthwhile read, but the idea can sort of be summed up as the three approaches.
Identify how the player is currently doing on a per 90’ basis, for the metrics you care about.
Identify how their team and league fits into the global hierarchy, in relation to other teams and leagues.
For players with insufficient data, weight the average of their small data sample and some prior for the league/age/position etc.
Then take all those things, stick it in some neural networks, and try to predict the impact if that player moved from team A to team B. And it works! It’s a pretty good predictor of how players do when they move clubs, reducing mean squared error by 50% compared to assuming their performance translated over one-to-one. This is a cool result, and league translation/transfer projection is an extremely difficult task.
Where my brain went when I read this paper six years ago was, wow, this would be a great approach to trying to figure out how good young players might be. Three months after this, MLS Next Pro started its inaugural season, in March of 2022. While Opta’s work on this was based on some 26,000 samples and 2600 transfers, after four seasons of MLS Next Pro we certainly don’t have 2600 players graduating to their first team, but we might have enough to try.
The Metrics
As always, I’ll include the gory, technical details of the model at the bottom if that’s your jam, but for now, we talk ball.
I started with a lot of the same event data driven metrics, things like xG, shots, progressive passes, progressive carries etc. But I also included all of the component parts of goals added (g+), as it felt it would be insightful.
The dataset has approximately 2800 MLSNP players total, with 1800 clearing five 90’s, and 1200 clearing 1000 minutes. Given the generally lower minutes totals of MLSNP players, 1000 minutes was the threshold where players are fully accounted for their own production, rather than blended with the league average prior for position and season. Of those 2800, 437 of them register as a detected MLSNP-to-MLS transition, 197 are trainable (> five 90’s), and 142 have completed a full 1,000-minute first-team window. That feels like a low number to me, but it’s approximately 15 players per MLS team, and when you consider Montreal, DC, and San Diego don’t have MLSNP programs, along with St. Louis, Charlotte, Austin, Miami, and Nashville not really having academy classes come through yet, perhaps it’s to be expected.
Projection Features
The model features to project future performance fall into two, quite large buckets.
The first is related to the player themselves. What is their performance across the last 1000 minutes? How much soccer have they played in total? Similarly, some biographical data, what position does the player play, how old are they, how often they play, are included. Age comes up a lot, given that MLSNP has 15 year olds playing with 25 year olds, so there are some age curving effects on all the metrics in the set. It’s somewhat archaic, but I also feel strongly that size matters for kids making the leap, so I included height and a size proxy through age (and it seems to help!).
The second bucket has to do with the circumstances of the first team jump. How good is the MLSNP team relative to the league, how good is the MLS team relative to the league? If you go from Austin II stomping Next Pro to drowning in MLS next to Nicolas Dubersarsky, it’s probably going to impact your metrics. Similarly, team styles and how similar they are between reserve team and first team. How much do they press, and pass the ball progressively? Again, it is easy to see how this would impact league translation. Also included is the timing of the player making the jump (specifically by looking at days since their last game). A young player being promoted in preseason, training with the first team with a clear role in mind, will presumably look quite different than a kid who played Chattanooga on Wednesday and is in Portland on Saturday playing 20 minutes after SKC took another red card.
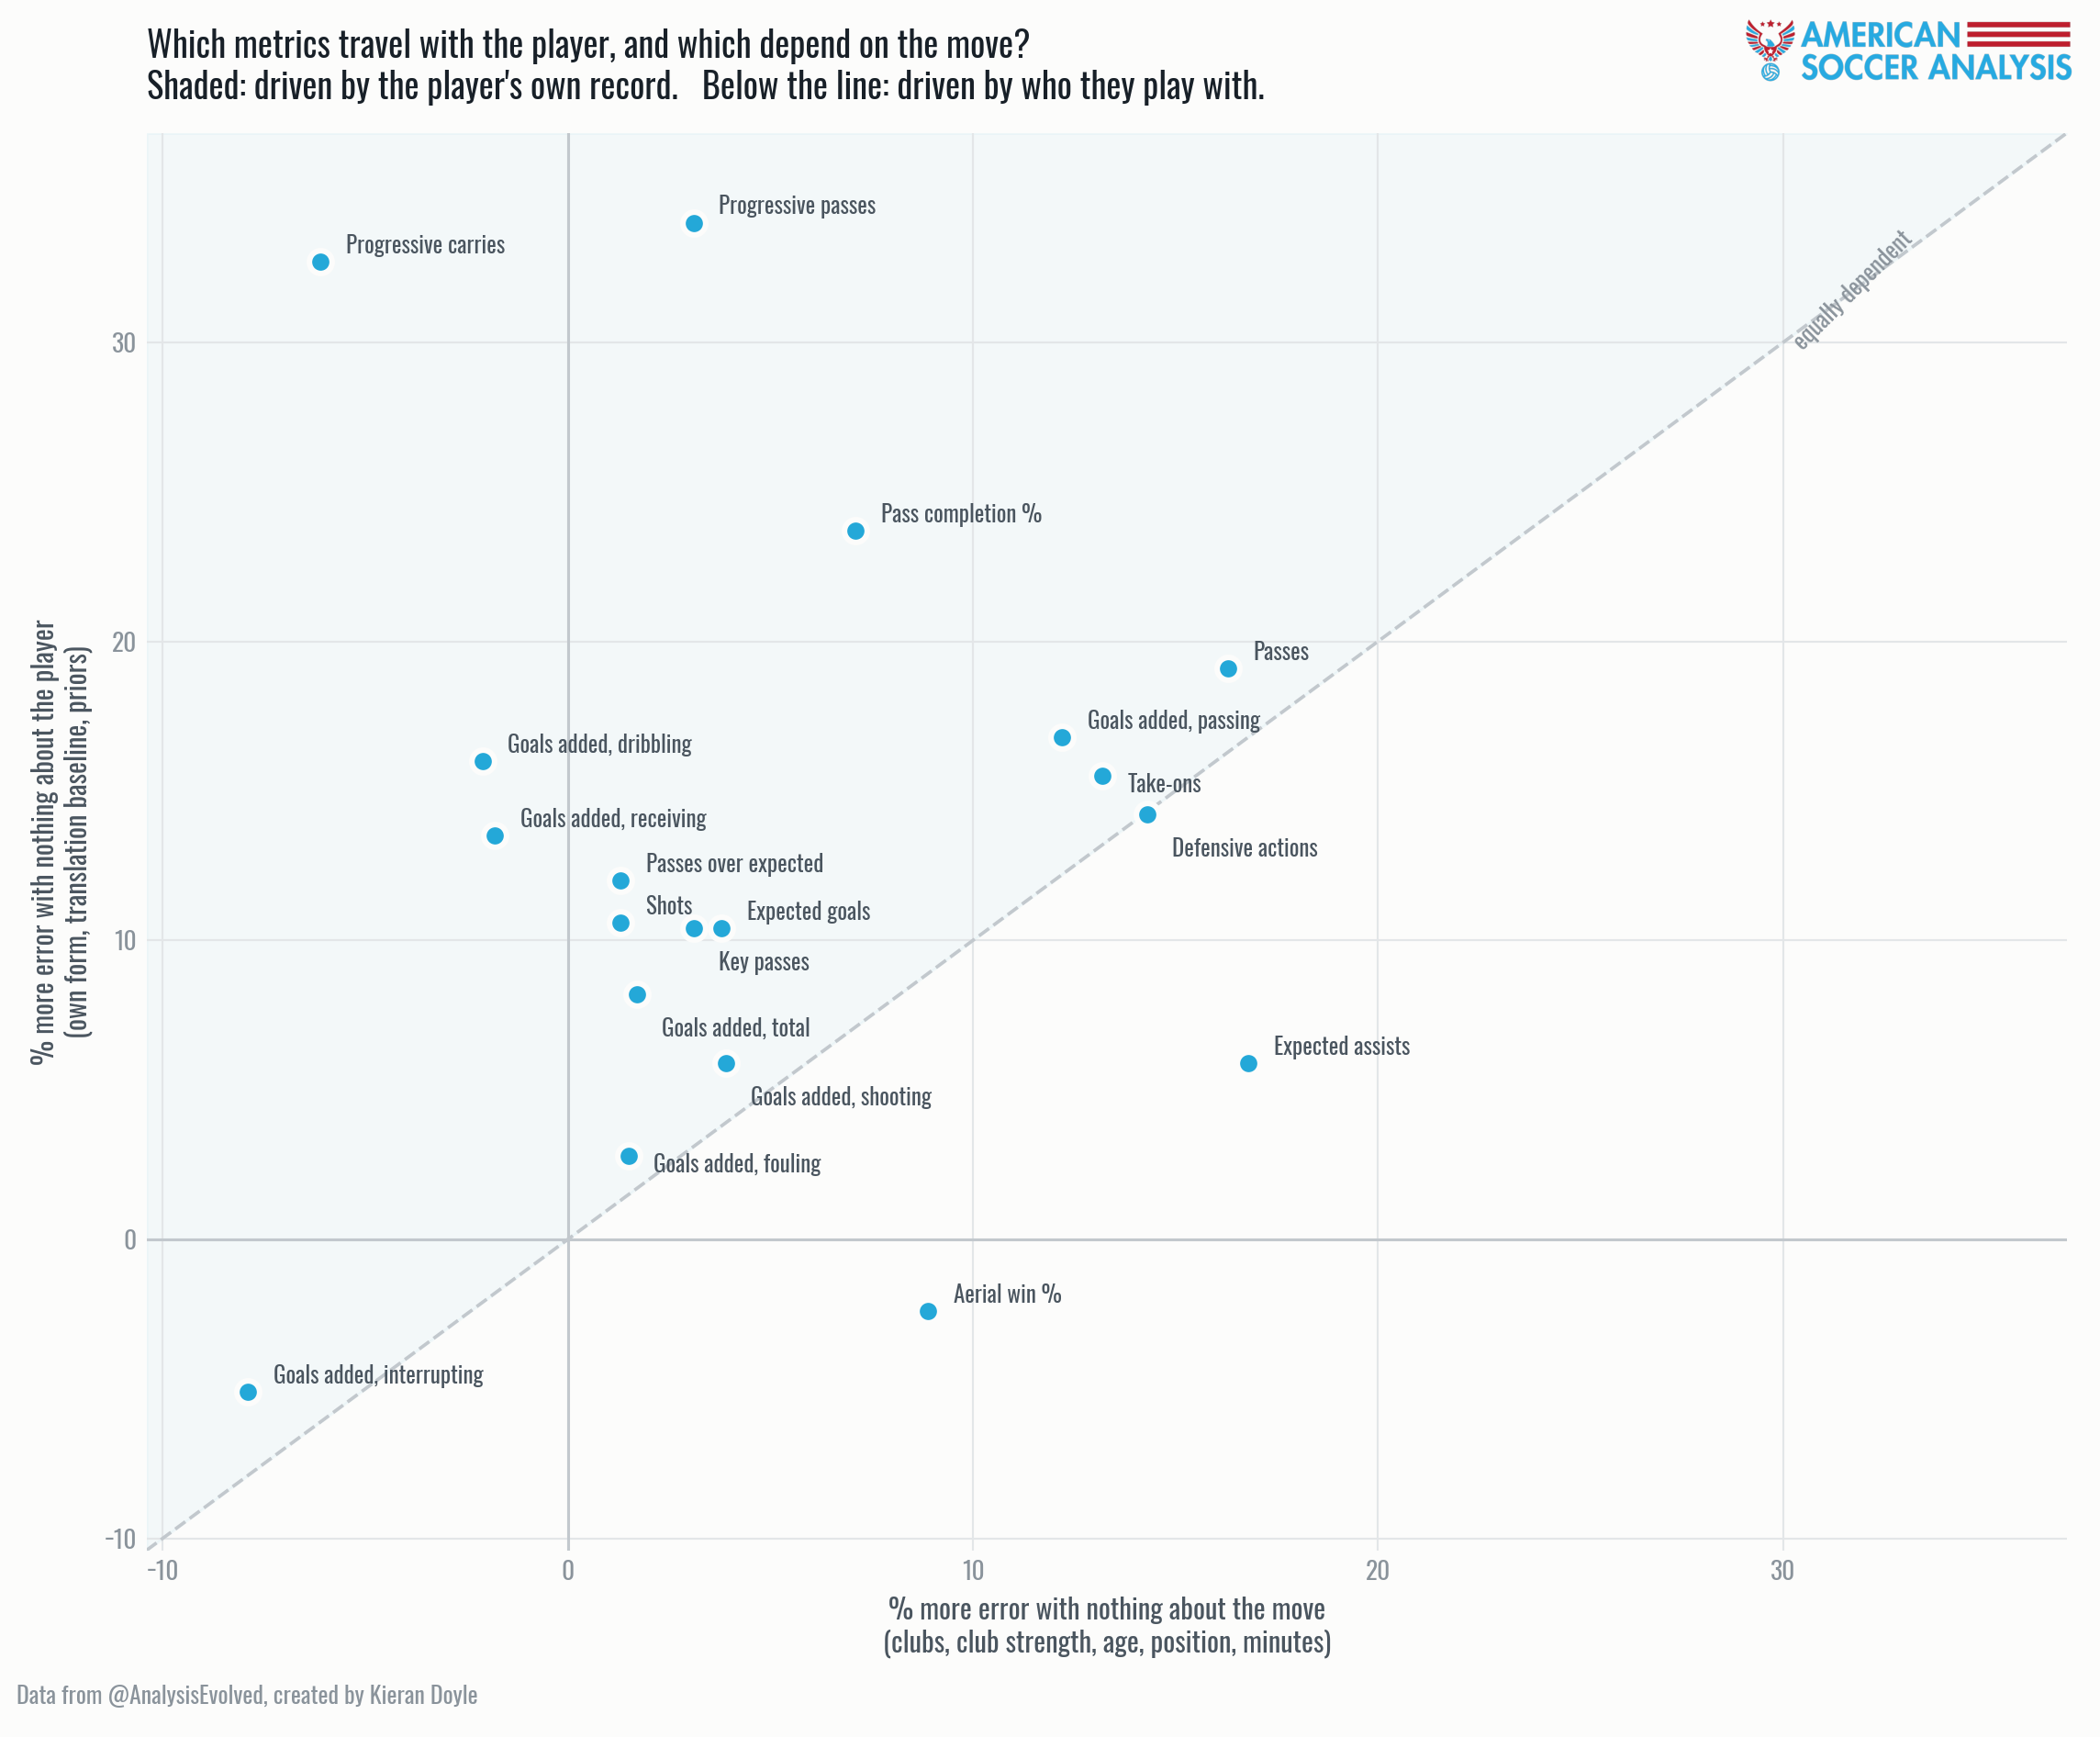
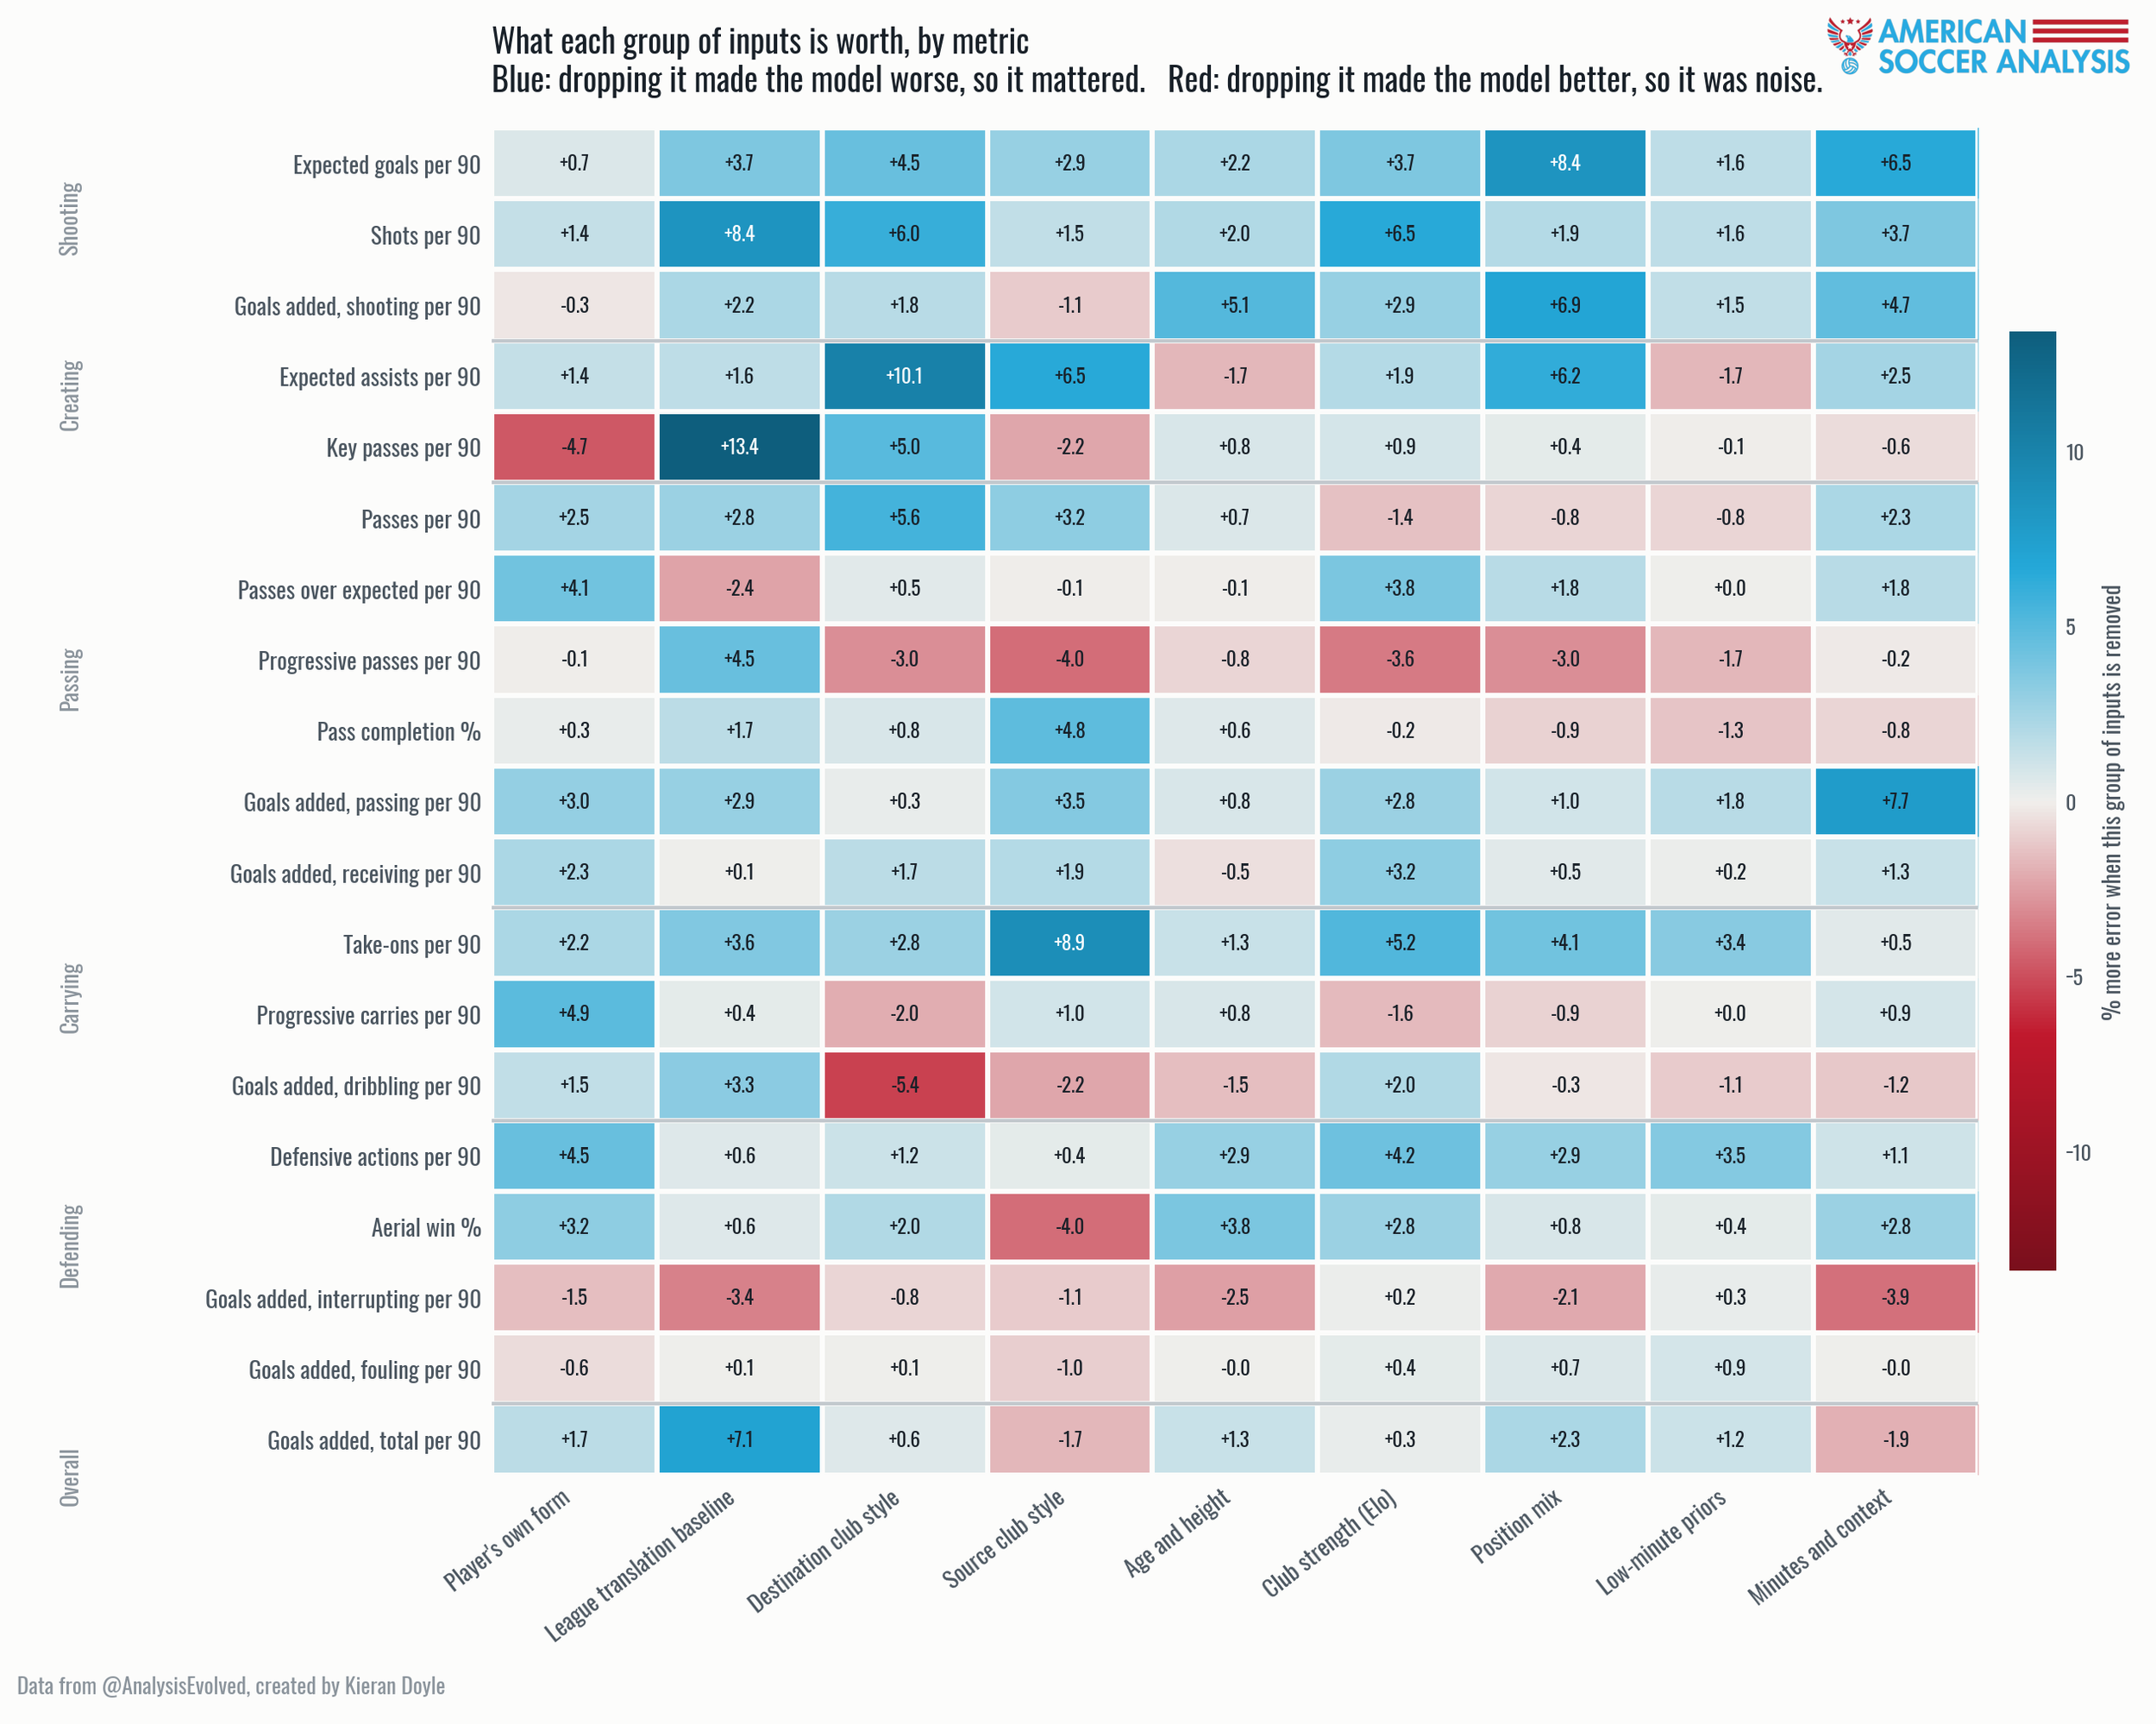
You can see how each of those features impacts each individual metric in the heatmap here. Groups of features are labeled along the bottom of each column, and each row corresponds with a player metric: the value of each cell is the importance of a feature for a metric. Similarly, here is a plot showing which metrics are affected more by the player-specific bucket of features, and which by the transition-specific bucket of features. Some interesting takeaways for me:
Progressive passing is determined almost entirely by the player, whereas g+ passing is an almost 50/50 split. This is a really cool finding that fits my intuition. First phase and middle third ball progressors, players who move the ball from your third into the final third, largely due so independent of team context. Progressive passing is an important component of g+, it does (like all possession value models) lean heavily on field position, but the difference in underlying possession value between 60 yards from goal and 30 yards from goal is not tremendous. What is tremendous is the value of moving it from 30 yards from goal into the penalty area. The players who frequently top the g+ passing tables amongst all players are box entry players. For that, you need teammates. You might be the best passer in MLSNP but if you’re going up to 2026 SKC, good luck. This is hammered home by xA being on the far right of the plot, that is, heavily influenced by the context of the transition.
Dribbling and carrying is all player-side. Dribbling is the skill that translates most effectively from MLSNP to MLS. I’d be curious to talk to some coaches and scouts on why they think that is.
Volume metrics benefit heavily from team context. I wrote about usage and how much usage can drag a player’s underlying metrics up and down many moons ago, and I think that’s just as relevant here. We see that things like take ons, defensive actions, and raw passes attempted benefit heavily from information about the move. A fun study I didn’t do but could do is include usage into the metrics and check model error vs usage difference, i.e. the difference between their MLSNP usage and MLS usage. Of course, a star winger taking 90 touches a game is going to look different in MLS on 15 touches while tracking back as a wingback.
The Actual Projections
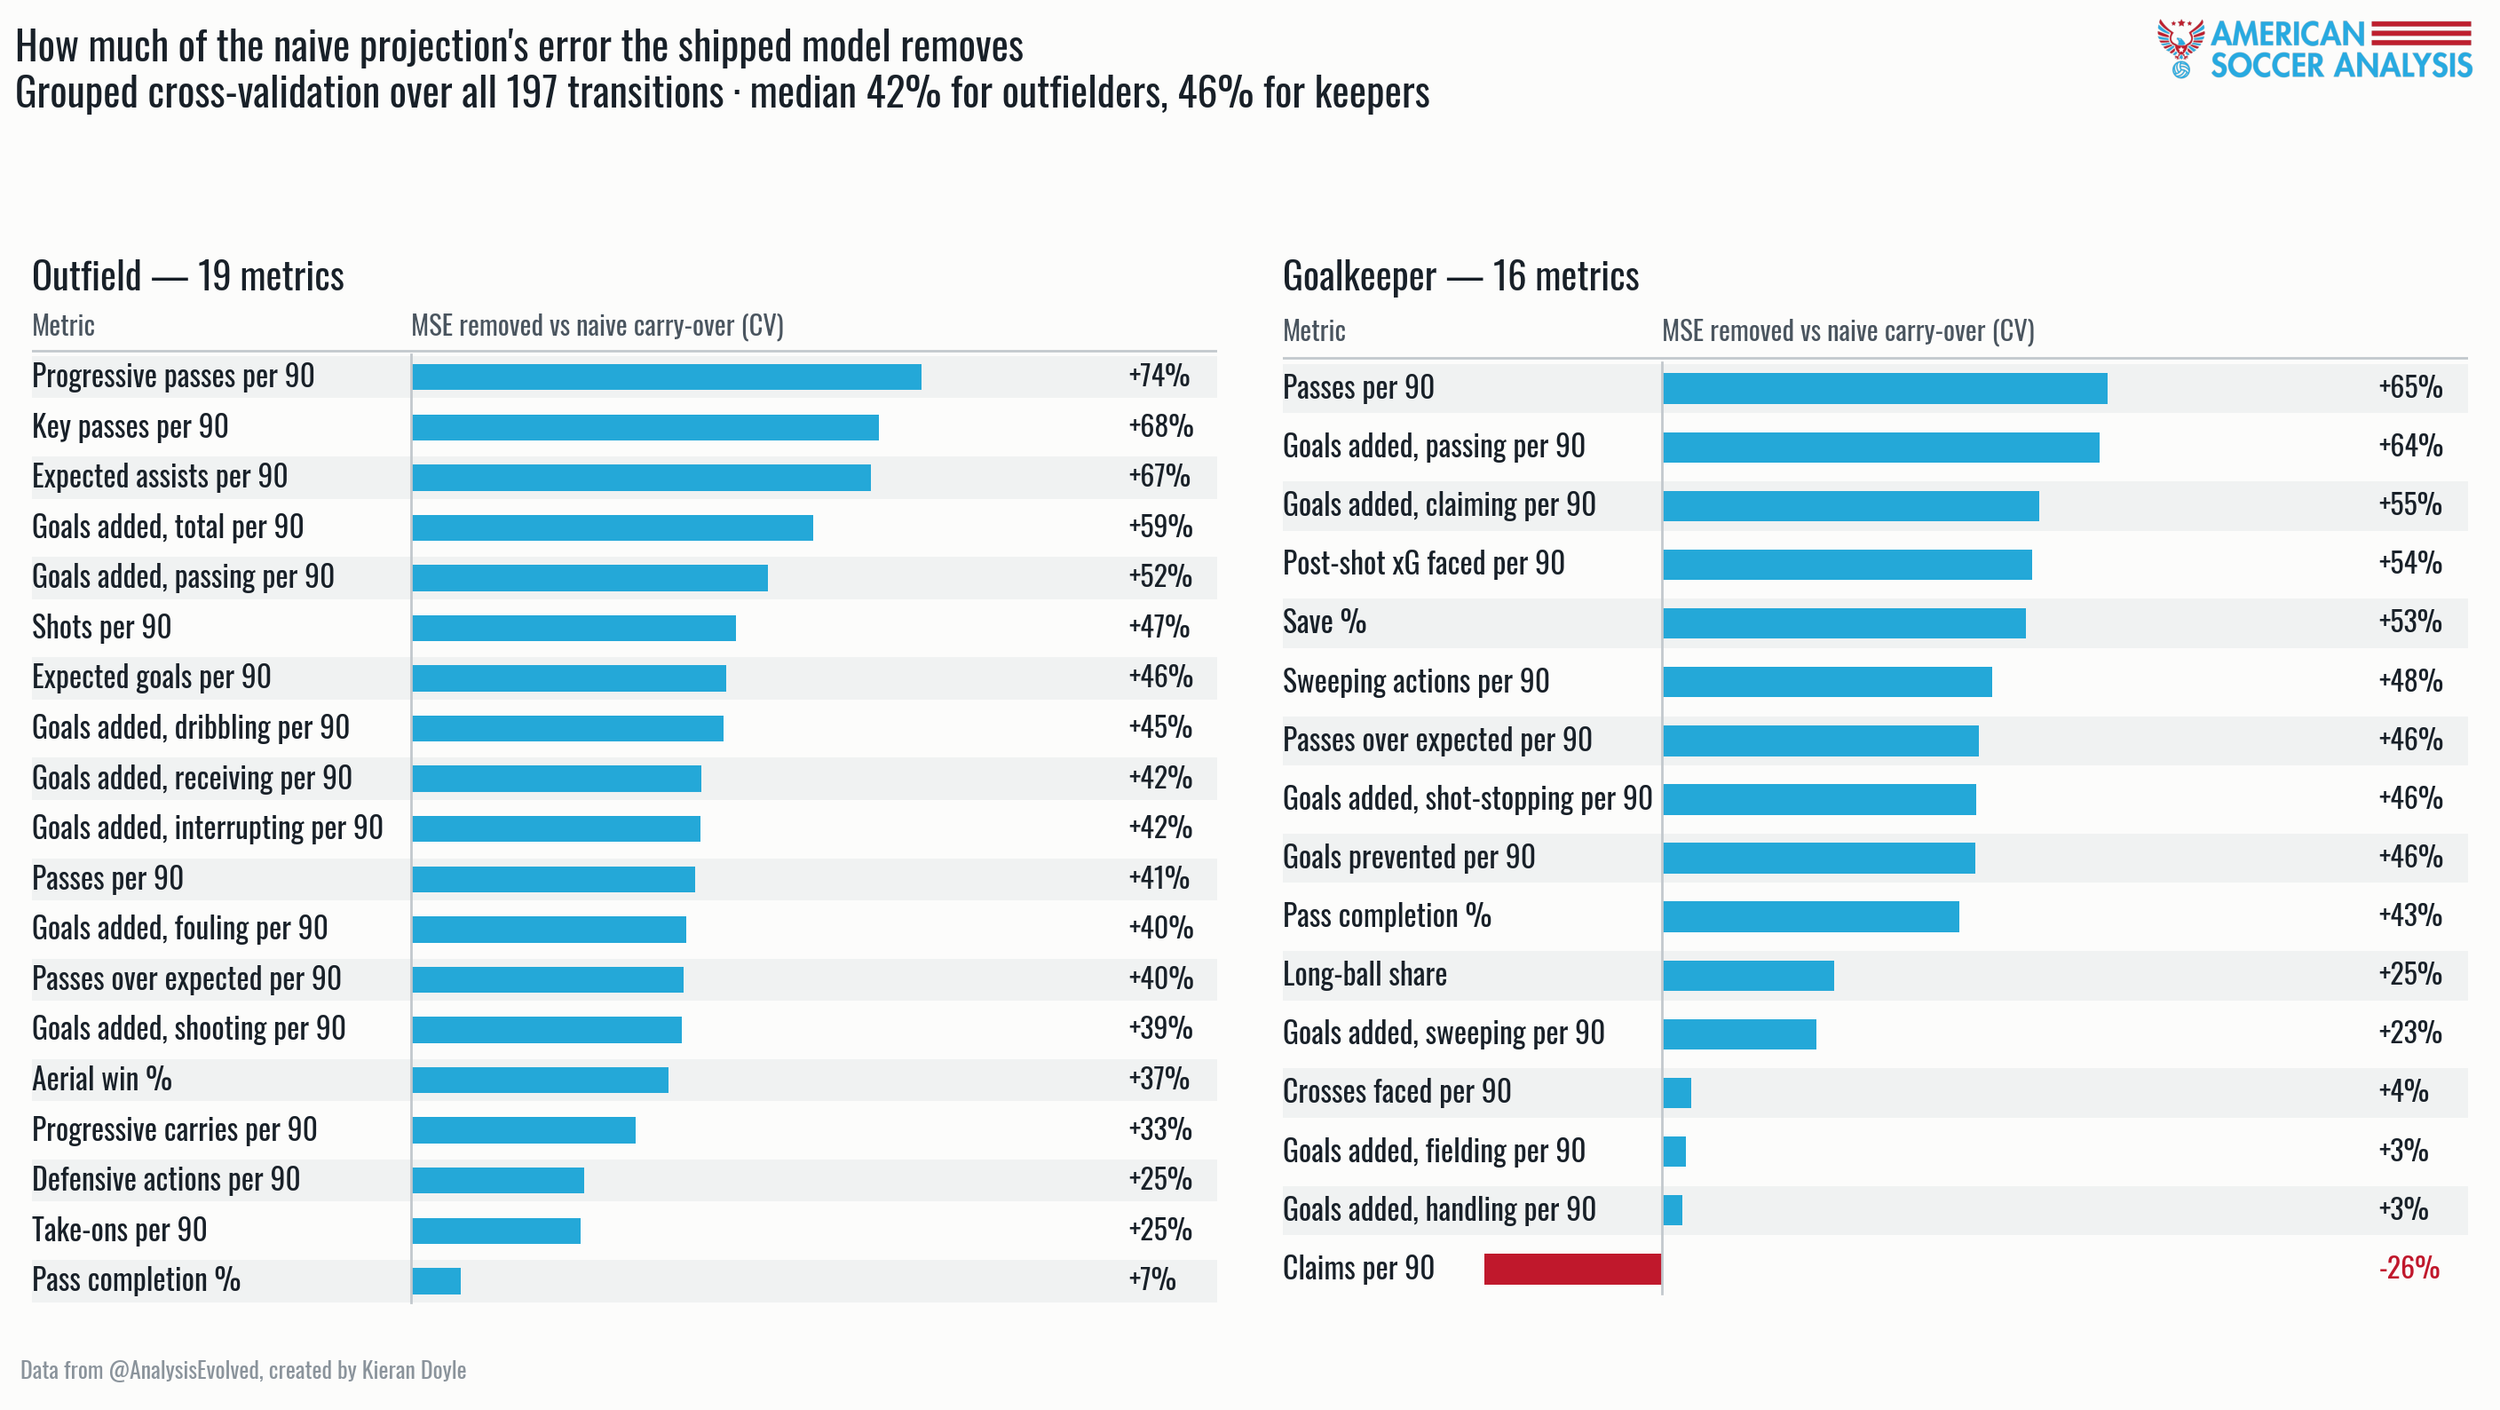
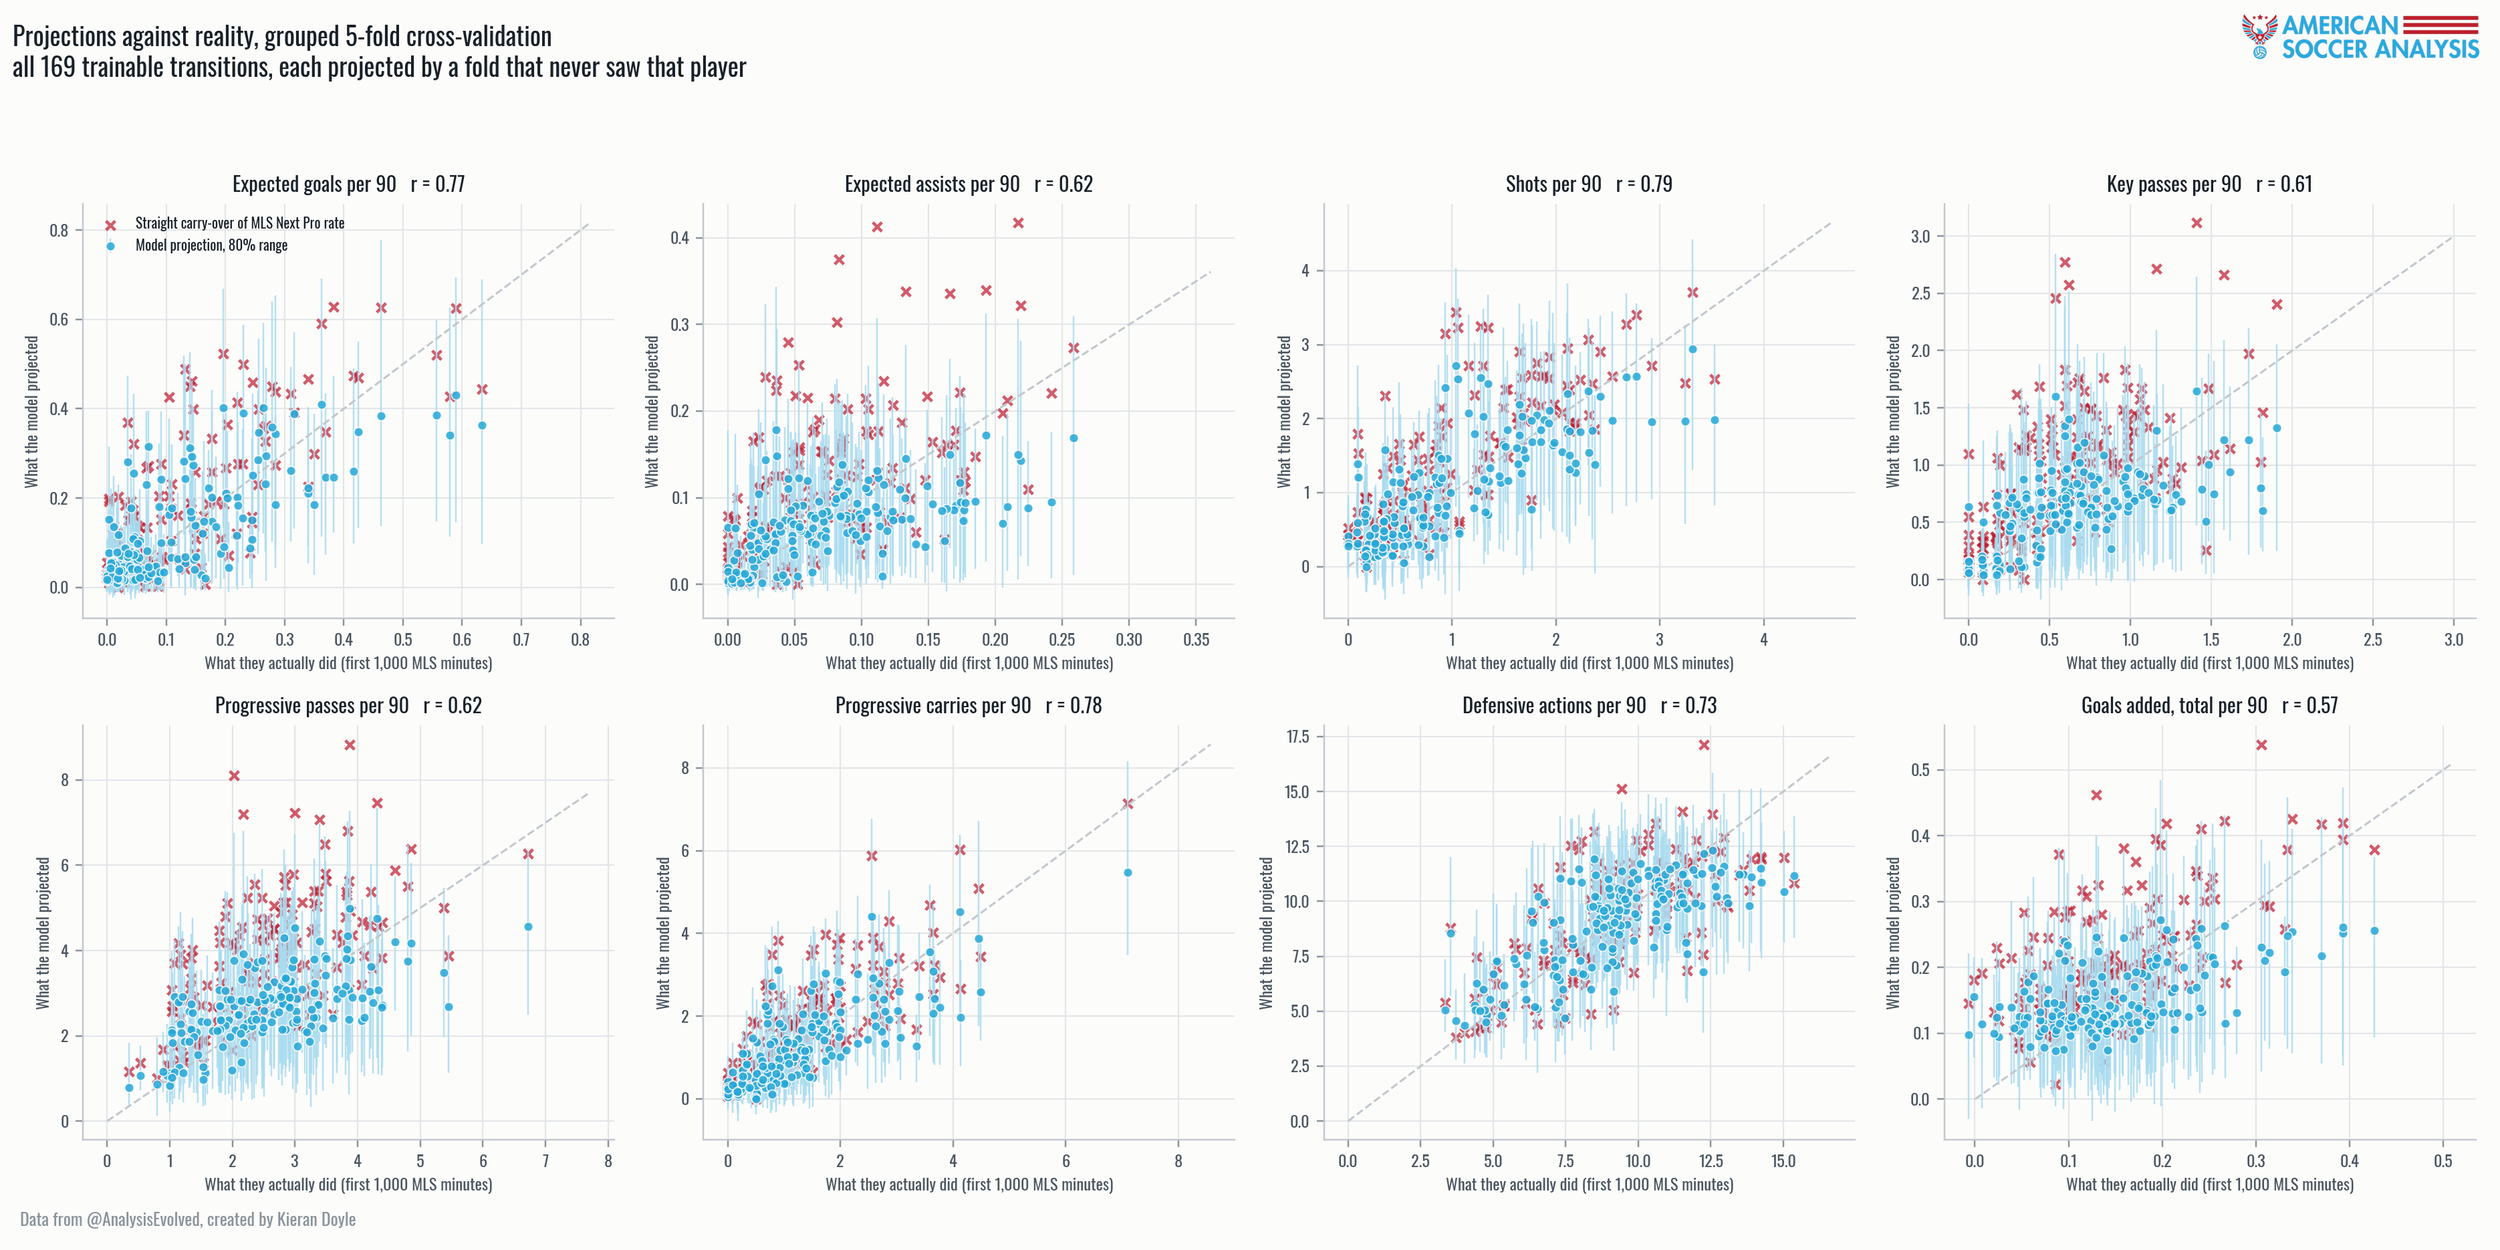
To recap, the European league transfer version of this showed an approximately 50% reduction in mean squared error. That is, if we take the difference between the prediction for a given metric and the actual outcome of that metric, then square it (mean squared error), using such a model reduces that error number by 50%. With our model, we achieve a 42% reduction for outfielders and 46% for goalkeepers compared to just directly porting their metrics up to MLS. The original Opta model had 26,000 transfers to work with, we had just 200 transitions and only 28 of them were goalkeepers. Certain metrics are clearly better handled than others, but given the limited number of transitions here, I’m quite happy with the results. I think most teams would take being 40% more sure of the performance of their rising MLSNP stars.
Now, what you’re really here for is to look at some guys. Here are some of the hottest prospects in MLS Next Pro that haven’t made their debut or have played very few MLS minutes as of July 28, 2026, but if you want to go find your team’s prospects there will be a small tool at the bottom of the article to do so. I will almost certainly not come back to update this data until we’ve got enough transitions to make this model better, but if you bug me for a specific player on BlueSky, I might oblige.
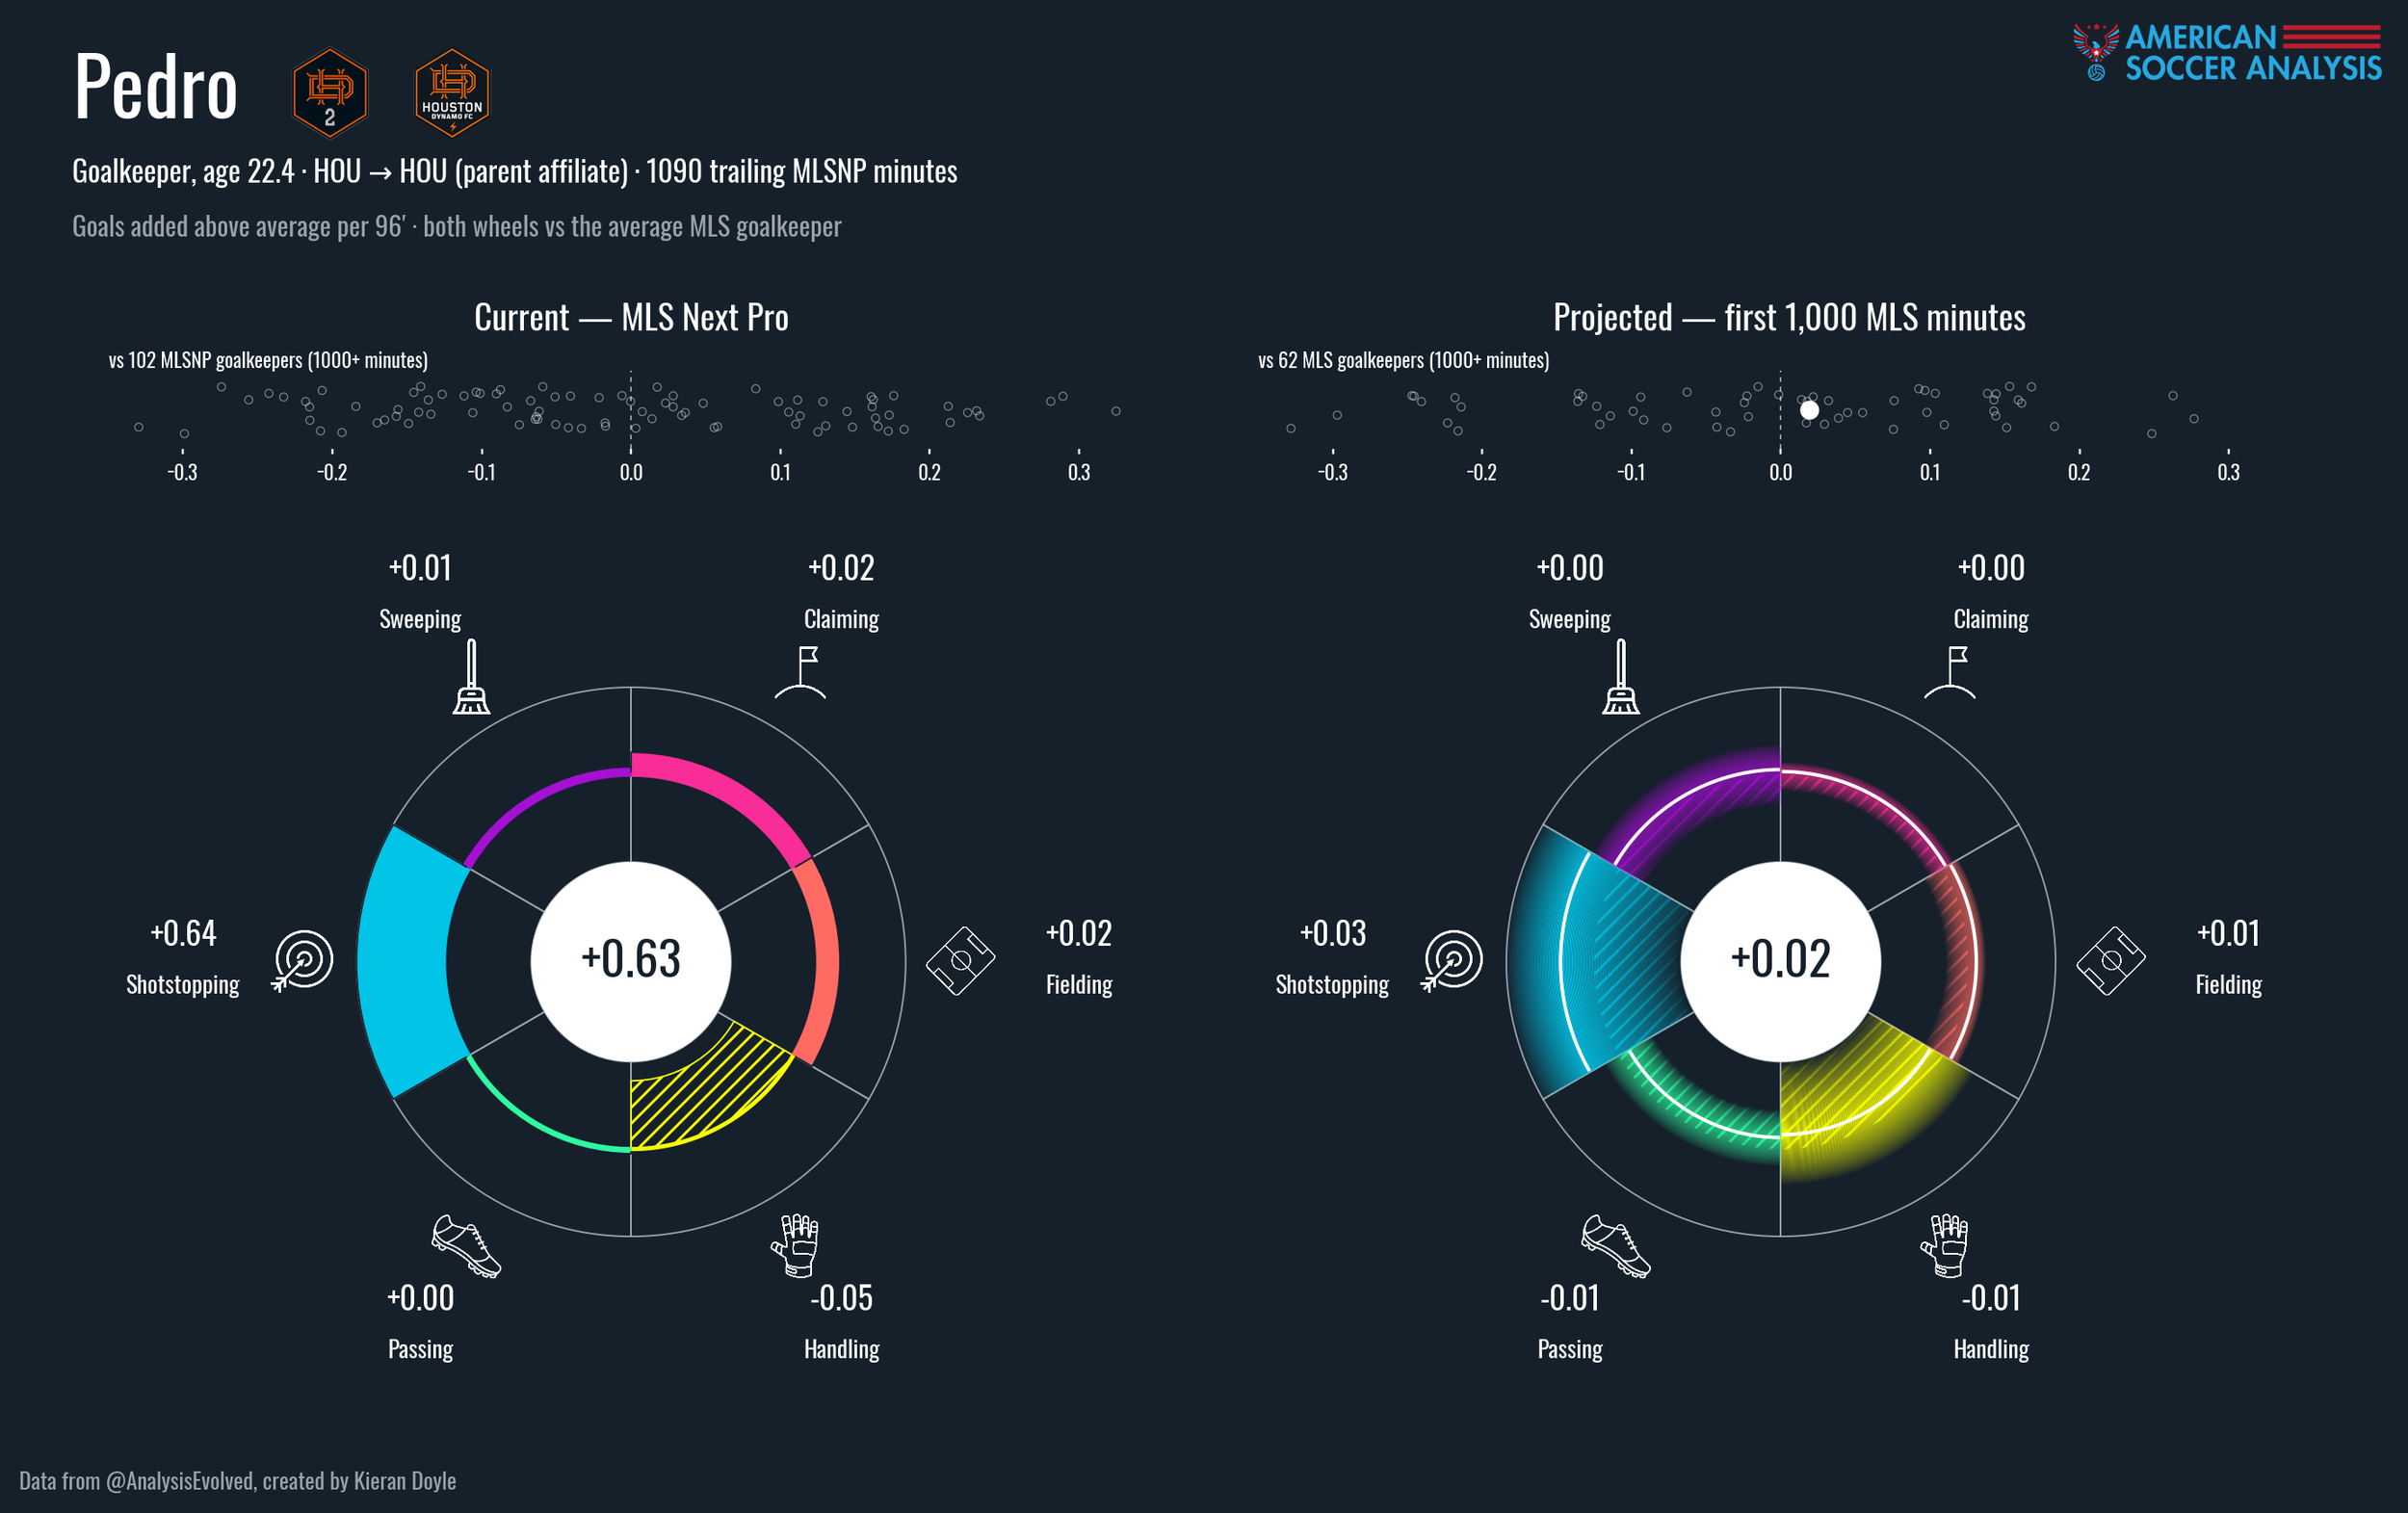
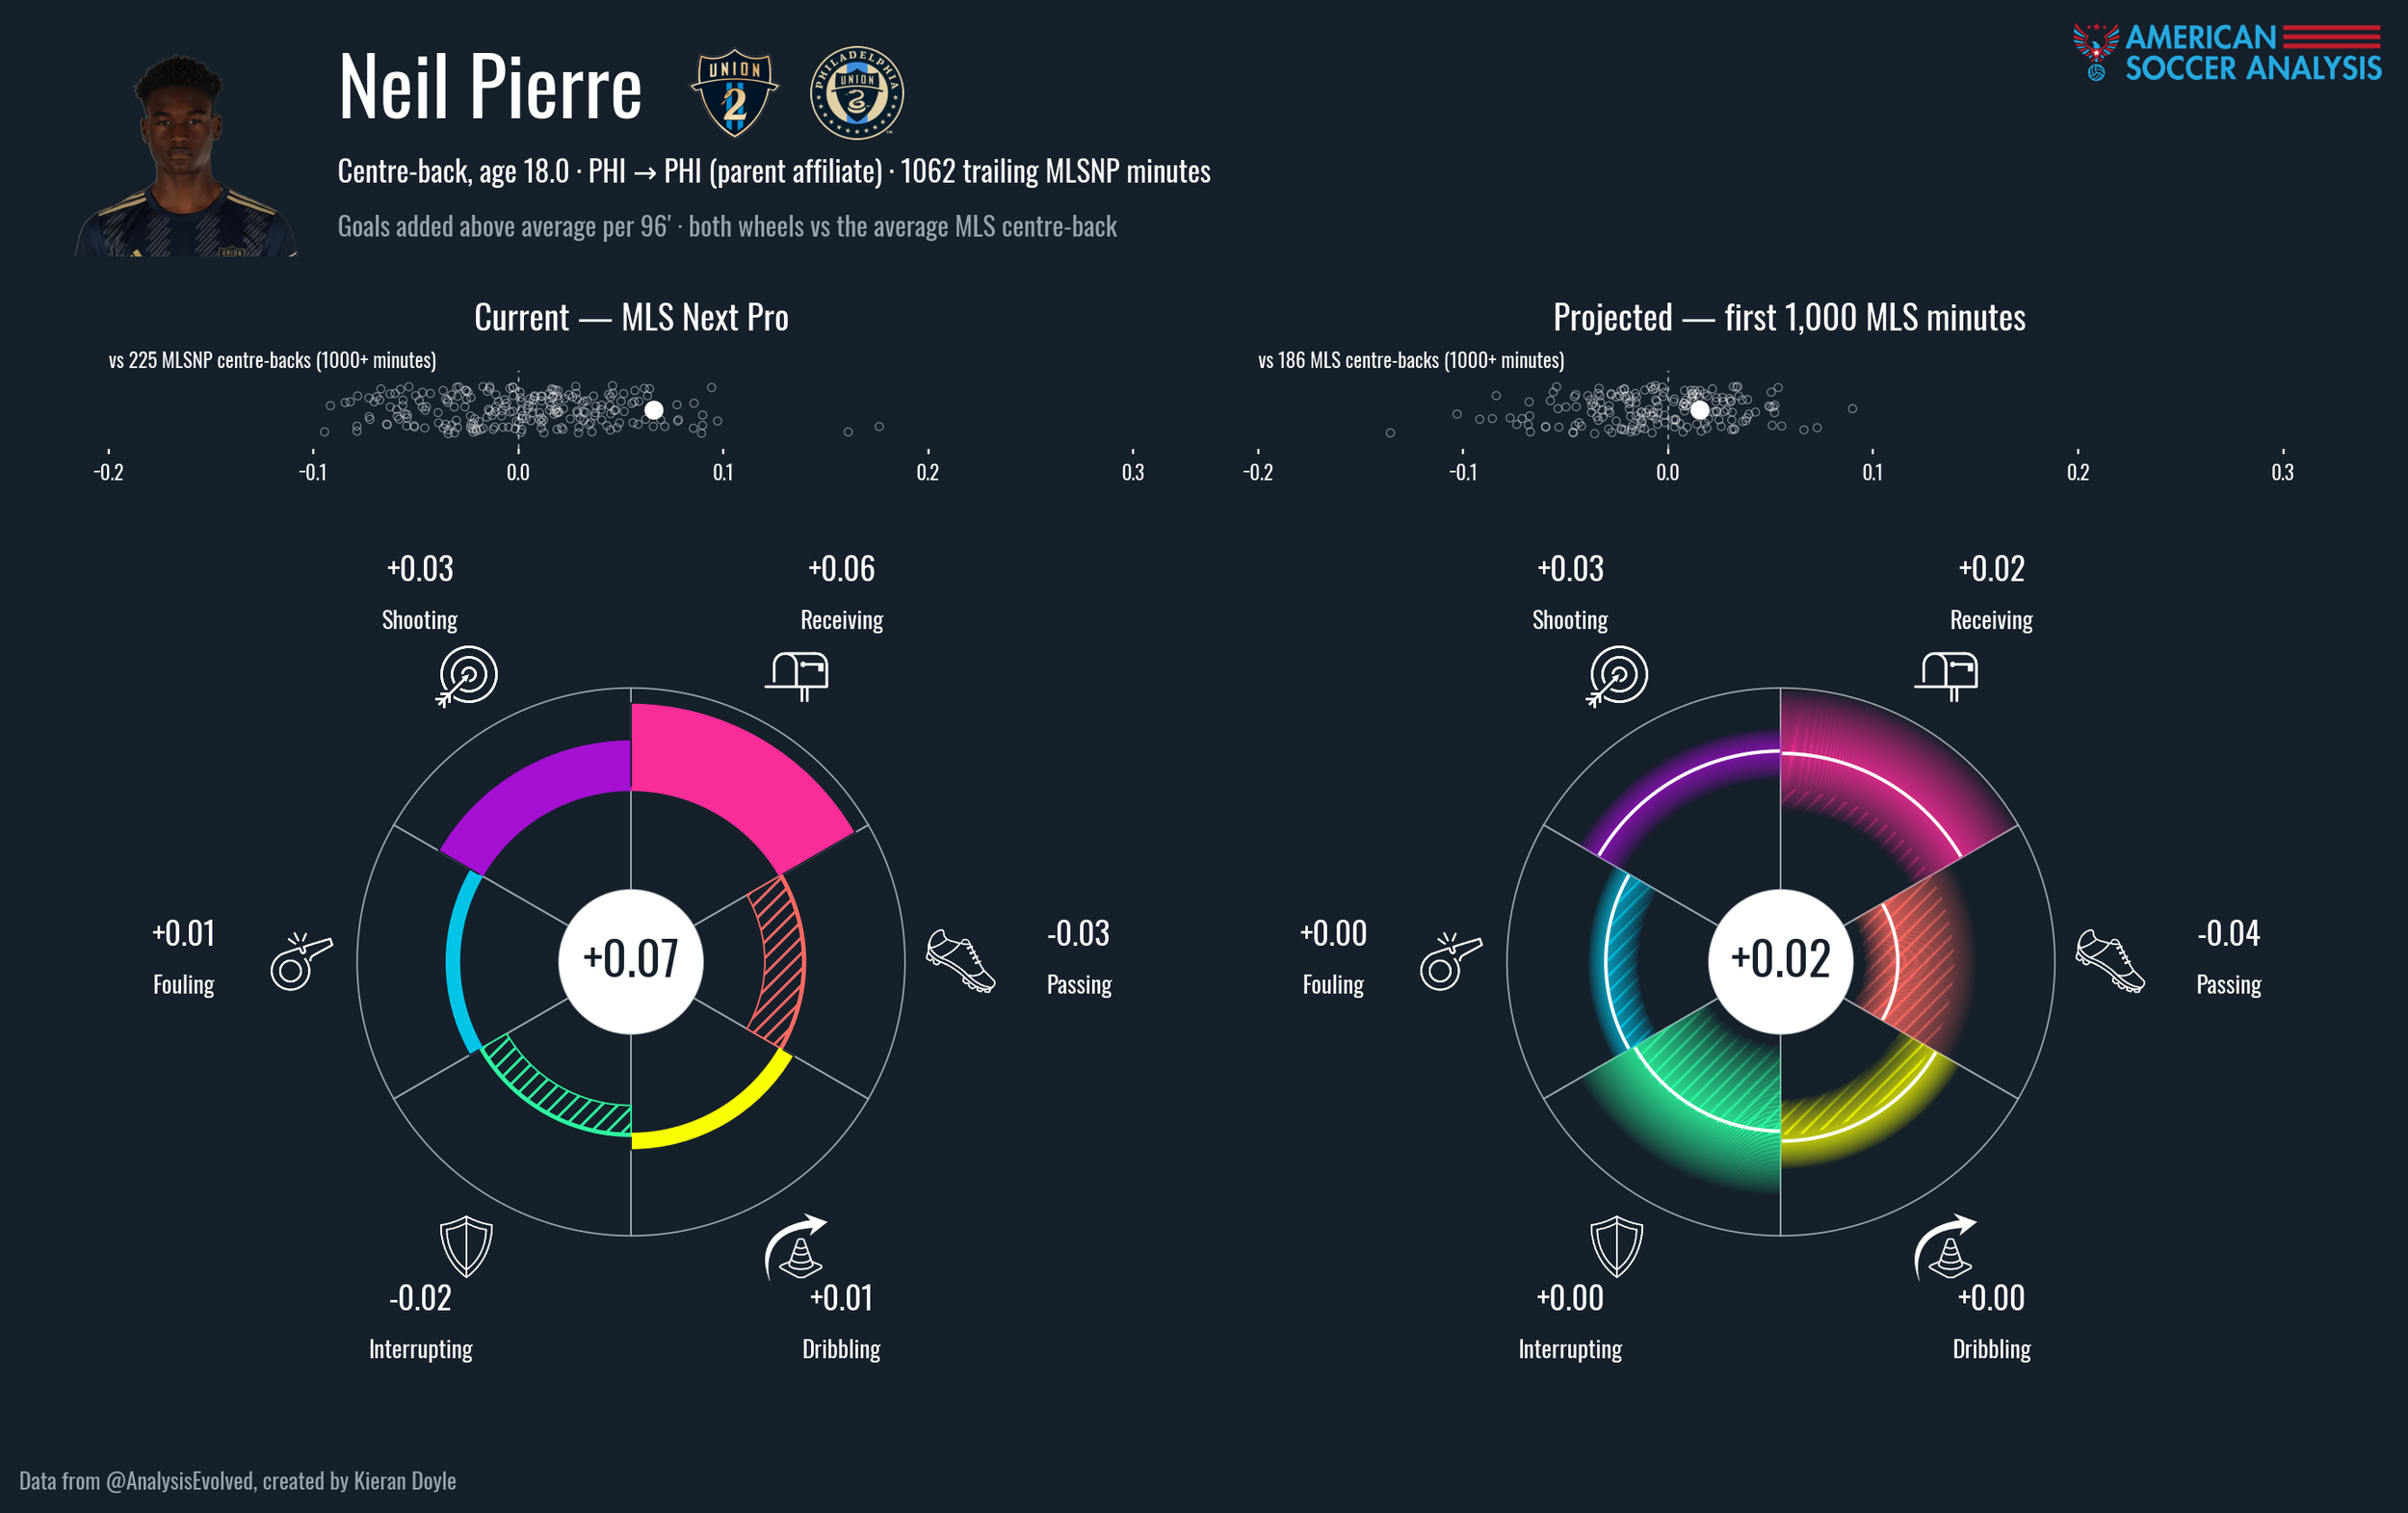
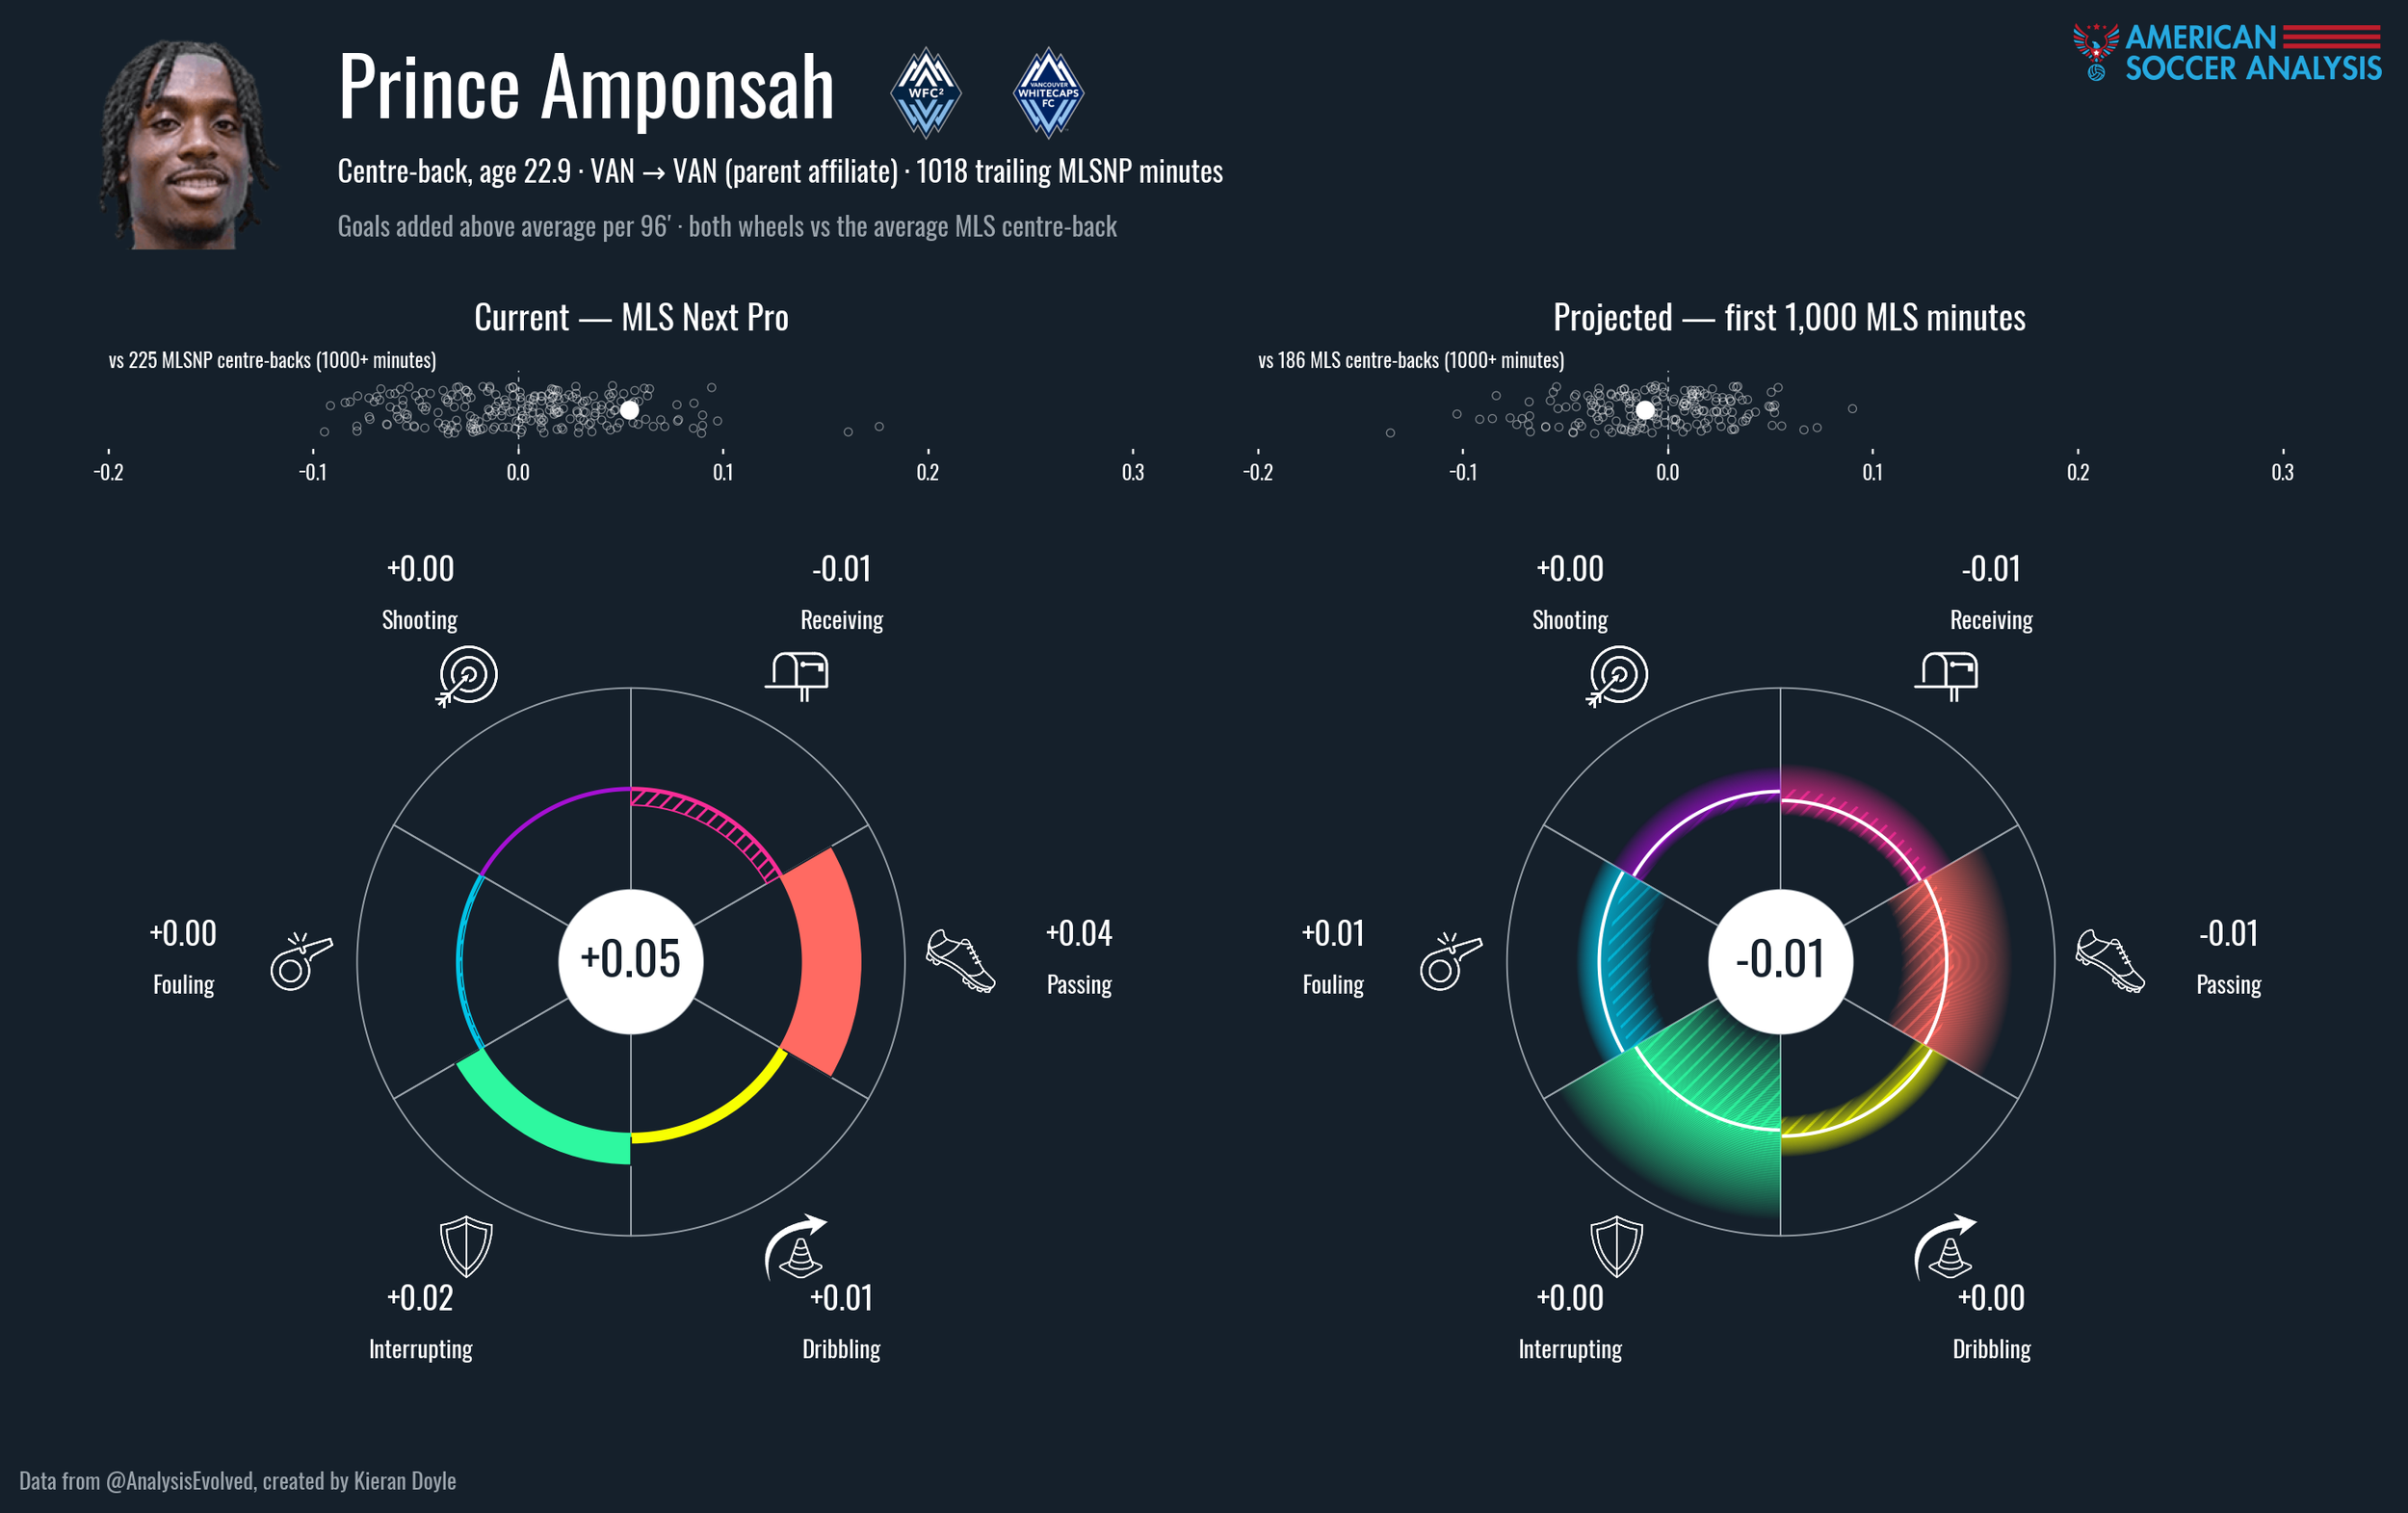
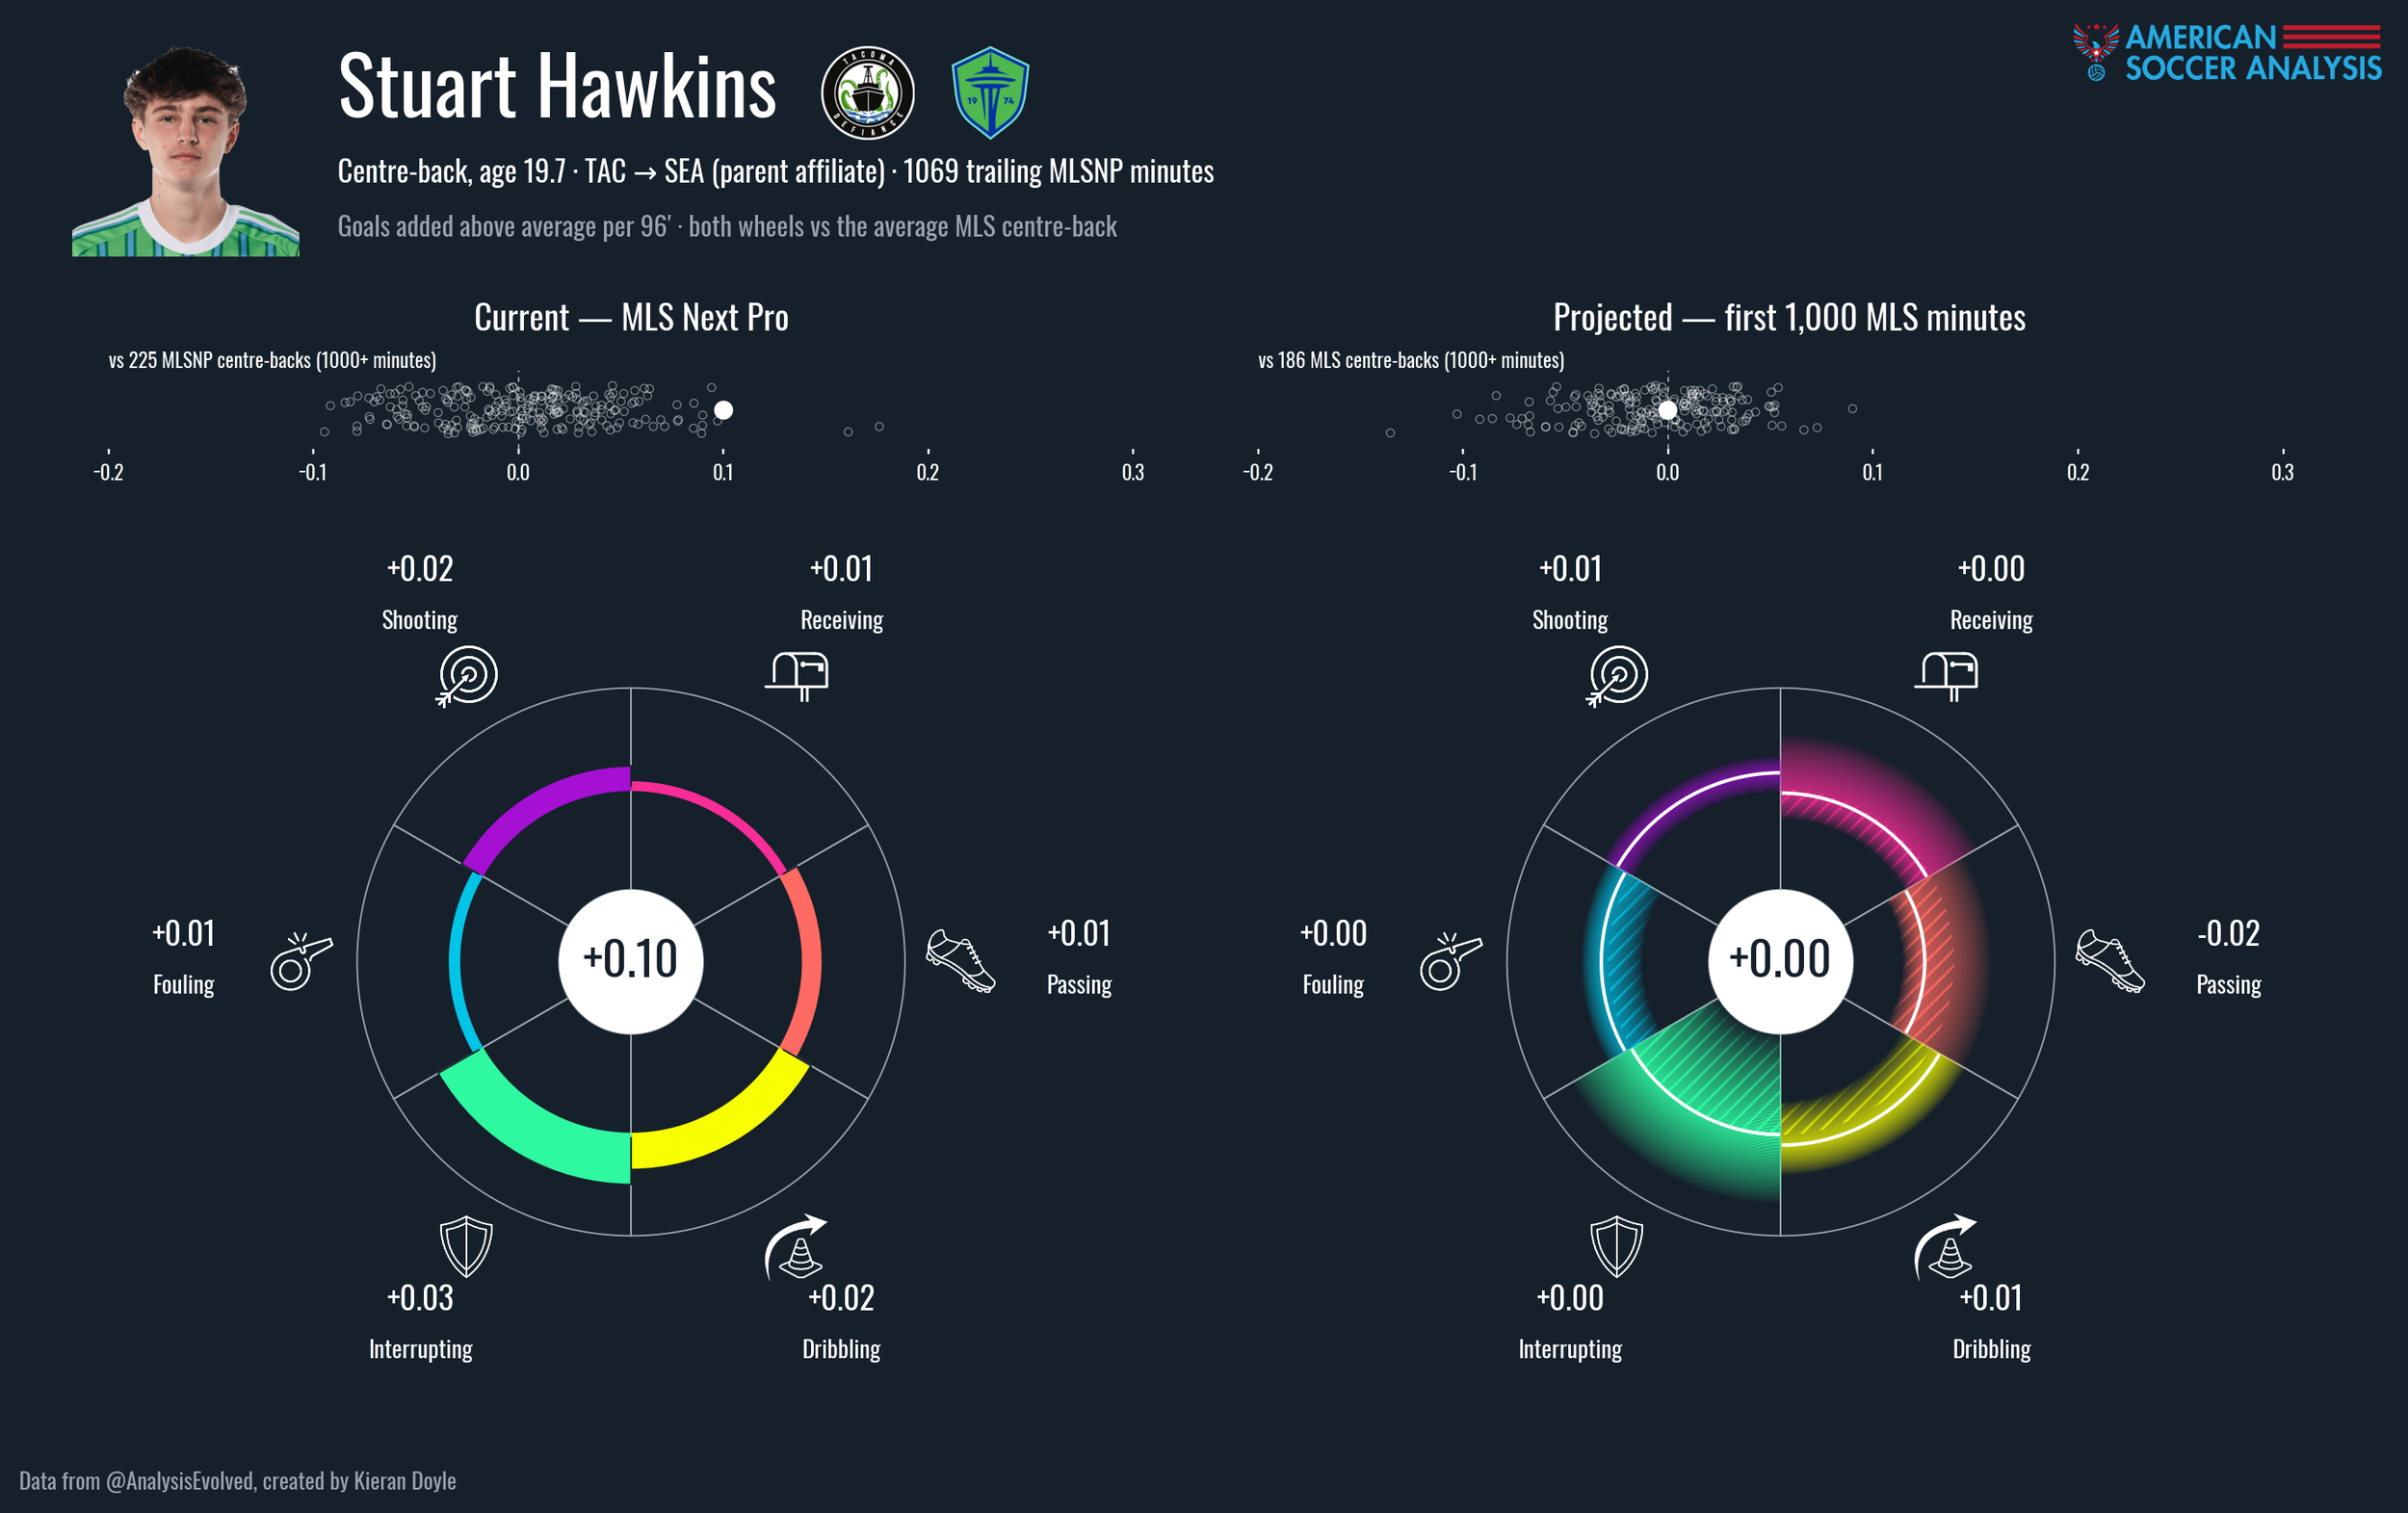
Pedro Cruz, GK, 22 - Houston Dynamo
Pedro Cruz has put up a gargantuan +0.63 g+ per 96 in MLS Next Pro this season, good enough that the Dynamo loaned him to El Paso in the USL Championship for stiffer competition. The projection model drags him down to +0.02 in MLS, mostly by virtue of the inherent extreme volatility of shot stopping as a metric, meaning everyone gets dragged heavily to zero.
Neil Pierre, CB, 18 - Philadelphia Union
Pierre is a weird player that almost inexplicably struggled to get big Union minutes until very recently. His +0.07 p96 in the minors translates as a +0.02 in MLS, mostly by virtue of his strong performance in non-traditional CB stats like g+ shooting and receiving. At 6’ 7”, it makes sense, you can’t teach size and he is certainly a set piece threat.
Prince Amponsah, CB, 22 - Vancouver Whitecaps
People more astute than me flagged Amponsah as a terrific Baby Caps gamble in preseason, after he departed NYCFC after just one season. His strong passing at the Next Pro level (go watch his college highlight tape, it’s a joke) and well rounded game drags him towards an about league average centerback. If Amponsah was Manu Duah sized, we’d be talking about him in the same light, but there’s probably an MLS player in there. If I was a team playing a back three, he’d be one of the first names on my offseason list.
Stuart Hawkins, CB, 19 - Seattle Sounders
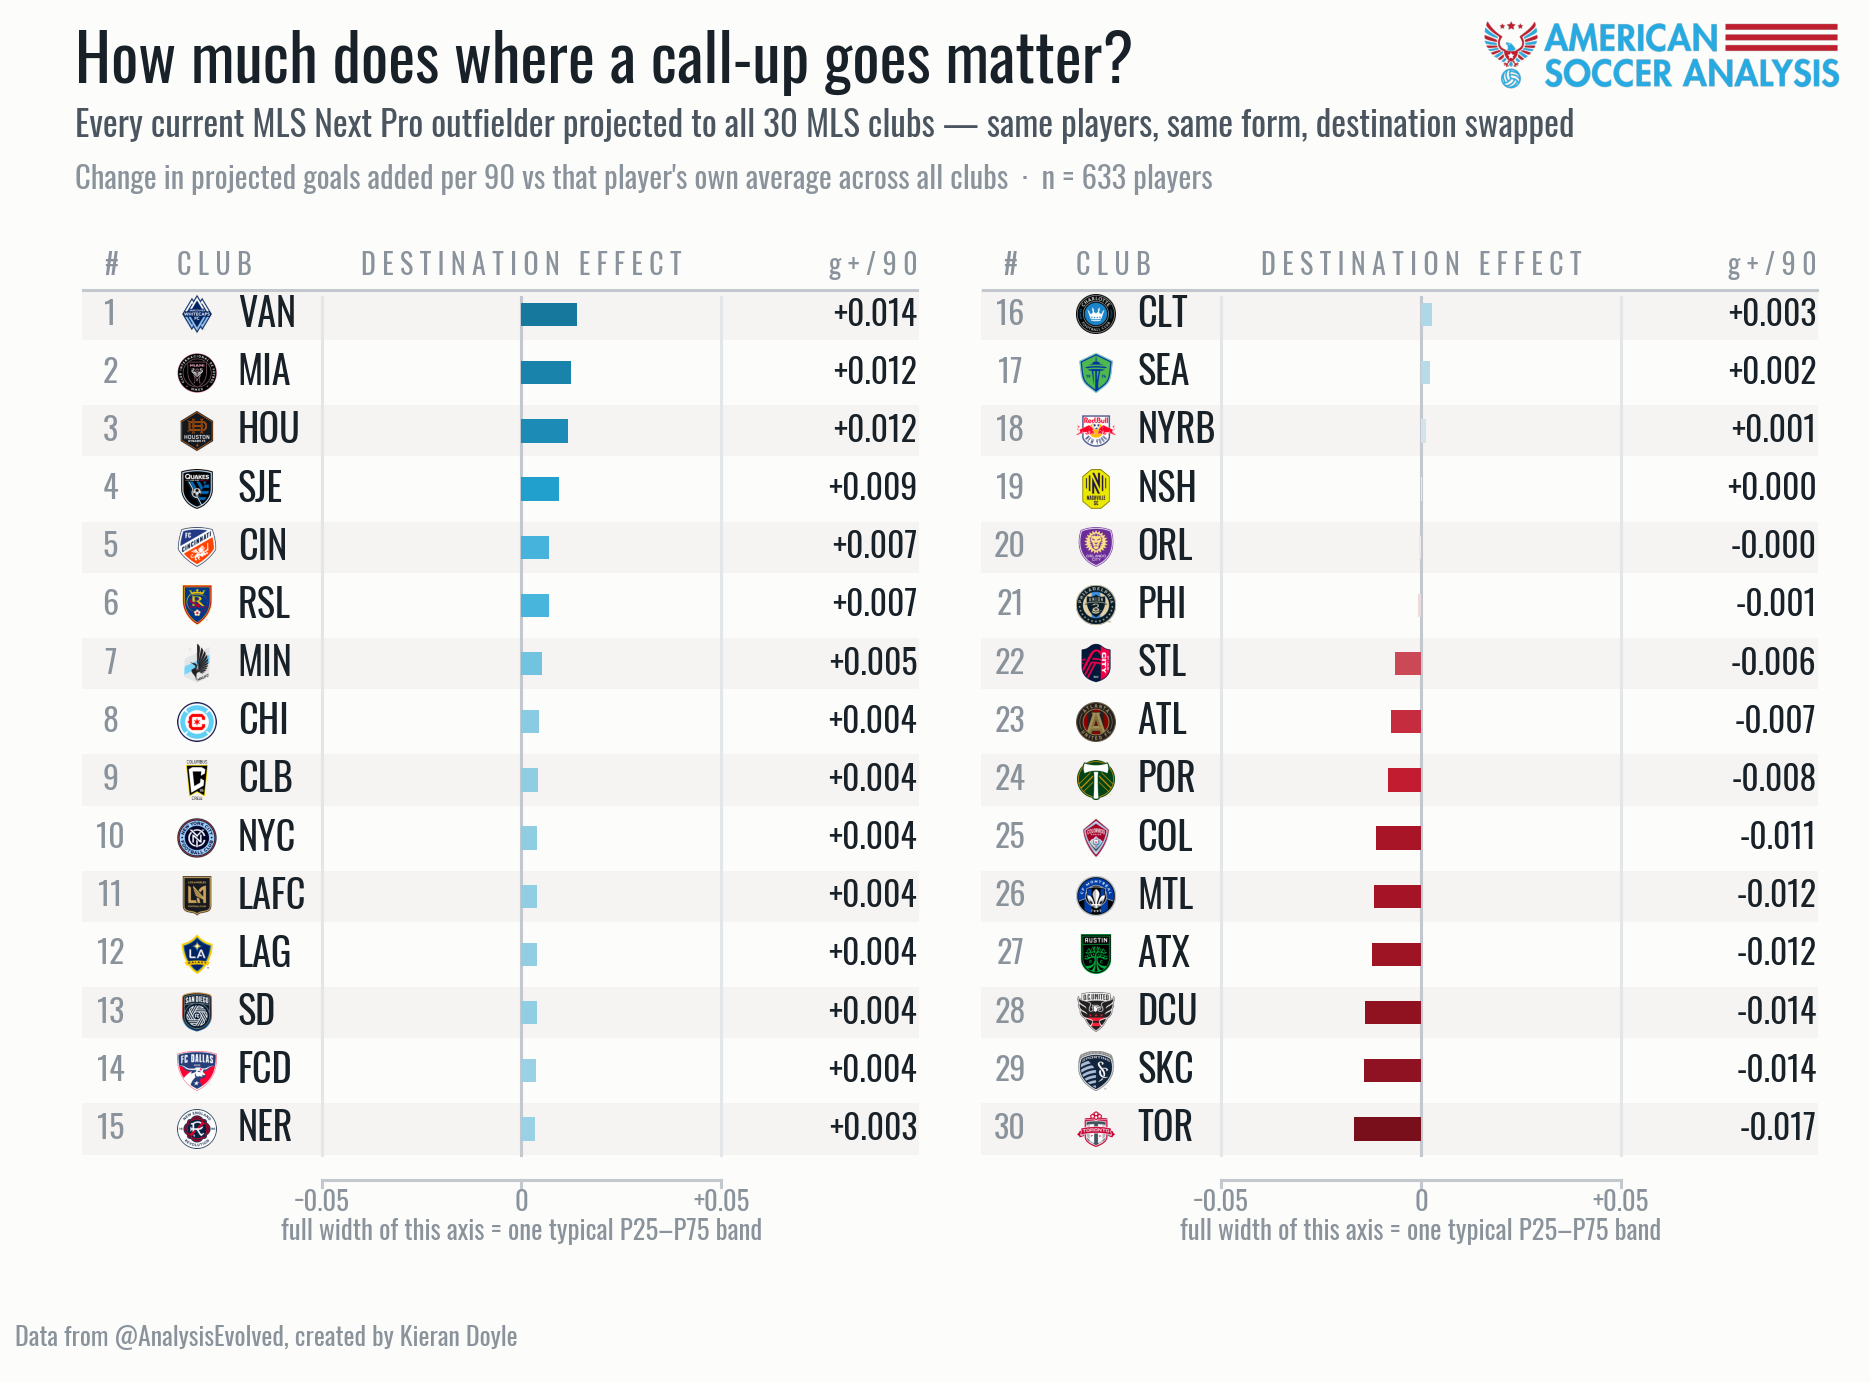
Hawkins, like Amponsah, is flagged as an about league average centerback across his first 1000 MLS minutes based on his MLS Next Pro play. The model includes a feature to translate for the context of the situation you go to when you get promoted up. Interestingly, Seattle are only middle of the pack in terms of how much their context helps prospects translate. As an aside, I think this is mostly because Tacoma is an extremely well run program and so their players have outsized production in MLSNP compared to their actual abilities, rather than Seattle sucking or something. This is in theory accounted for by the model which knows some context features about your youth program, but I’m skeptical it’s enough. Regardless, Hawkins is a dude.
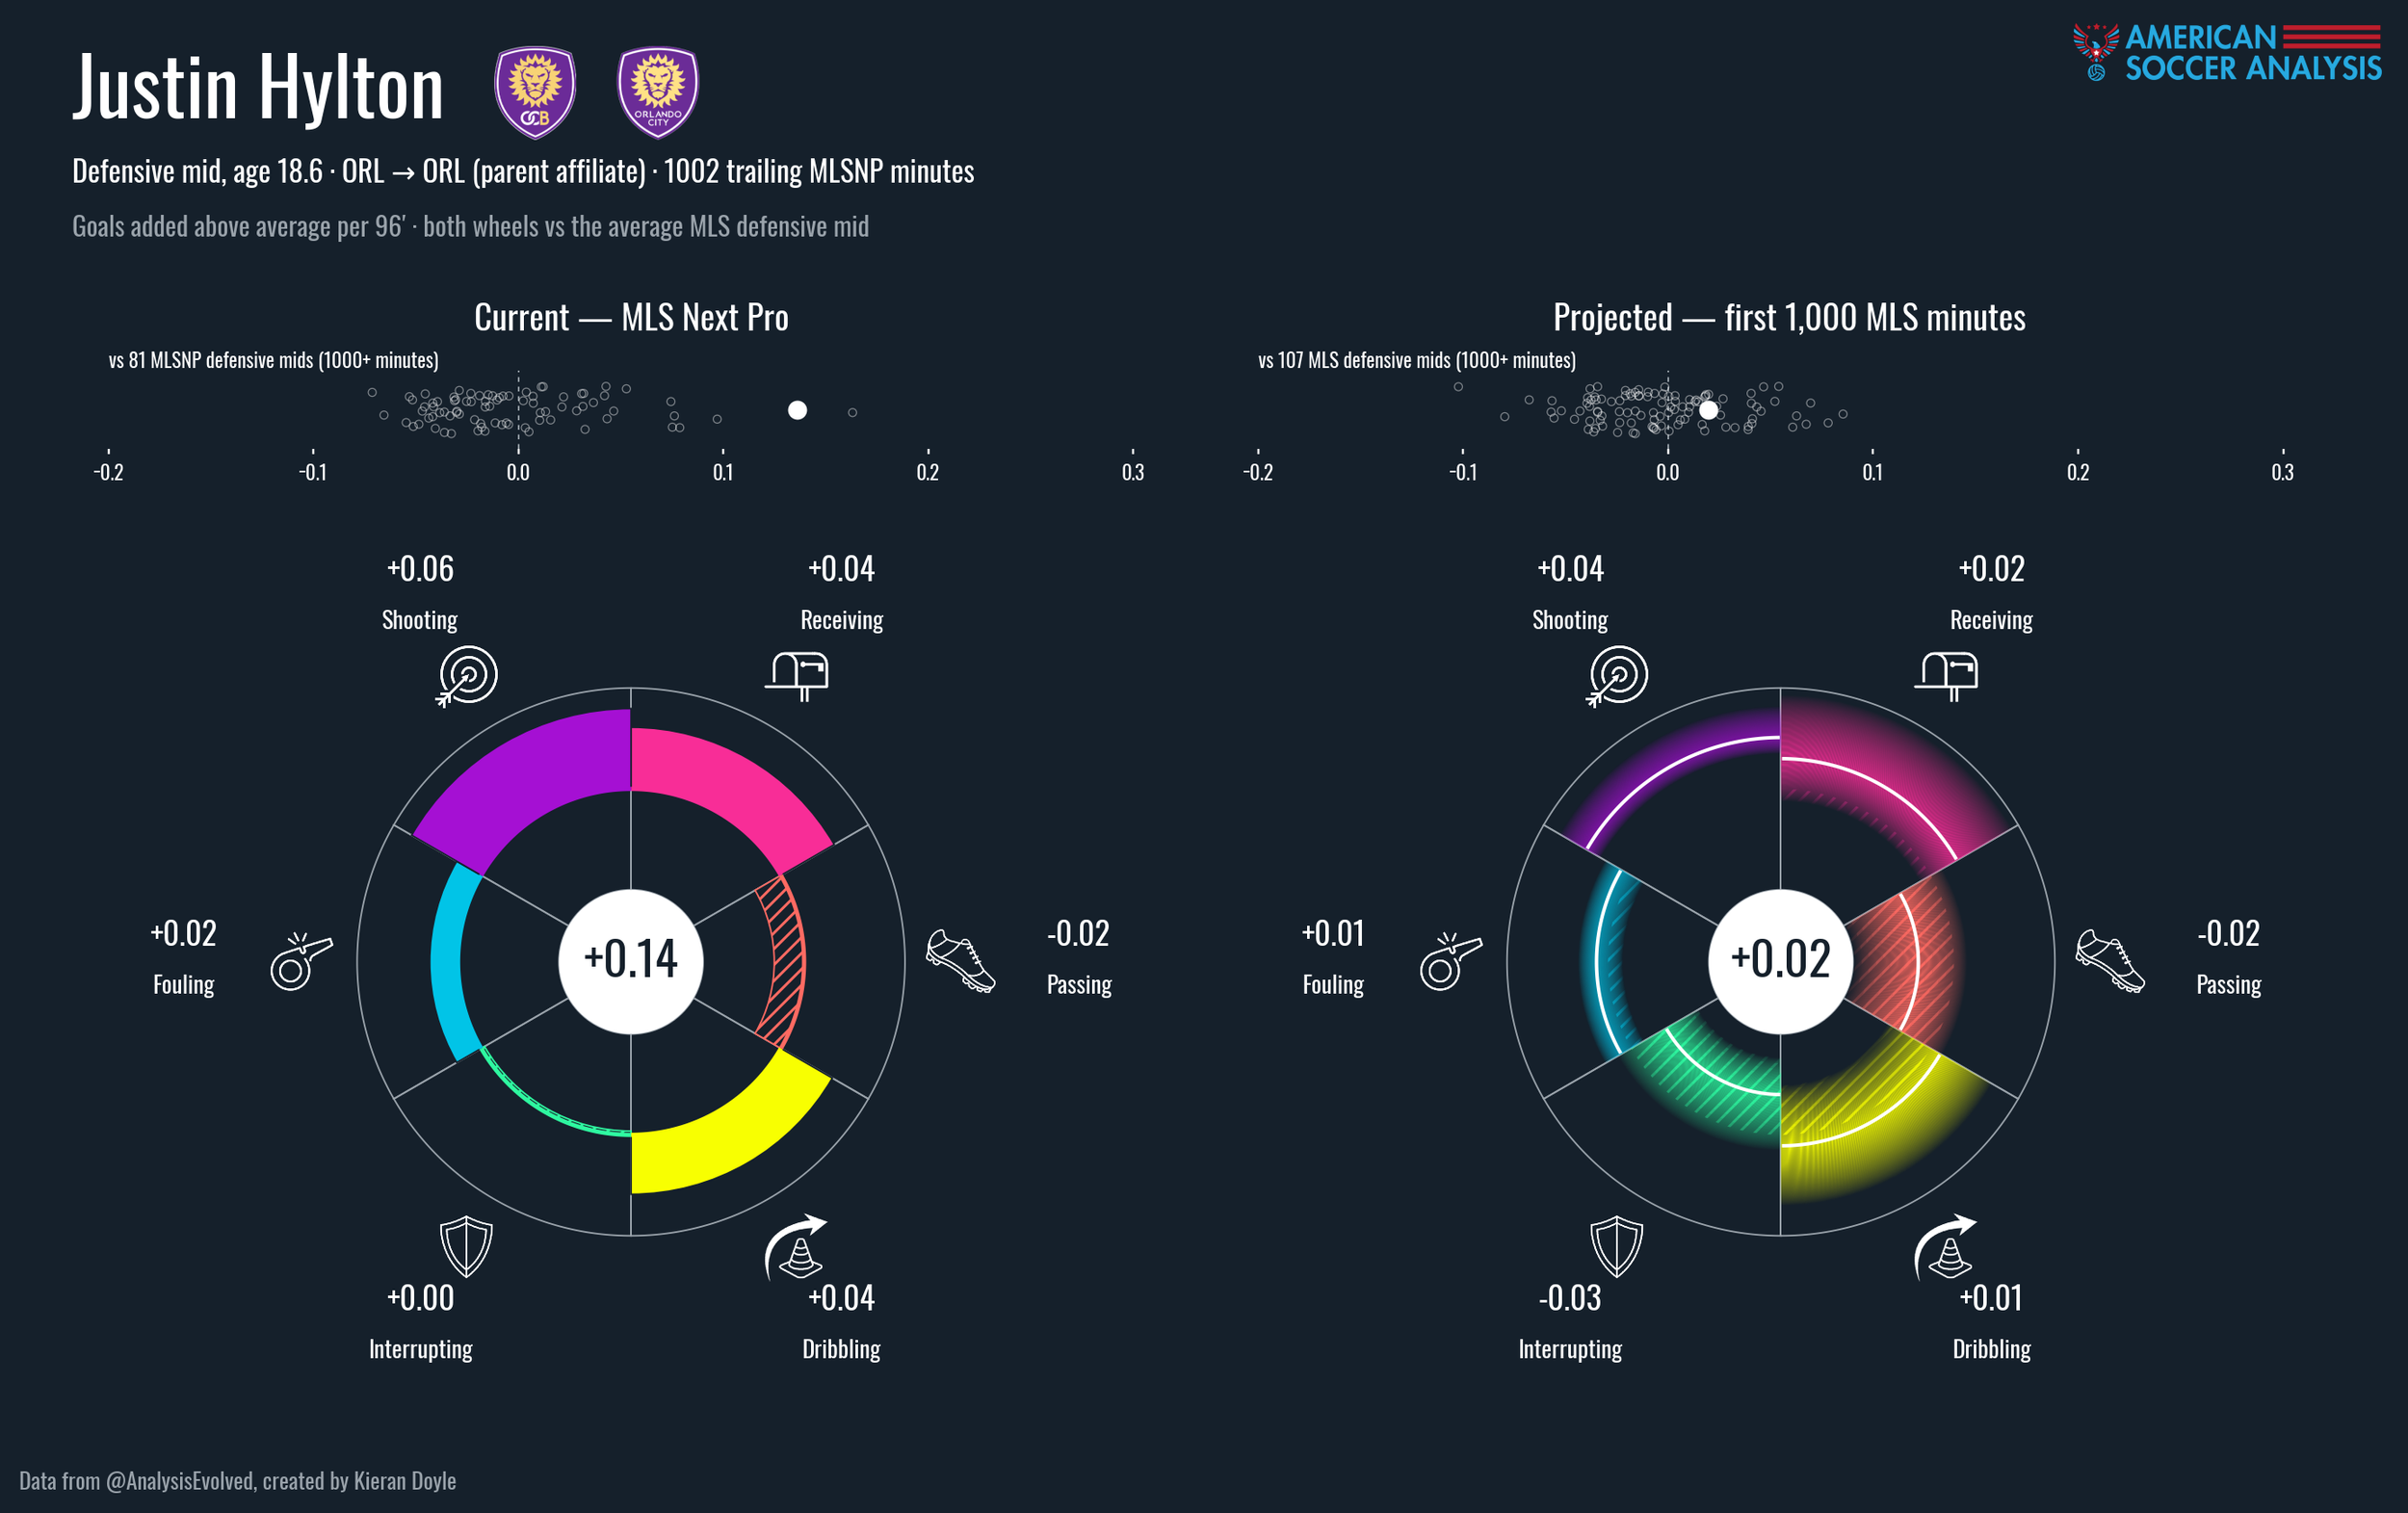
Justin Hylton, DM, 18 - Orlando City
Hylton shows up as one of the best defensive midfielders in MLSNP ever, and it carries over to his MLS projection at an above average +0.02 p96. Most of that is coming from his non-traditional DM skills in shooting, receiving, and dribbling, but midfielder passing is reasonably stable and he gets by. Hylton was formerly of the FC Cincinnati academy, don’t be surprised if they regret missing out on him.
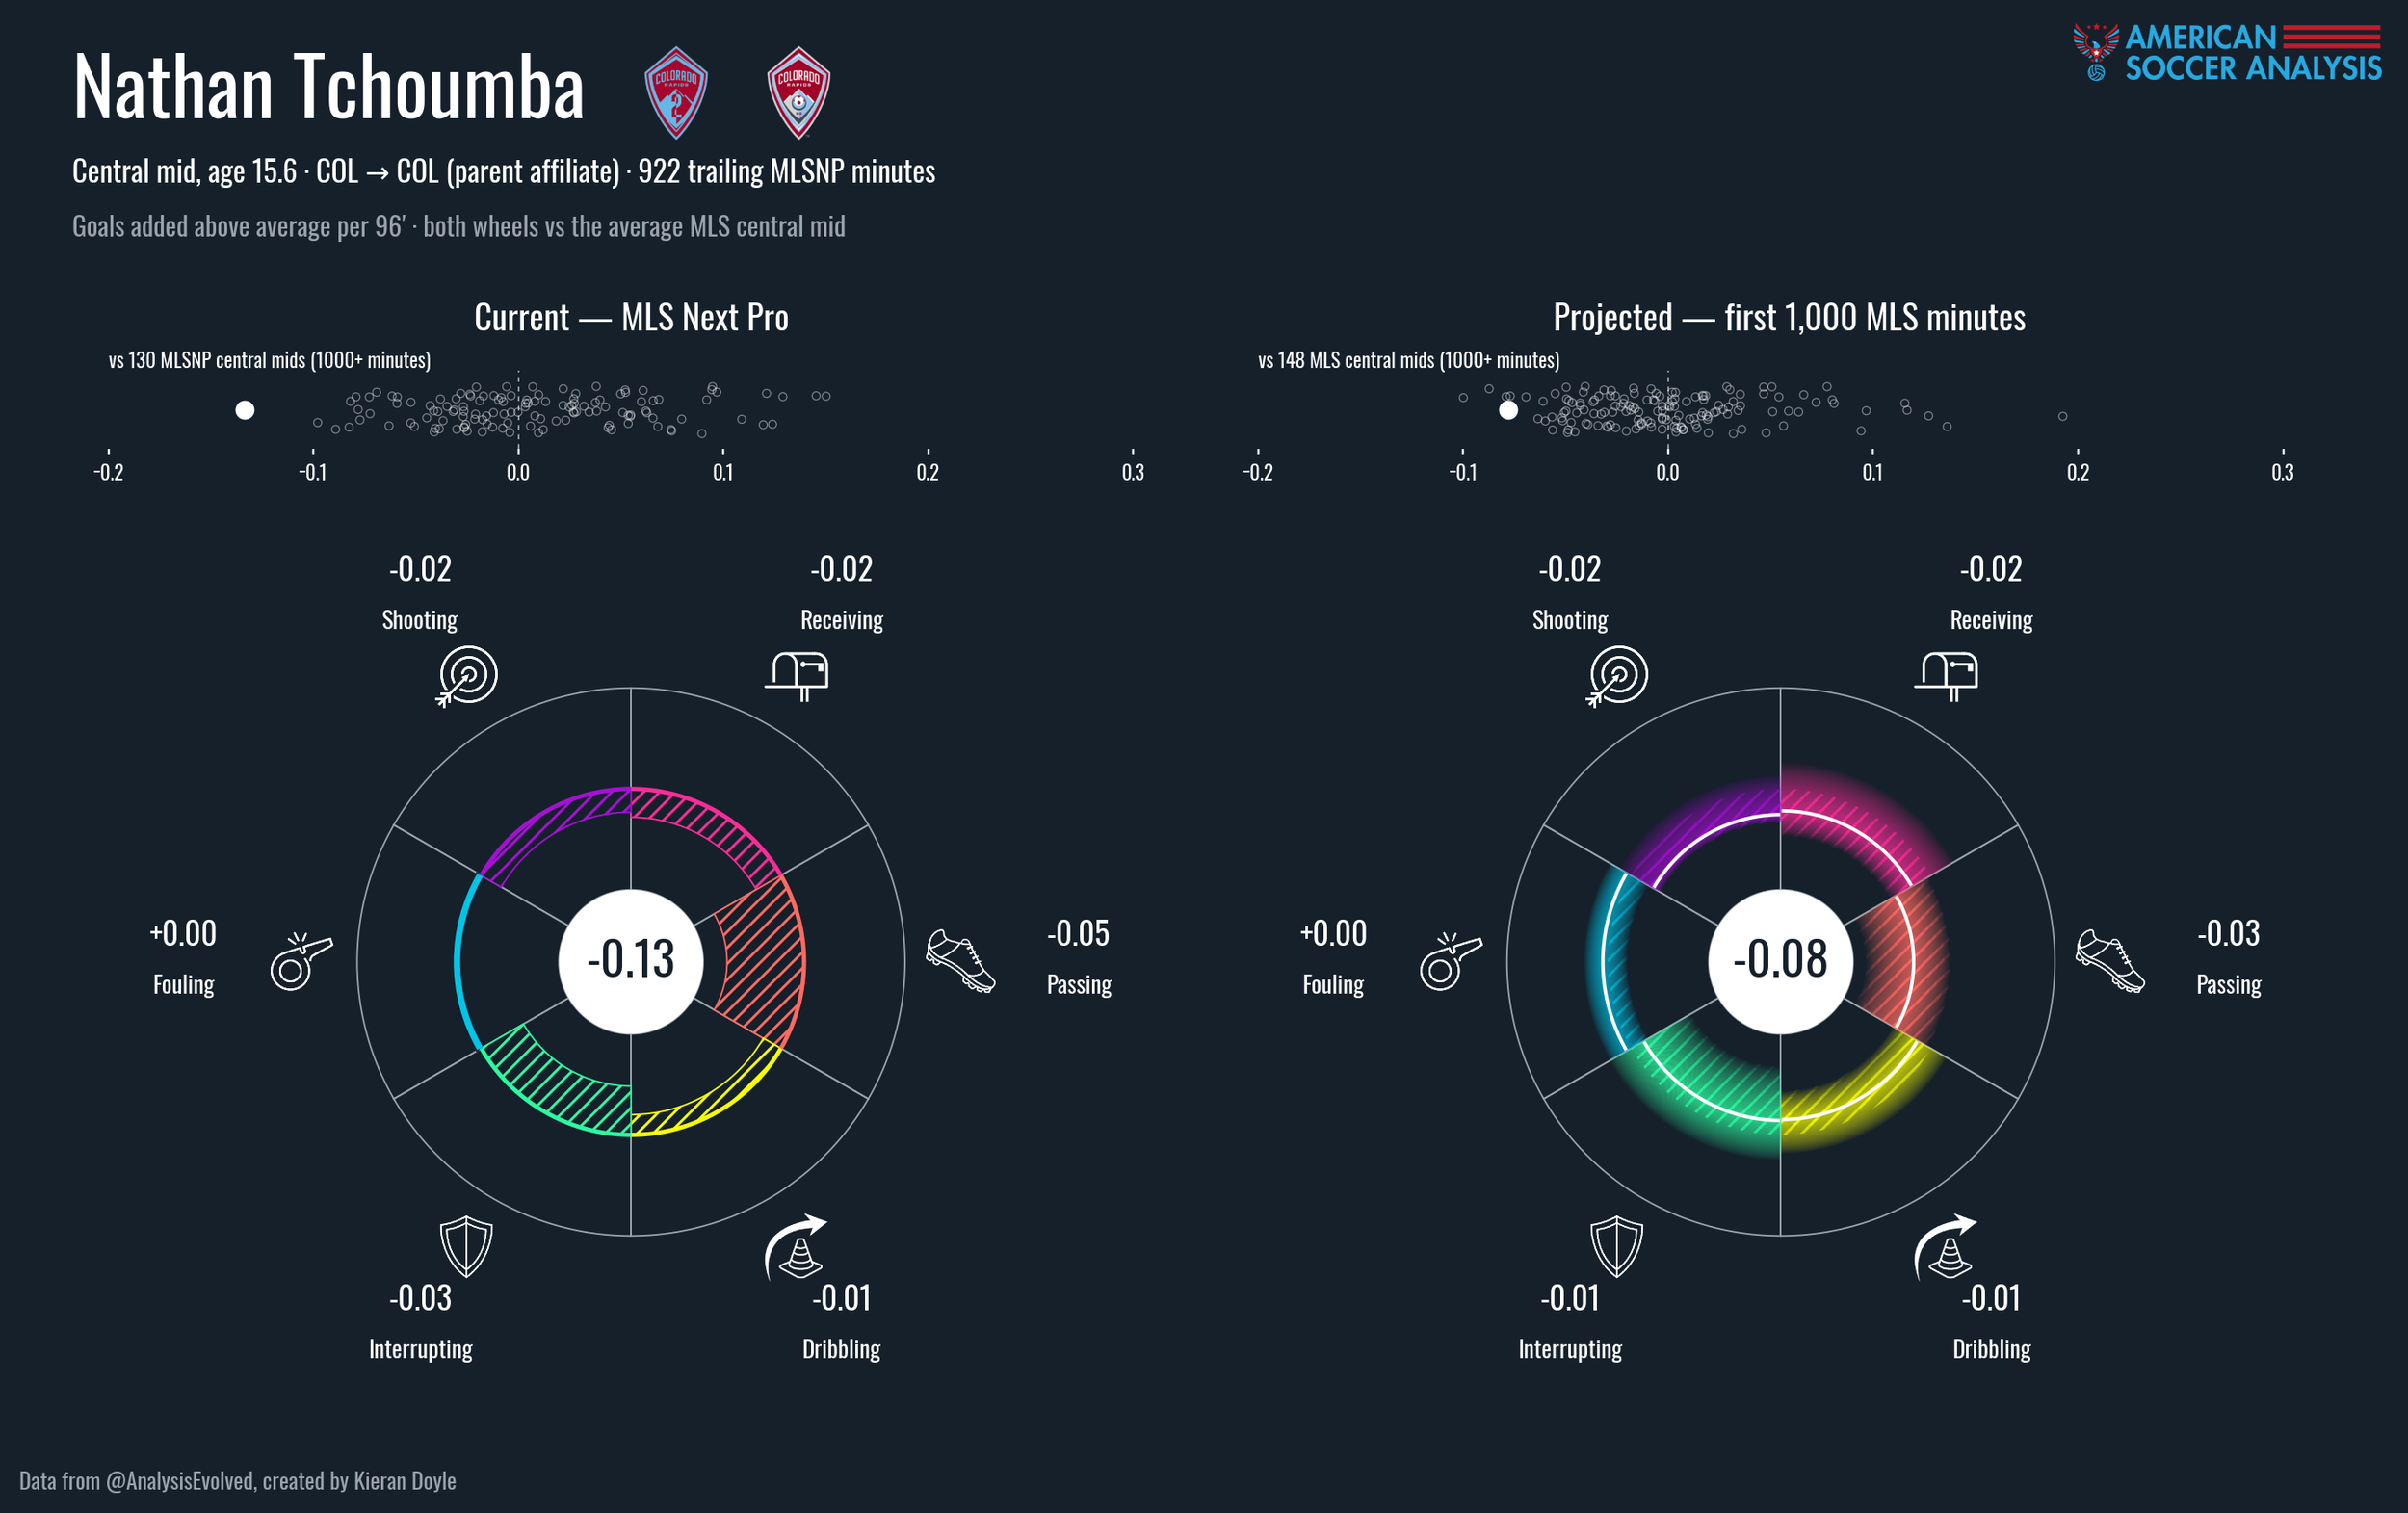
Nathan Tchoumba, CM, 15 - Colorado Rapids
On the flip side, Nathan Tchoumba is a highly touted prospect who isn’t quite ready for senior football yet, despite the praise. His -0.13 g+ p96 in MLSNP is a quite weak mark, so weak that his projection actually adjusts him up towards zero. A lot of that is the implied age curving of a 15 year old getting real minutes already, but this one needs some more time in the oven.
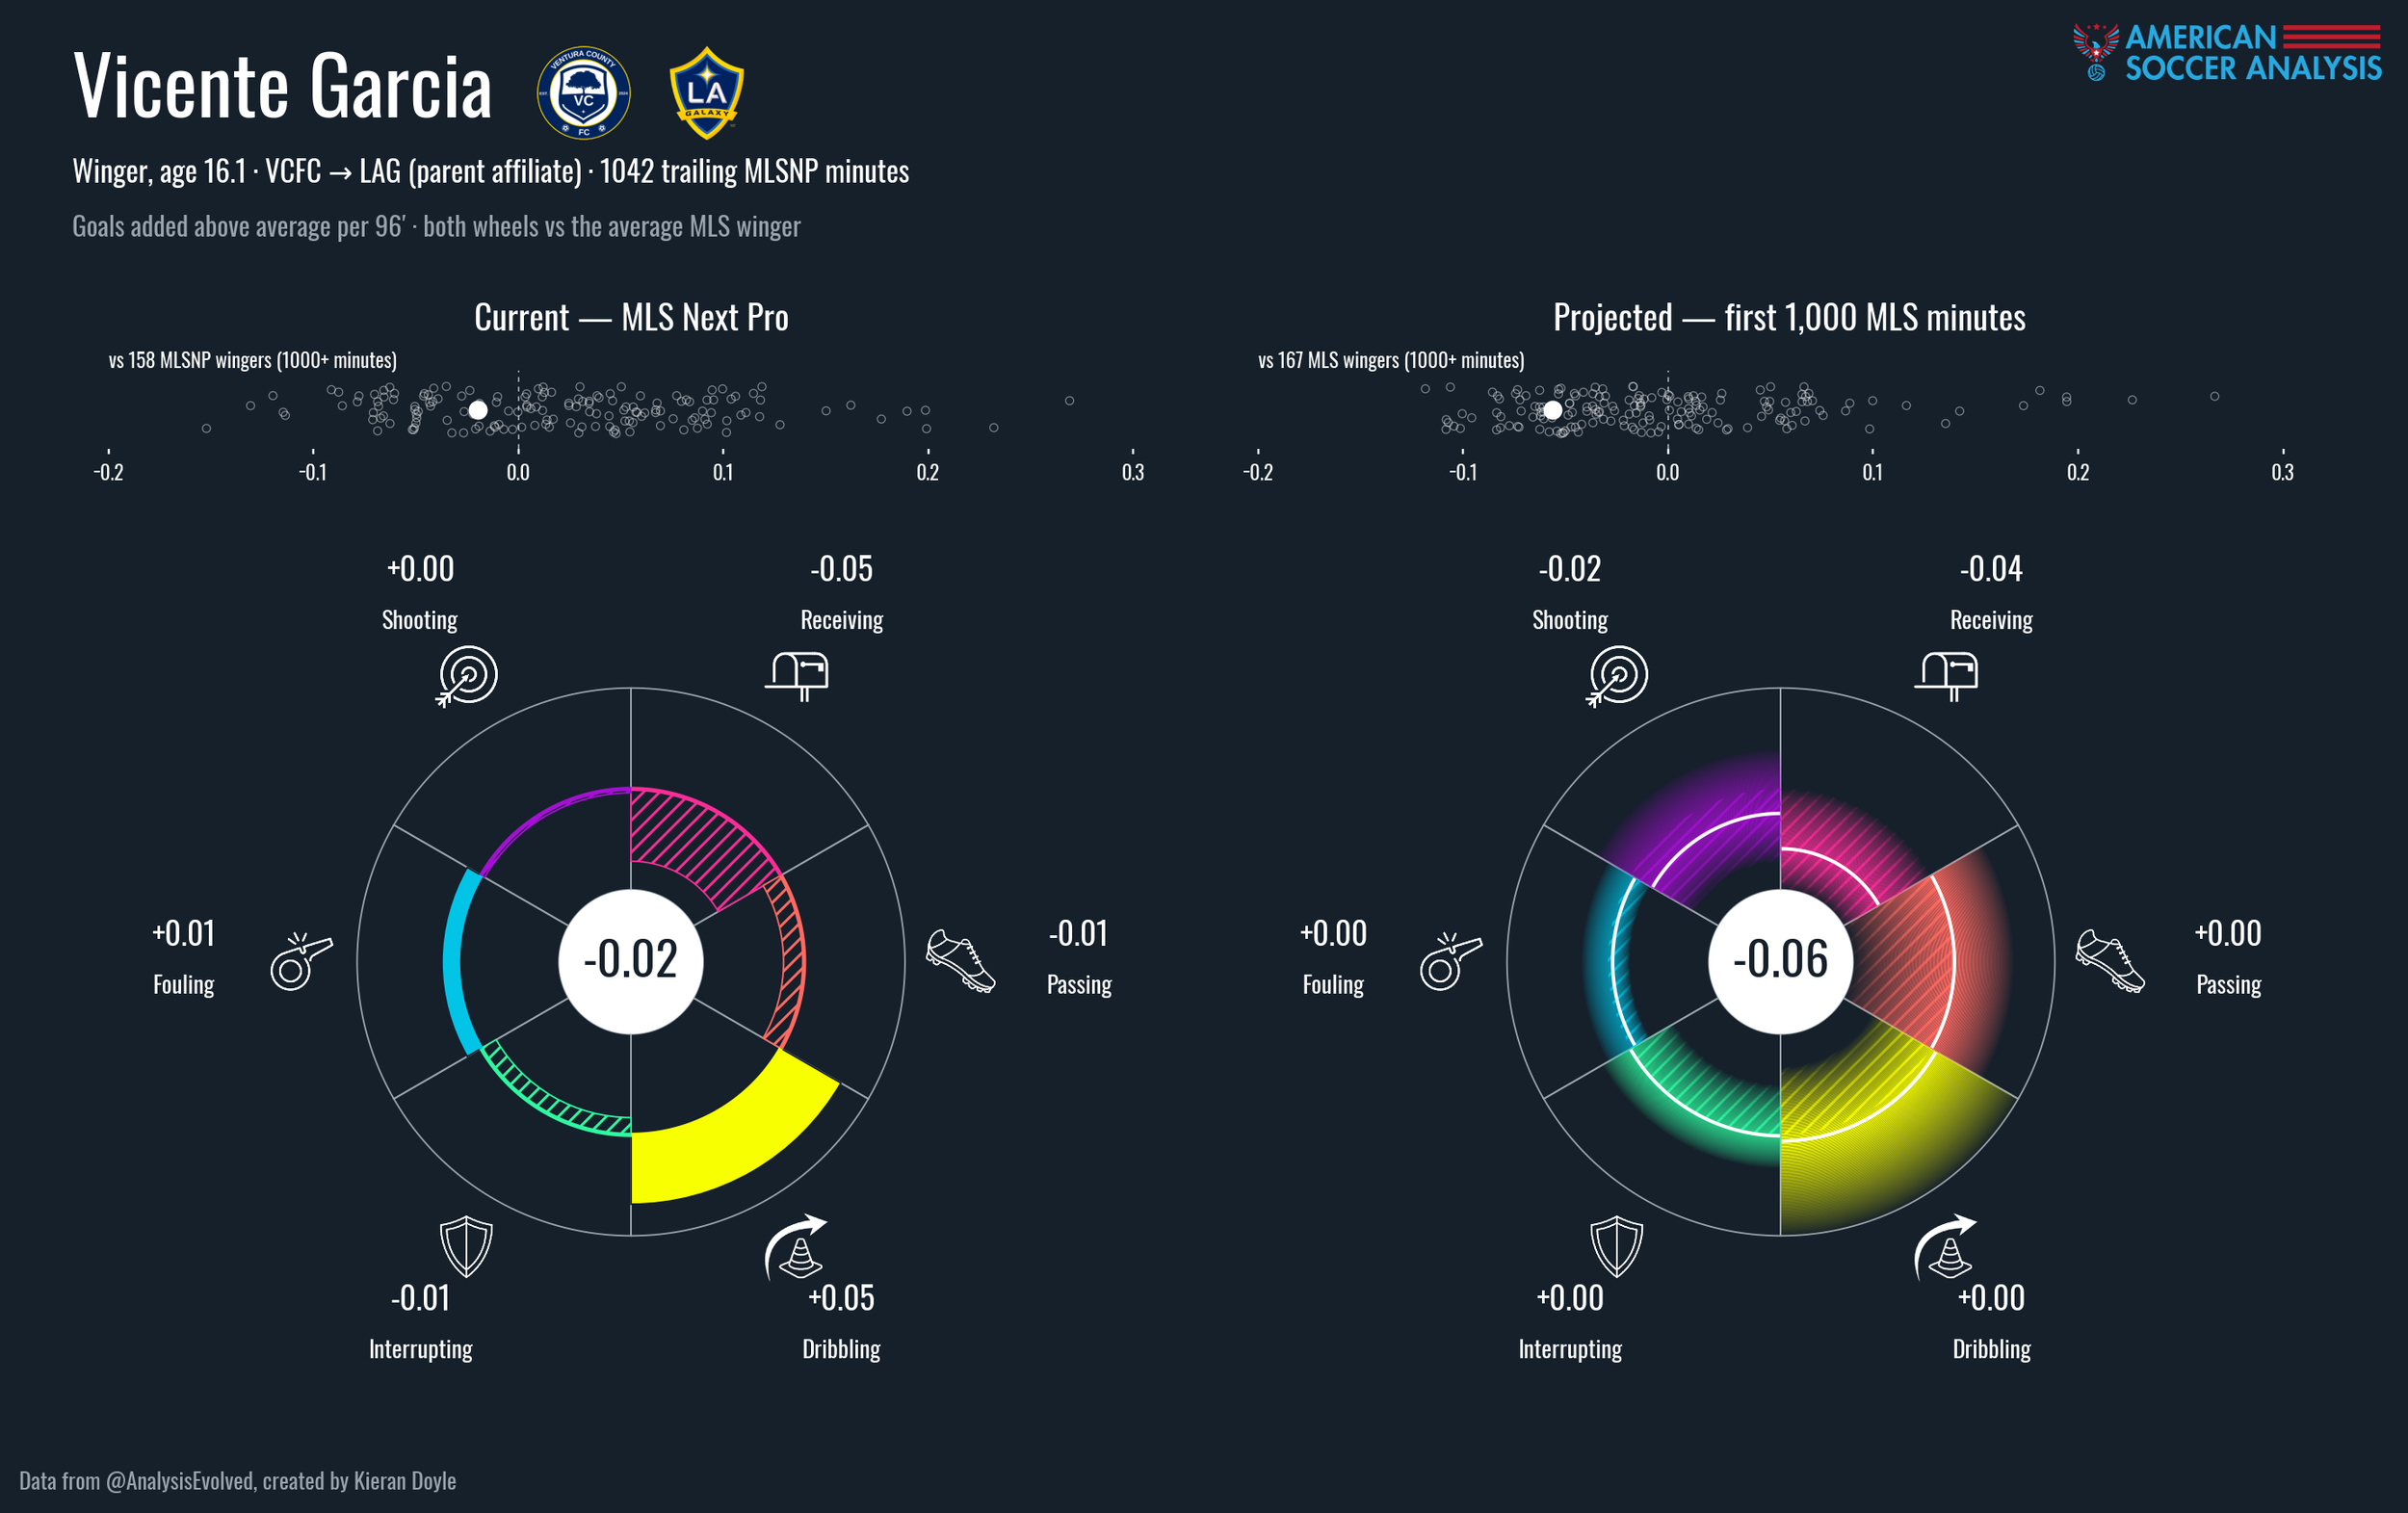
Vicente Garcia, W, 16 - LA Galaxy
Garcia falls in a similar vein, he’s a slightly below average MLSNP winger who projects as firmly not ready for MLS play yet. I included this one specifically because Chelsea just spent at least $3M on him joining up in two years time. Scouts like him a lot more than the data, I’ll say.
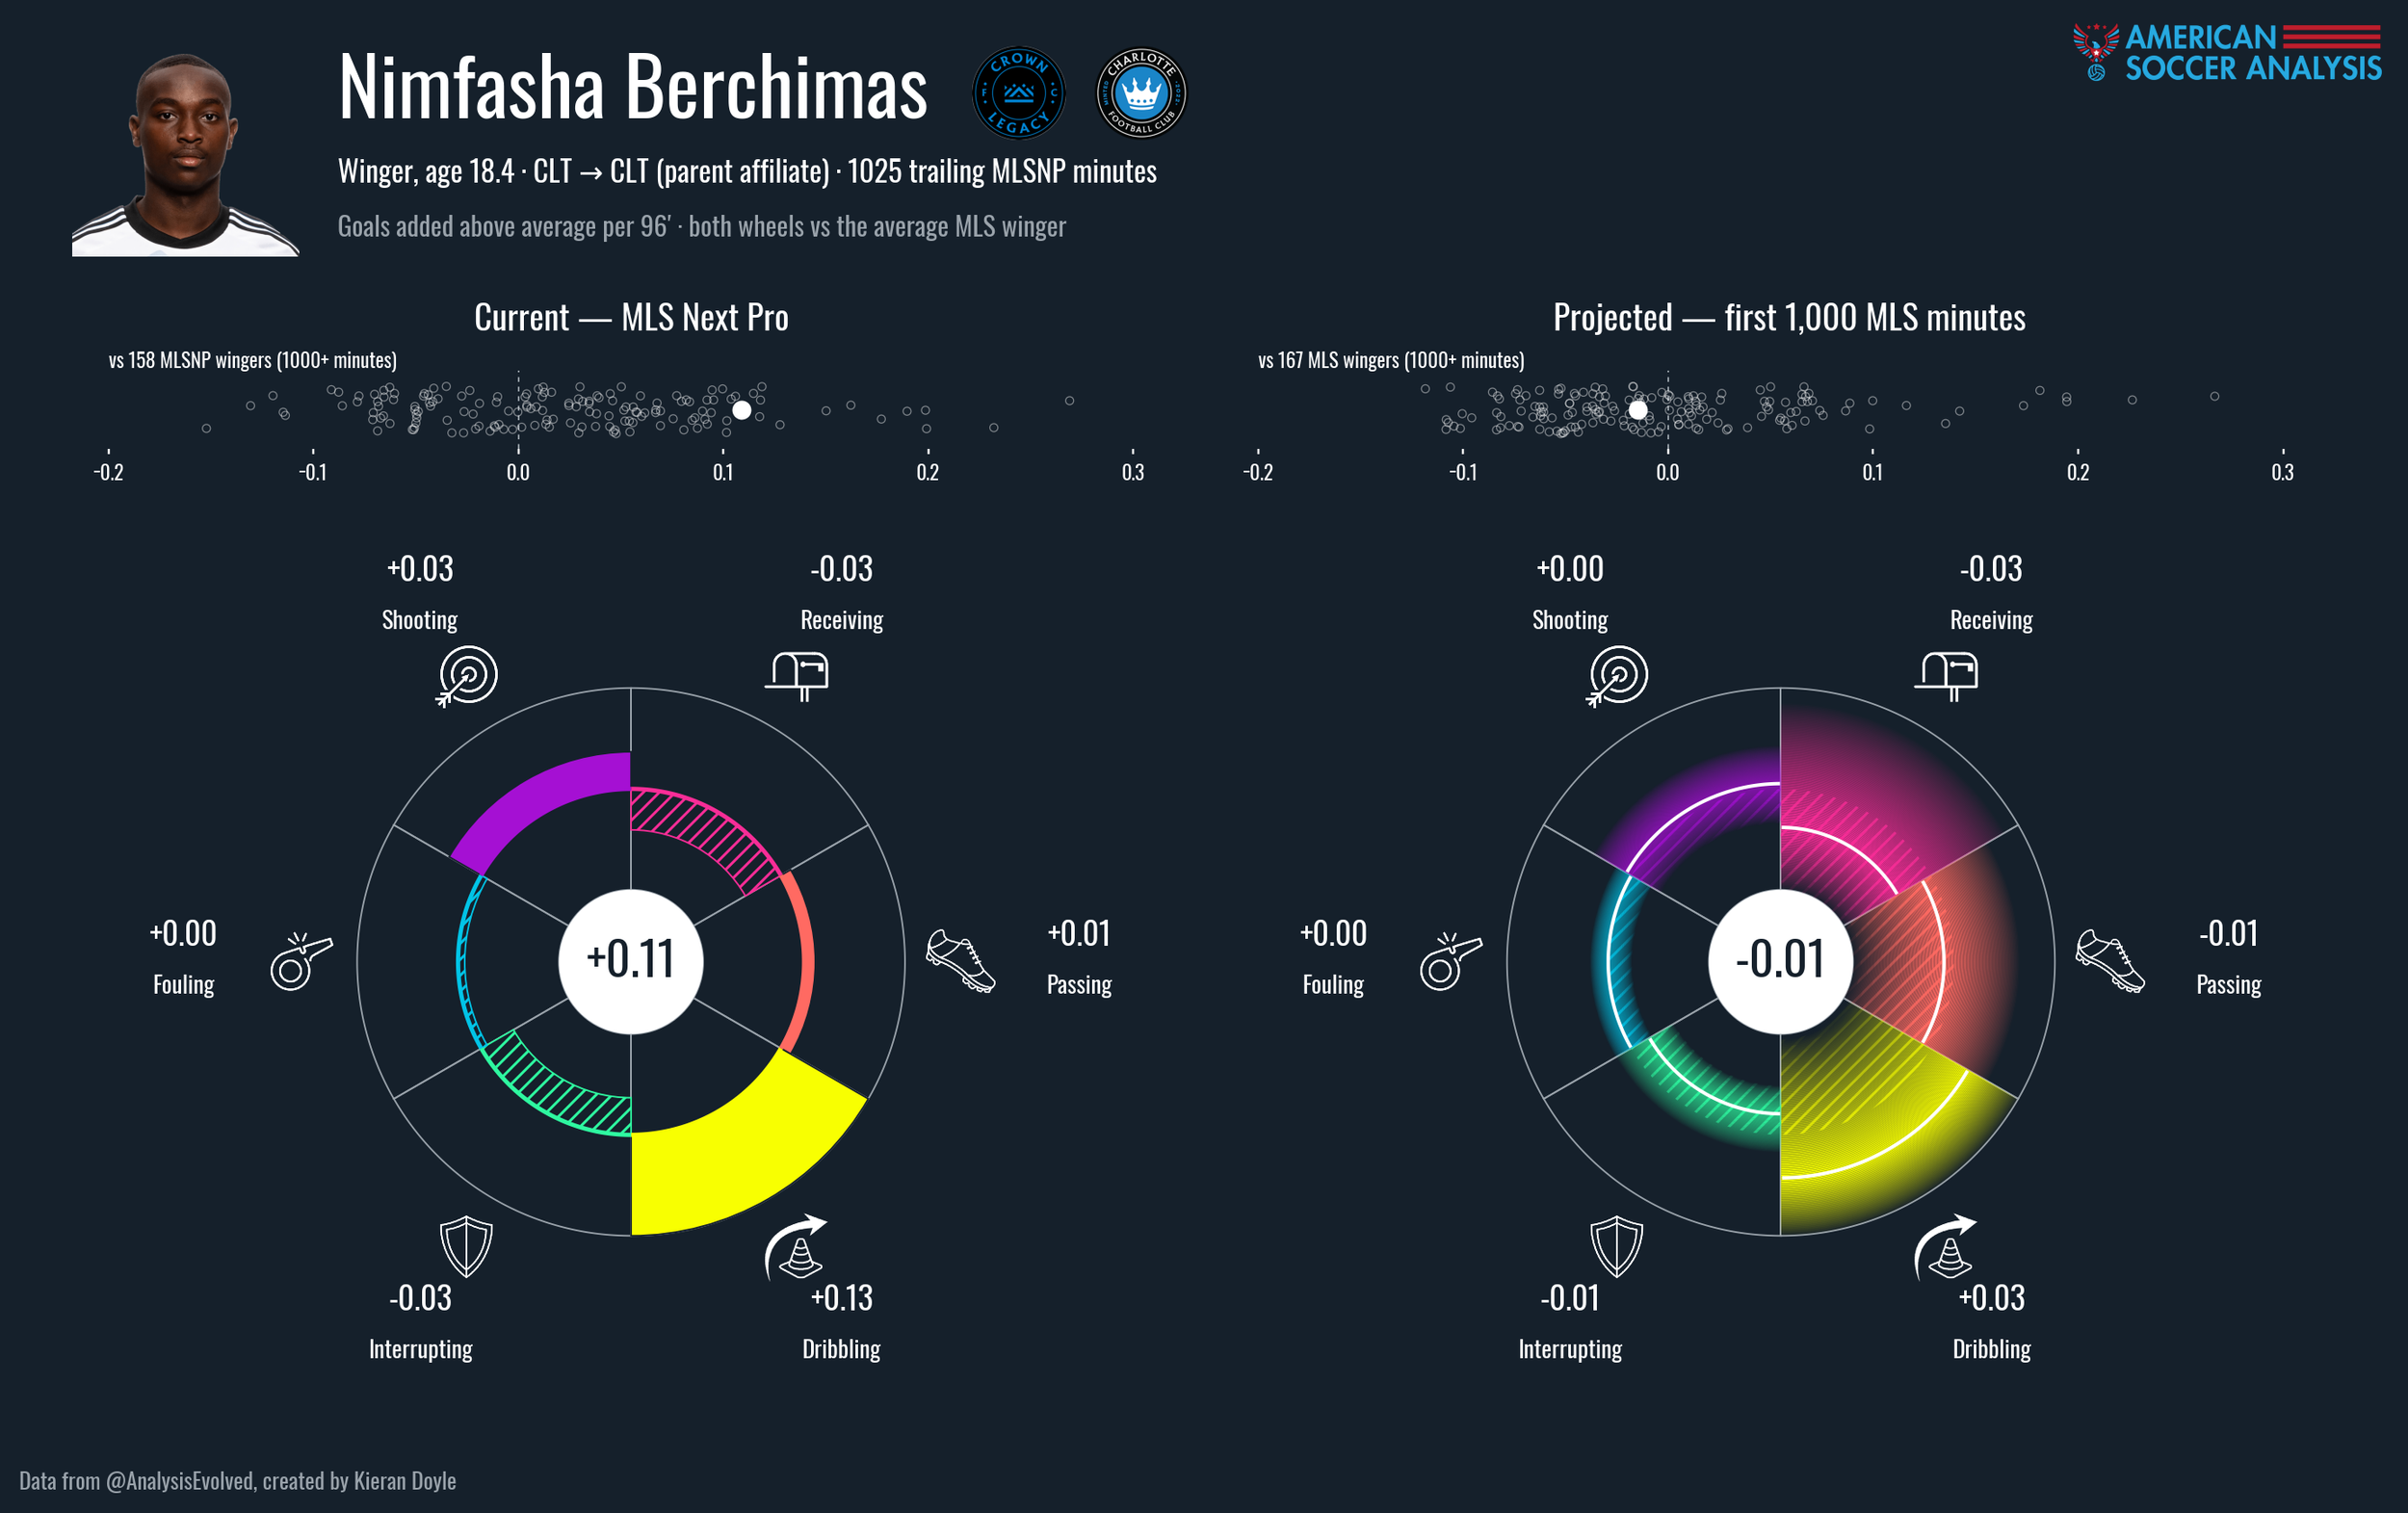
Nimfasha Berchimas, W, 18 - Charlotte FC
Now, this is one I don’t get why he hasn’t played yet. Berchimas is a baller in Next Pro who projects as an about average winger by his overall production, but still very good at his one truly elite skill. Get the ball, dribble past guys and carry it forward. Charlotte have been a very dribbly winger team, previously with Wilfred Zaha and now with Allan Saint-Maximin, it is surprising to me that we haven’t seen at least some minutes doing exactly that role from Berchimas.
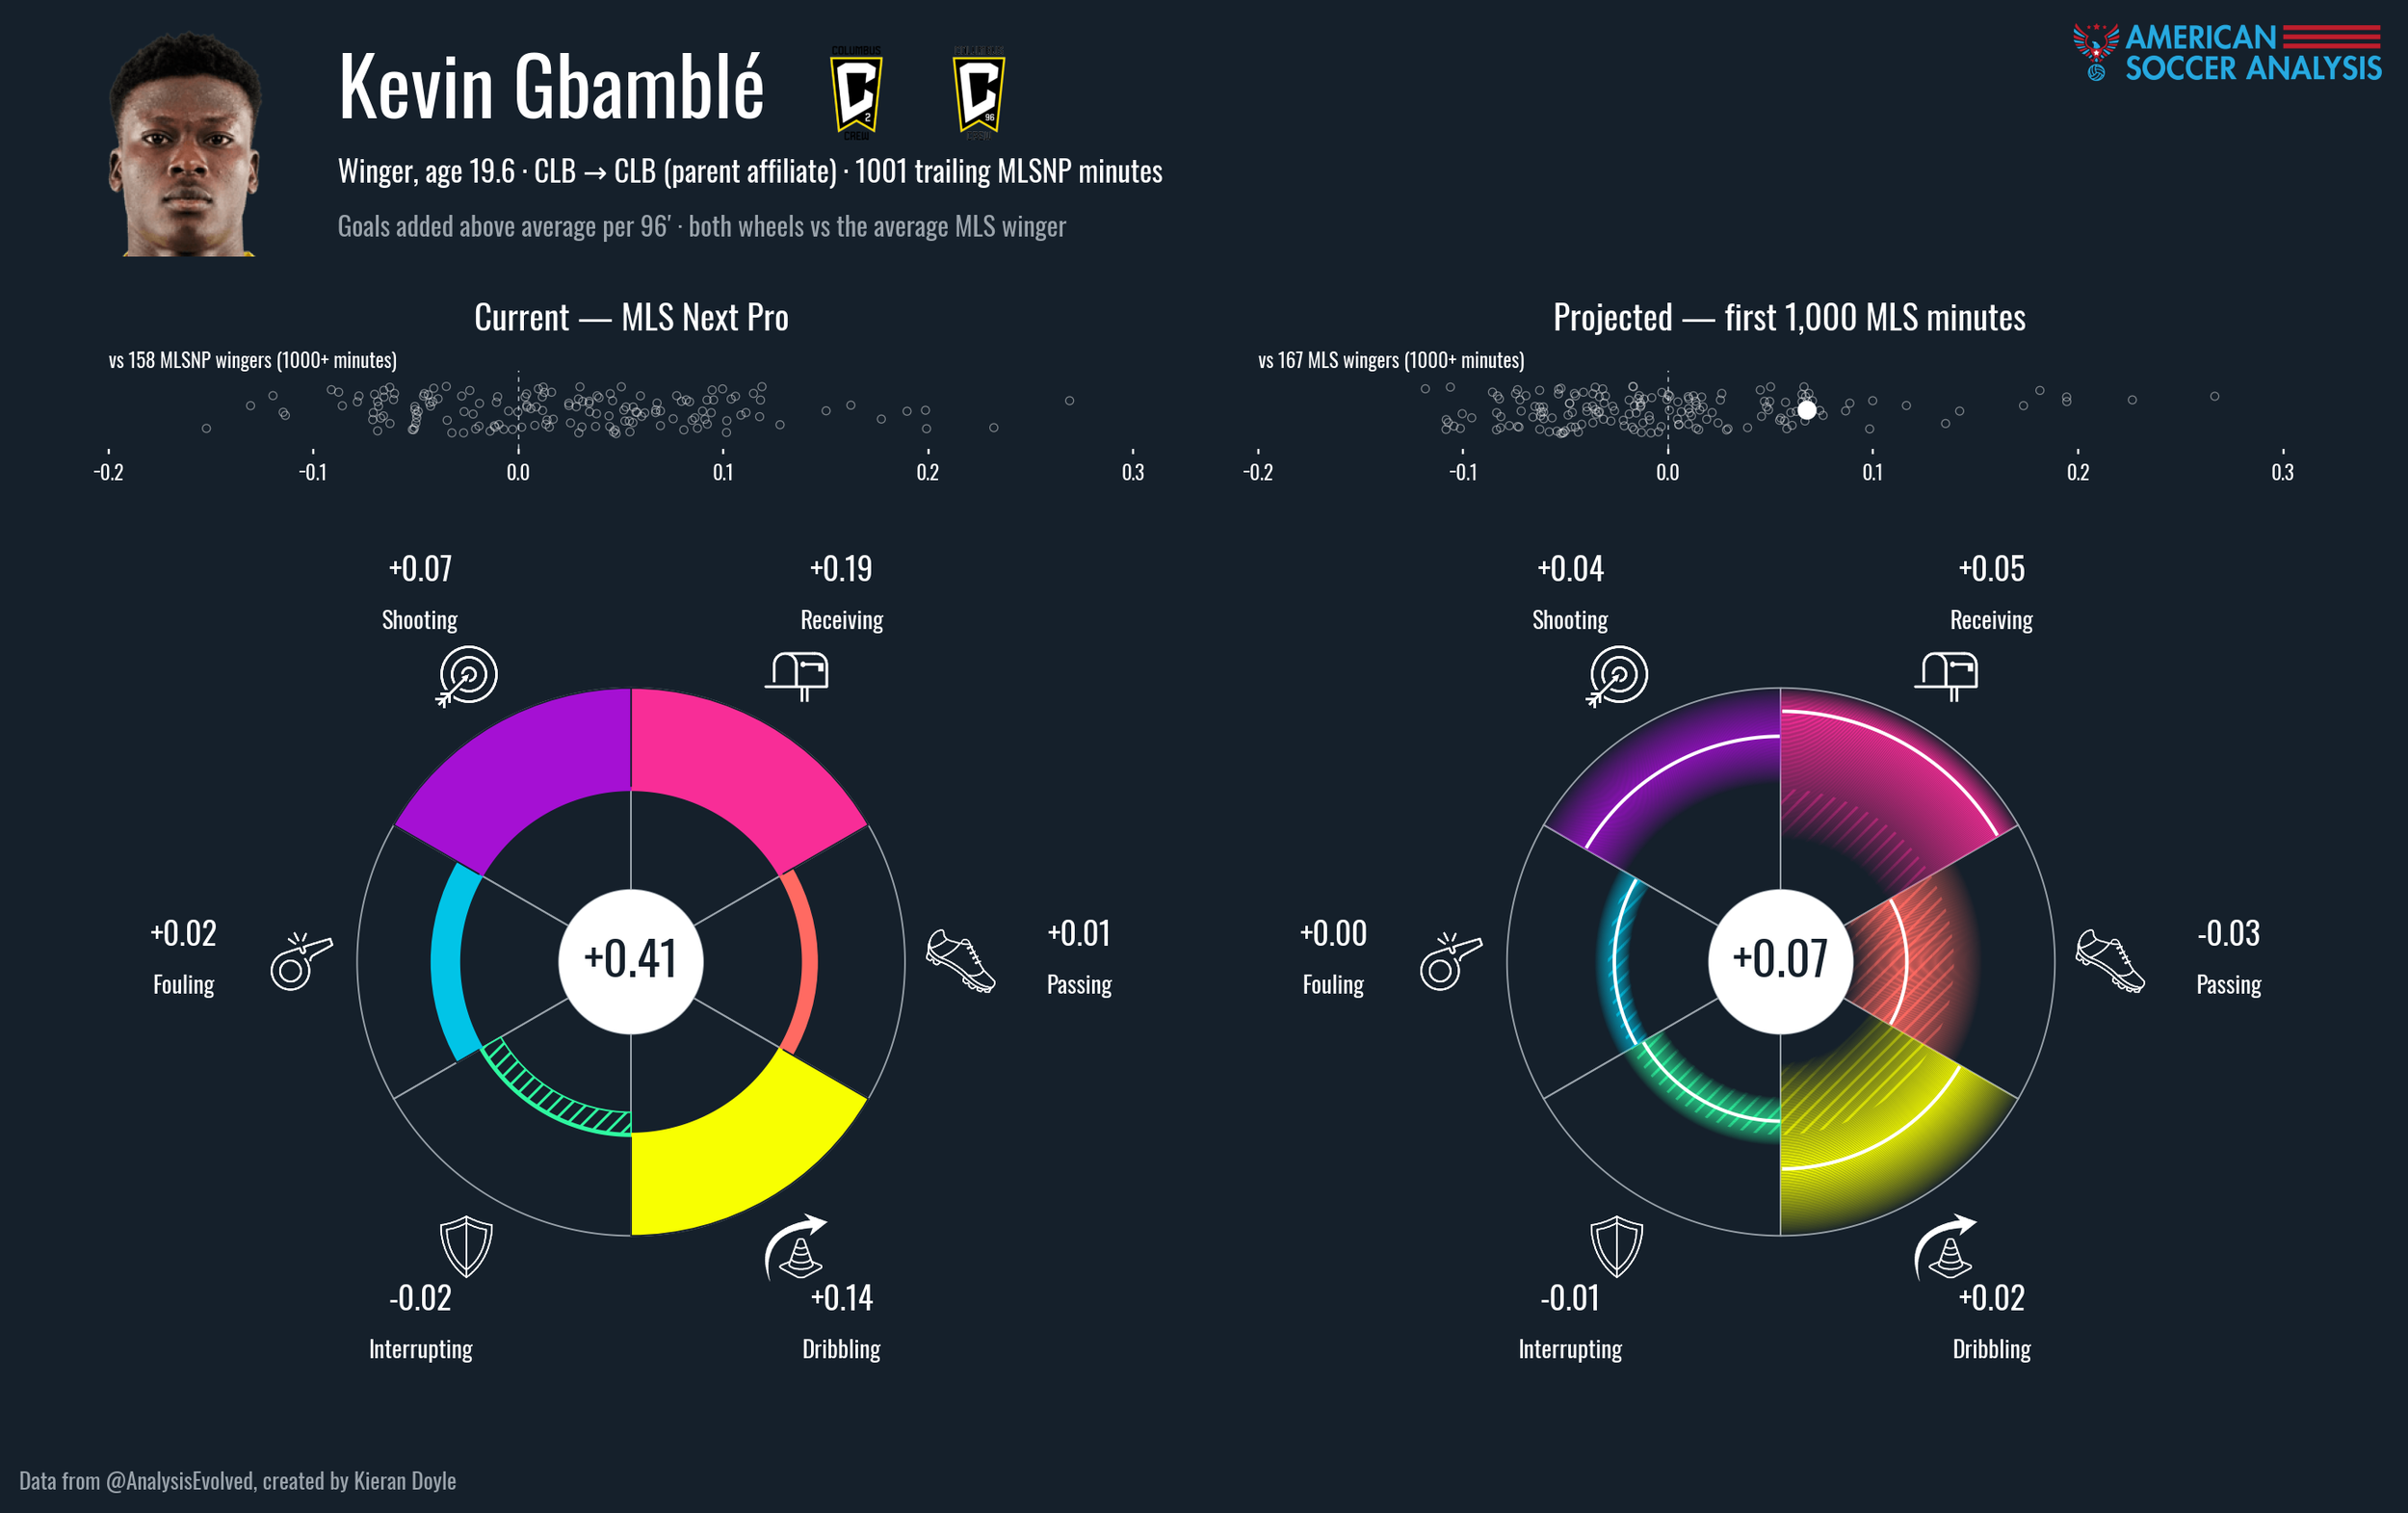
Kevin Gbamble, W, 19 - Columbus Crew
Gbamble is the highest scoring g+ player in the dataset, and his projection has him as a TAM level attacker already. Gbamble joined Crew 2 via loan from the Ivory Coast last year before signing permanently this year, so I’m sure there are some international slot shenanigans at play, but it is inconceivable to me that he hasn’t gotten first team looks yet. His Next Pro g+ is so good it’s not even on the bee swarm!
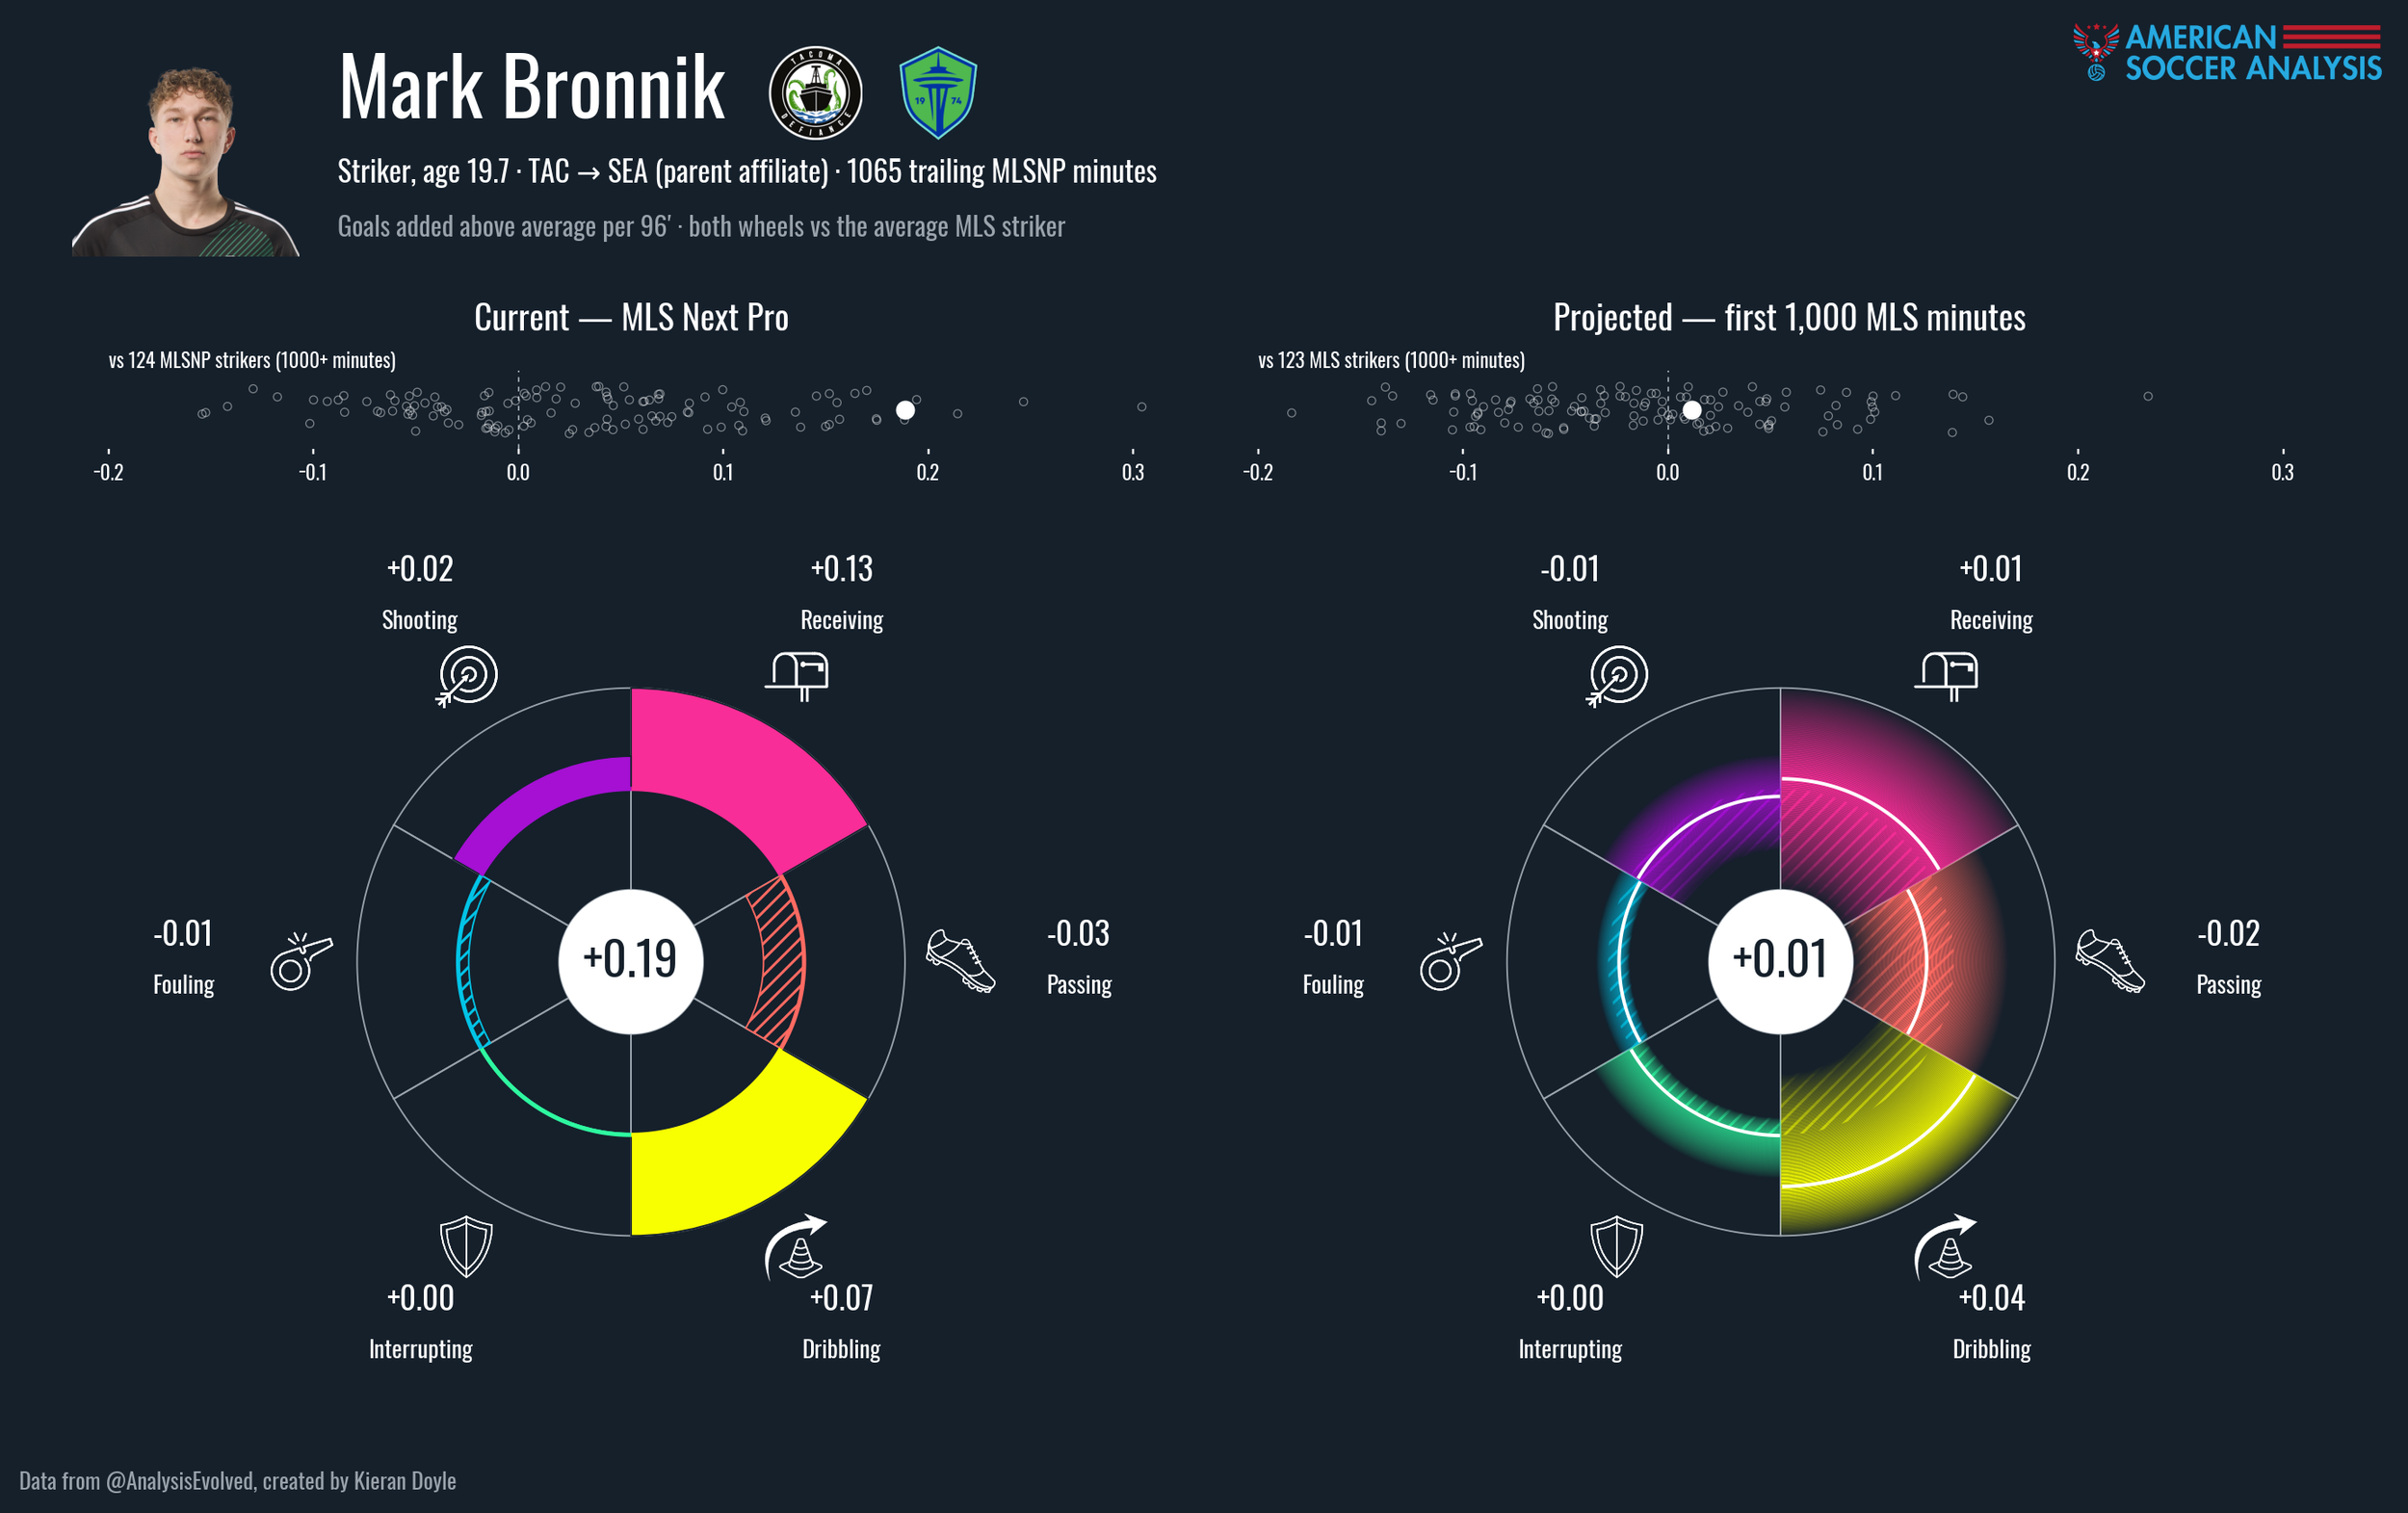
Mark Bronnik, ST, 19 - Seattle Sounders
Bronnik is one of my favourite prospects in the entire US ecosystem at the moment. Ethnic Brooklyn teams to NYRB Academy, to the Barca Residence Academy in Arizona where he destroyed MLS Next, to Union Omaha (purportedly a quite big analytics practicing club hmm) where he destroyed USL1, to Tacoma where he is currently destroying MLSNP. Kid’s legit! Model has him slightly above a league average striker. Pretty, pretty good.
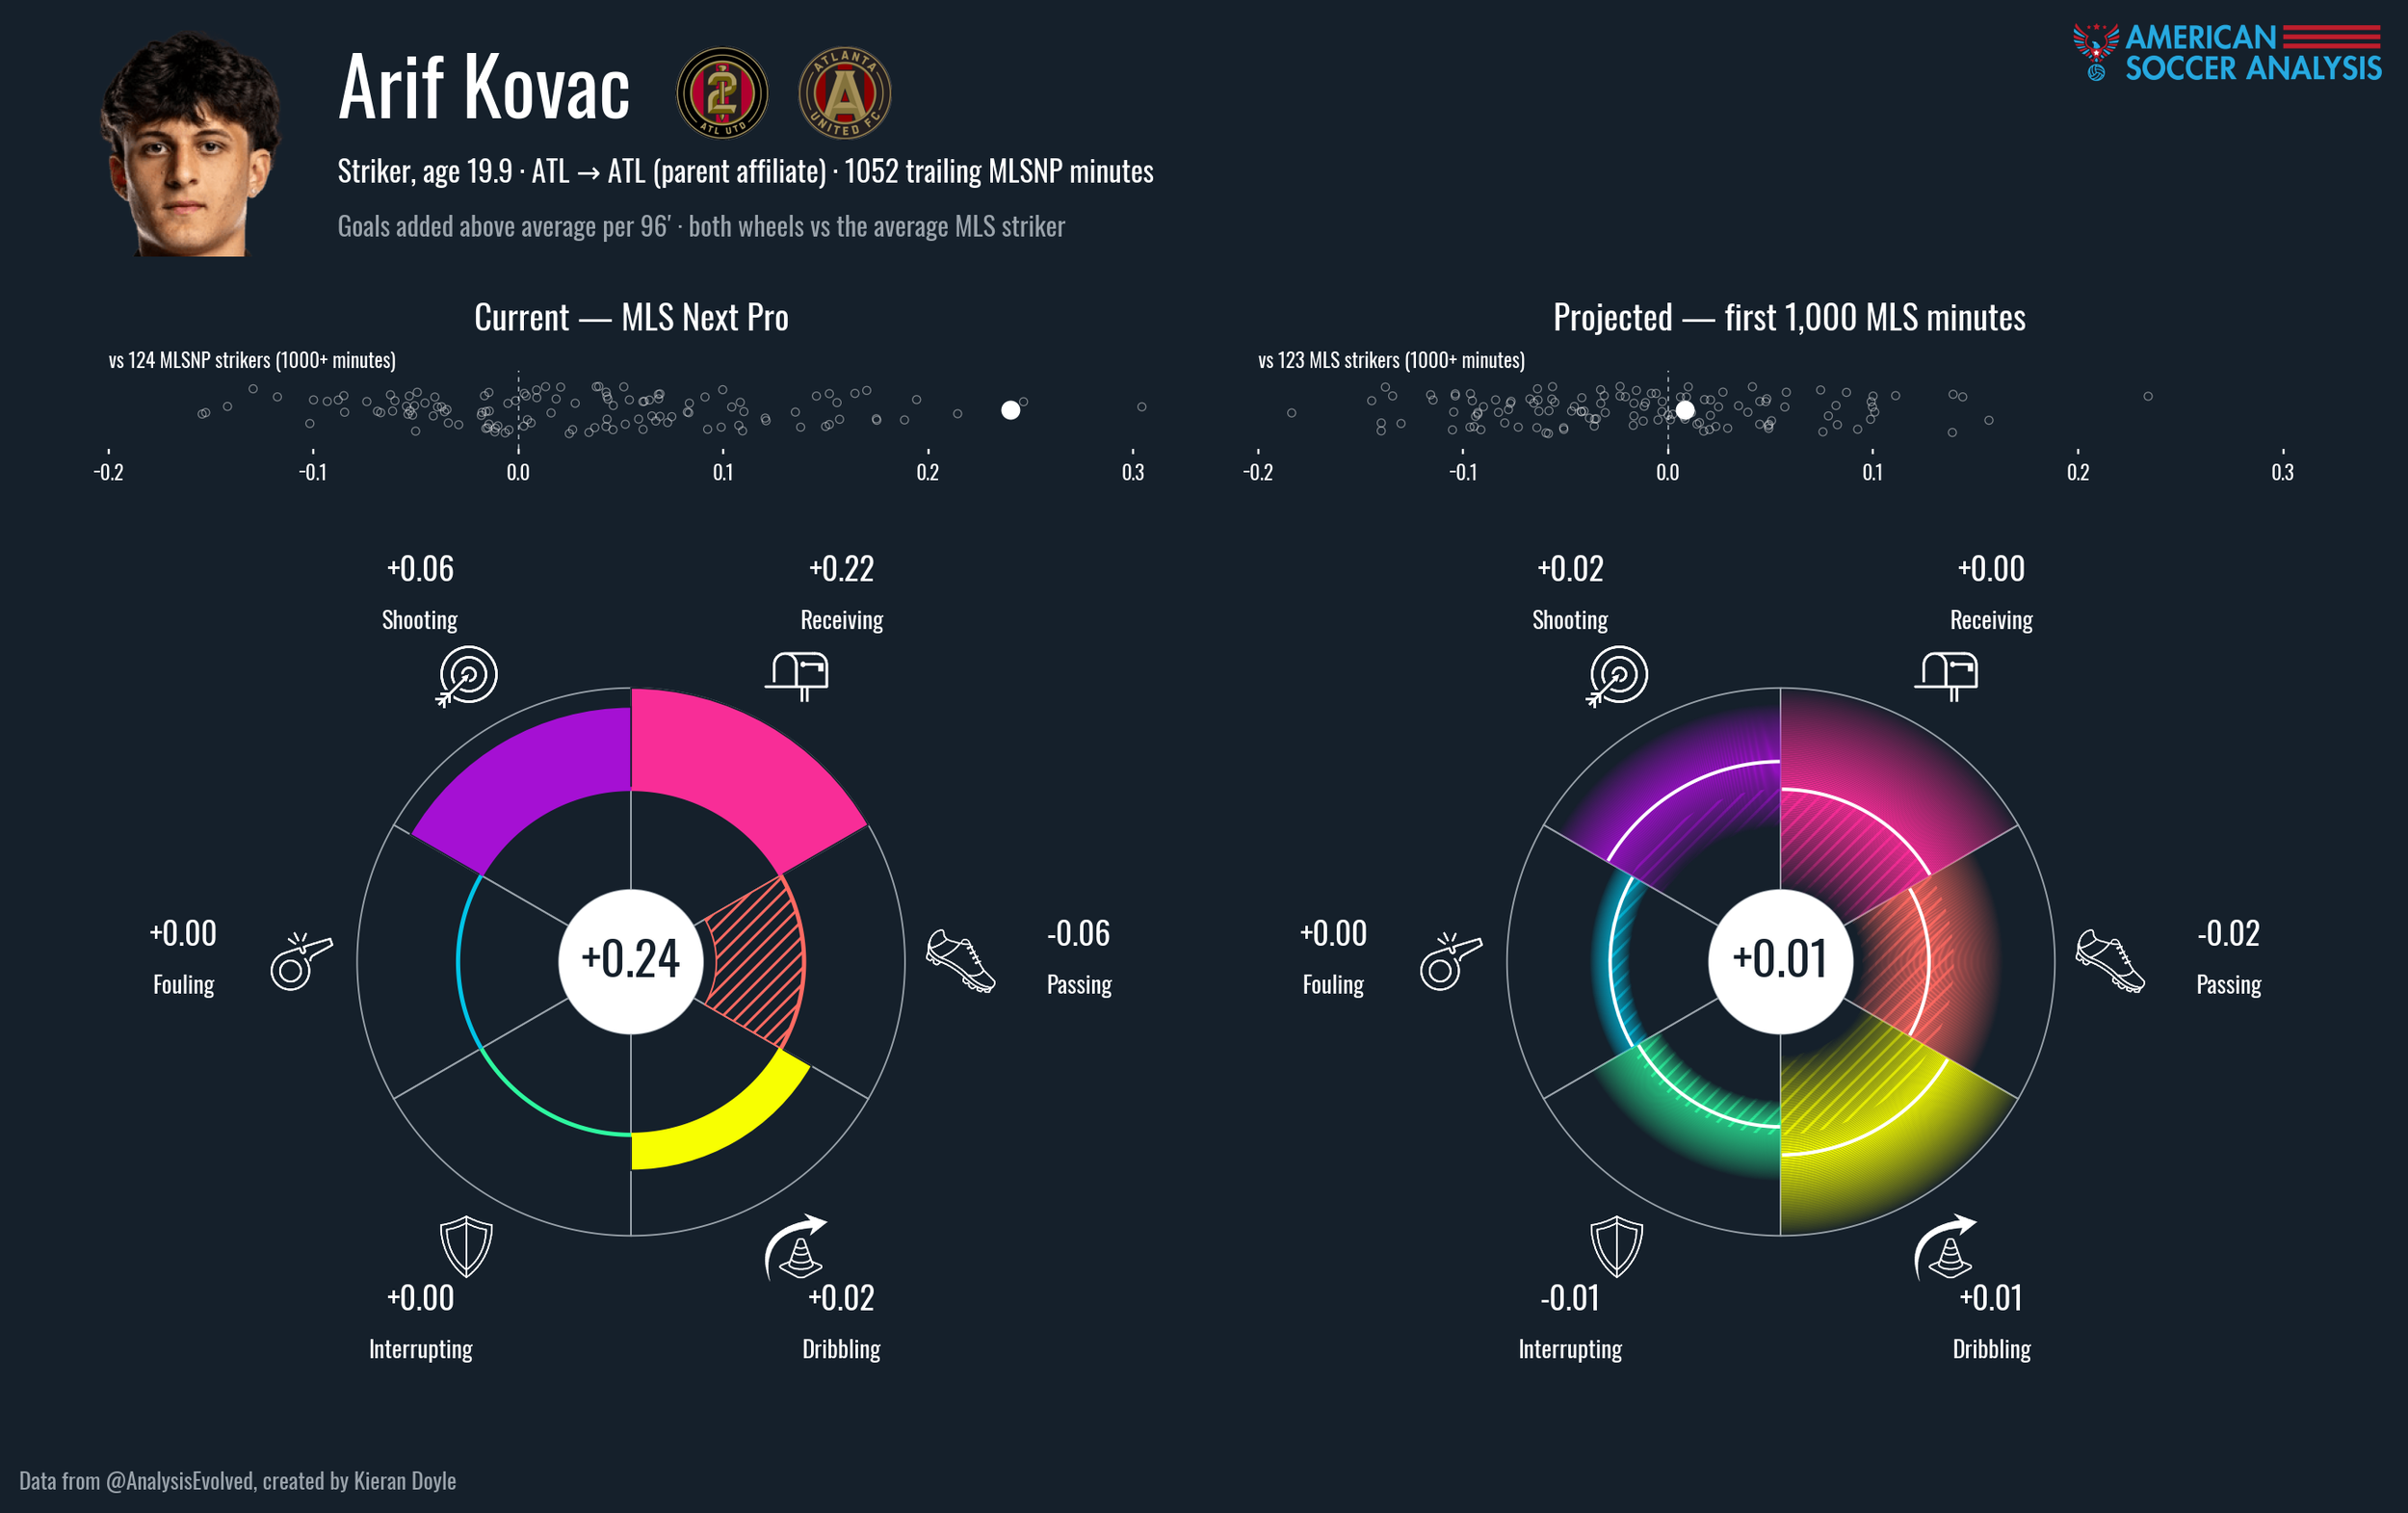
Arif Kovac, ST, 19 - Atlanta United
6 feet 6 inches tall, scores goals for fun, great touch for a big man. Model has him slightly above average, mostly because it has no idea how to handle these gargantuan receiving numbers from MLSNP guys. I get Atlanta going all in on Big Coffee and then Embolo, but again, I’m surprised we’ve only seen six MLS minutes thus far.
Back Testing
On the flip side of this, we have a bunch of guys that have already played MLS games and we can go back and see how the model handled them.
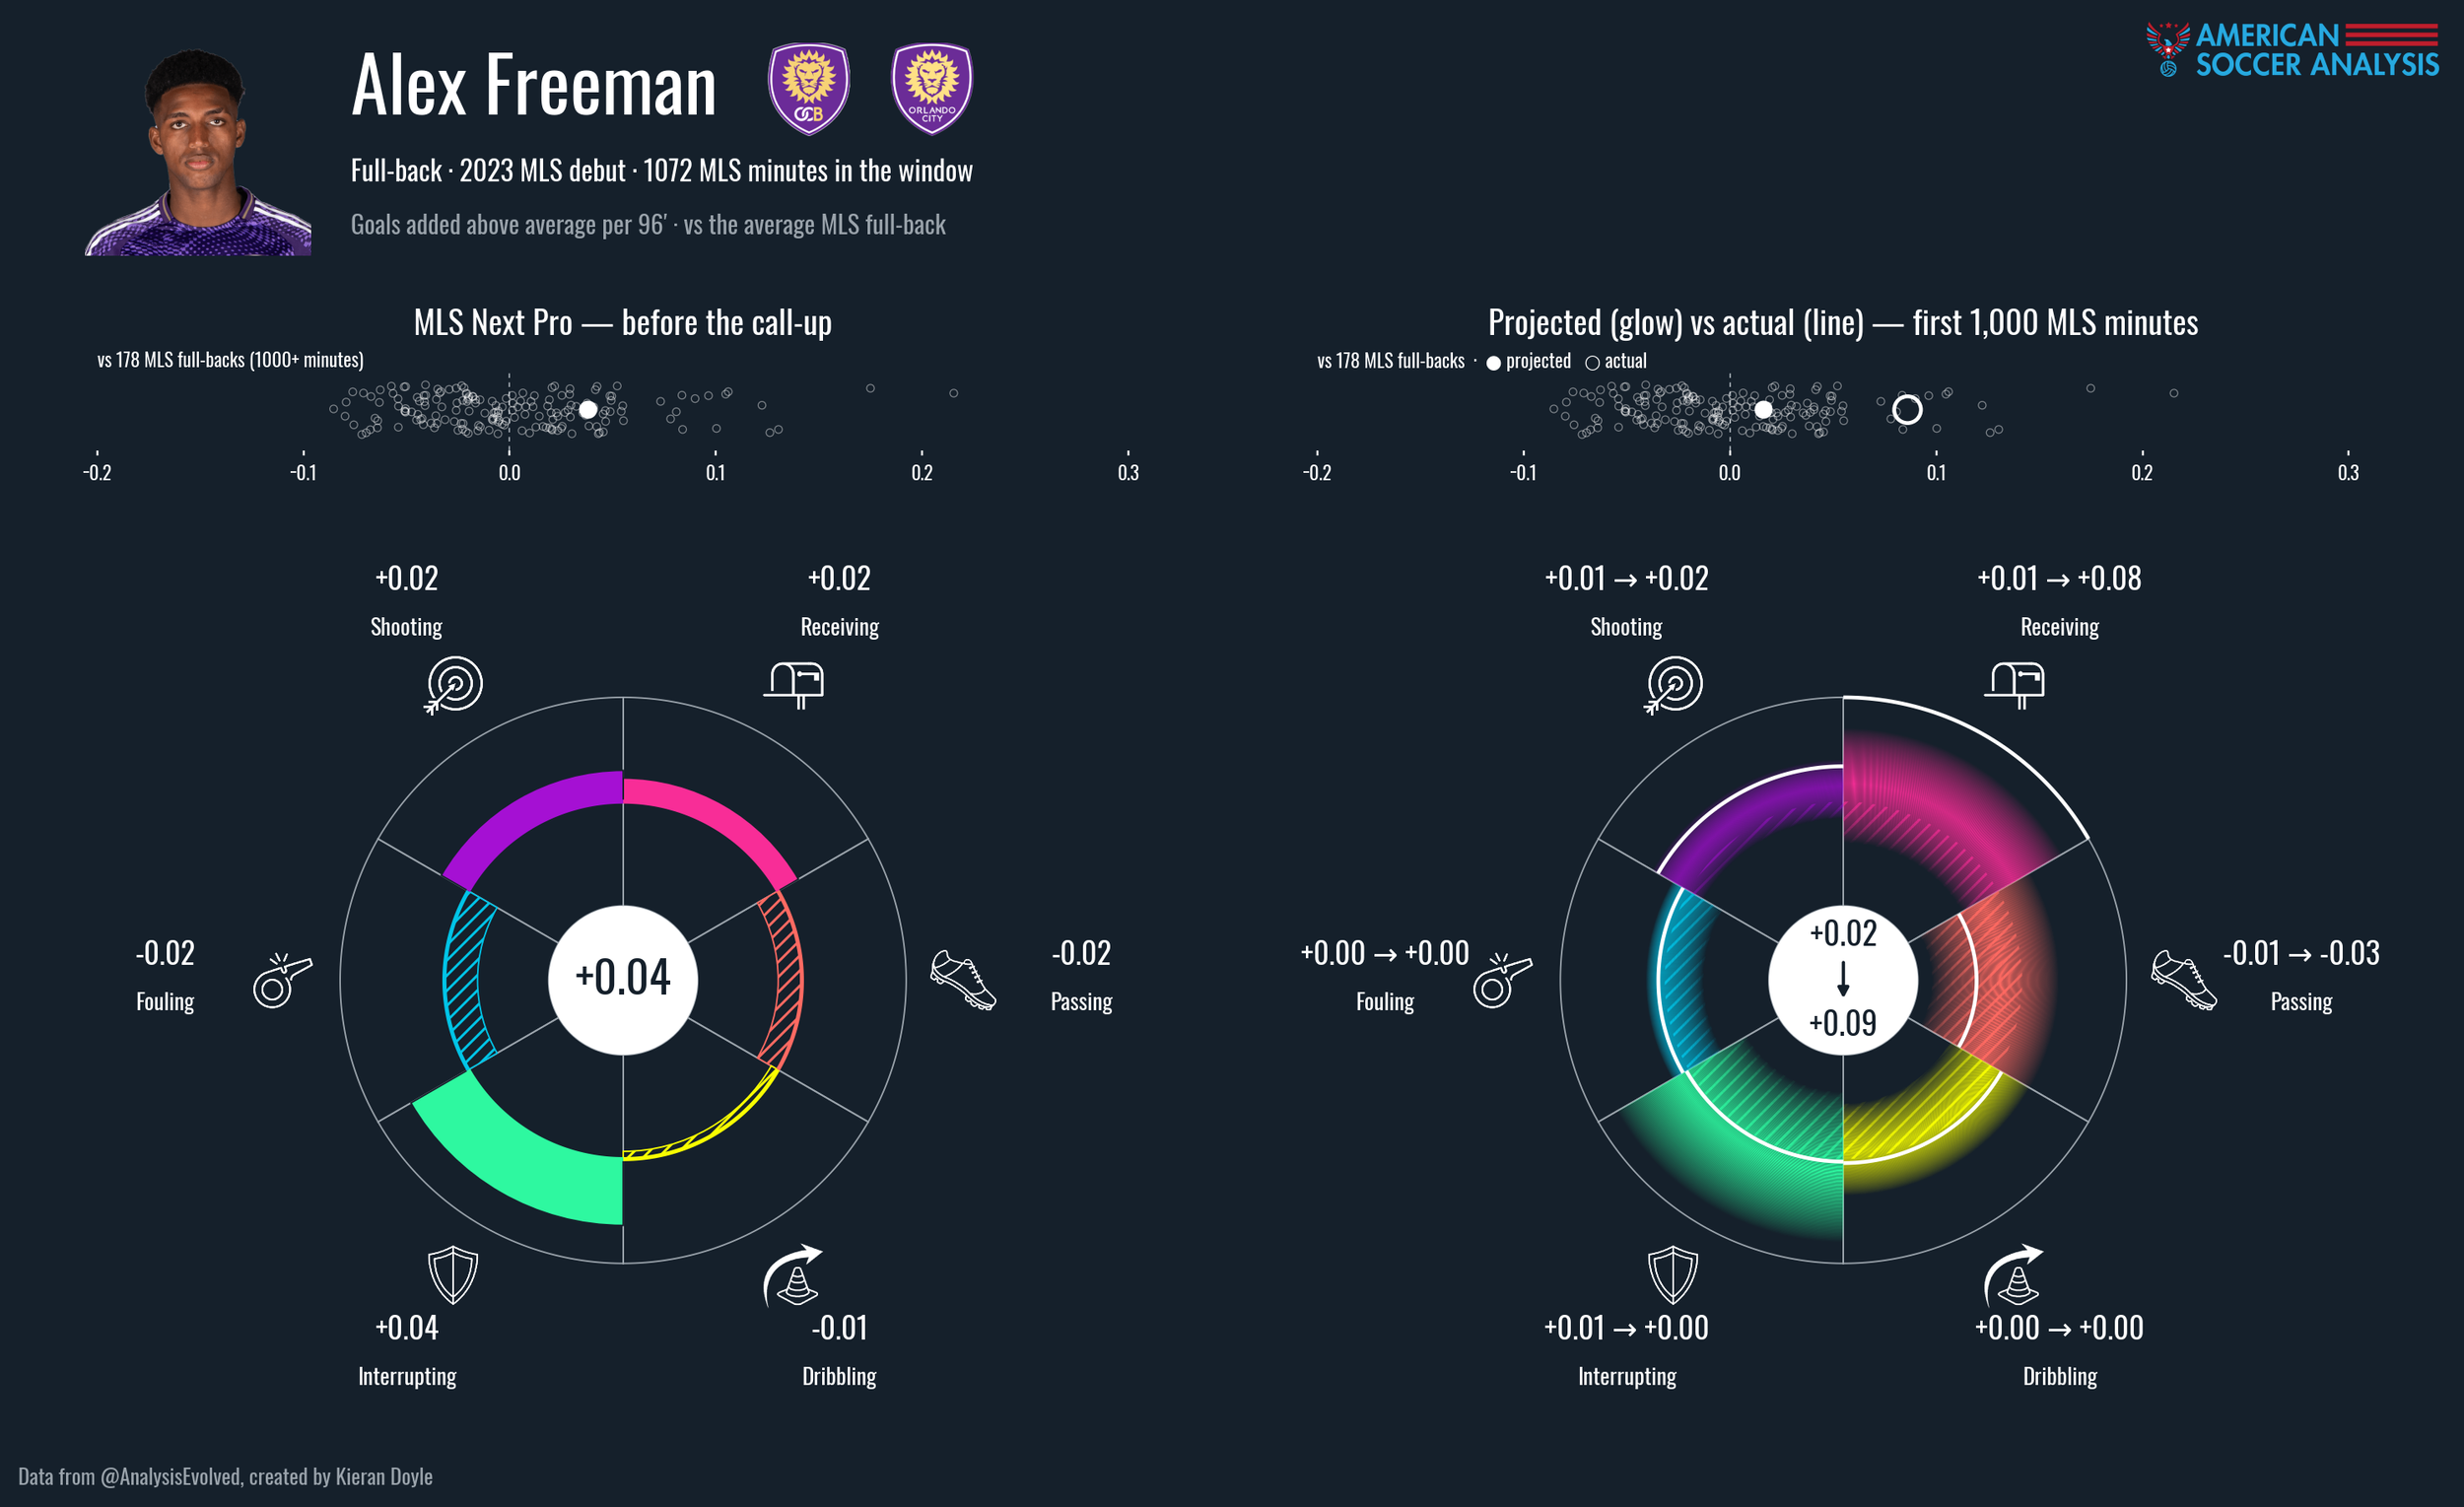
Alex Freeman, FB, 2023 MLS Debut - Orlando City
Freeman obviously took the world by storm, going from Next Pro prospect to World Cup starter in basically a year and a half. Our projection had him as a slightly above average MLS fullback, and you can see all the g+ components actually track quite well. Similarly, every non g+ metric fell into his P25-P75 (the most likely 50% of outcomes) except for xG, xA, shots, key passes, and receiving g+. The model simply didn’t know he’d become American Dani Alves under Oscar Pareja, but this is a pretty good call regardless.
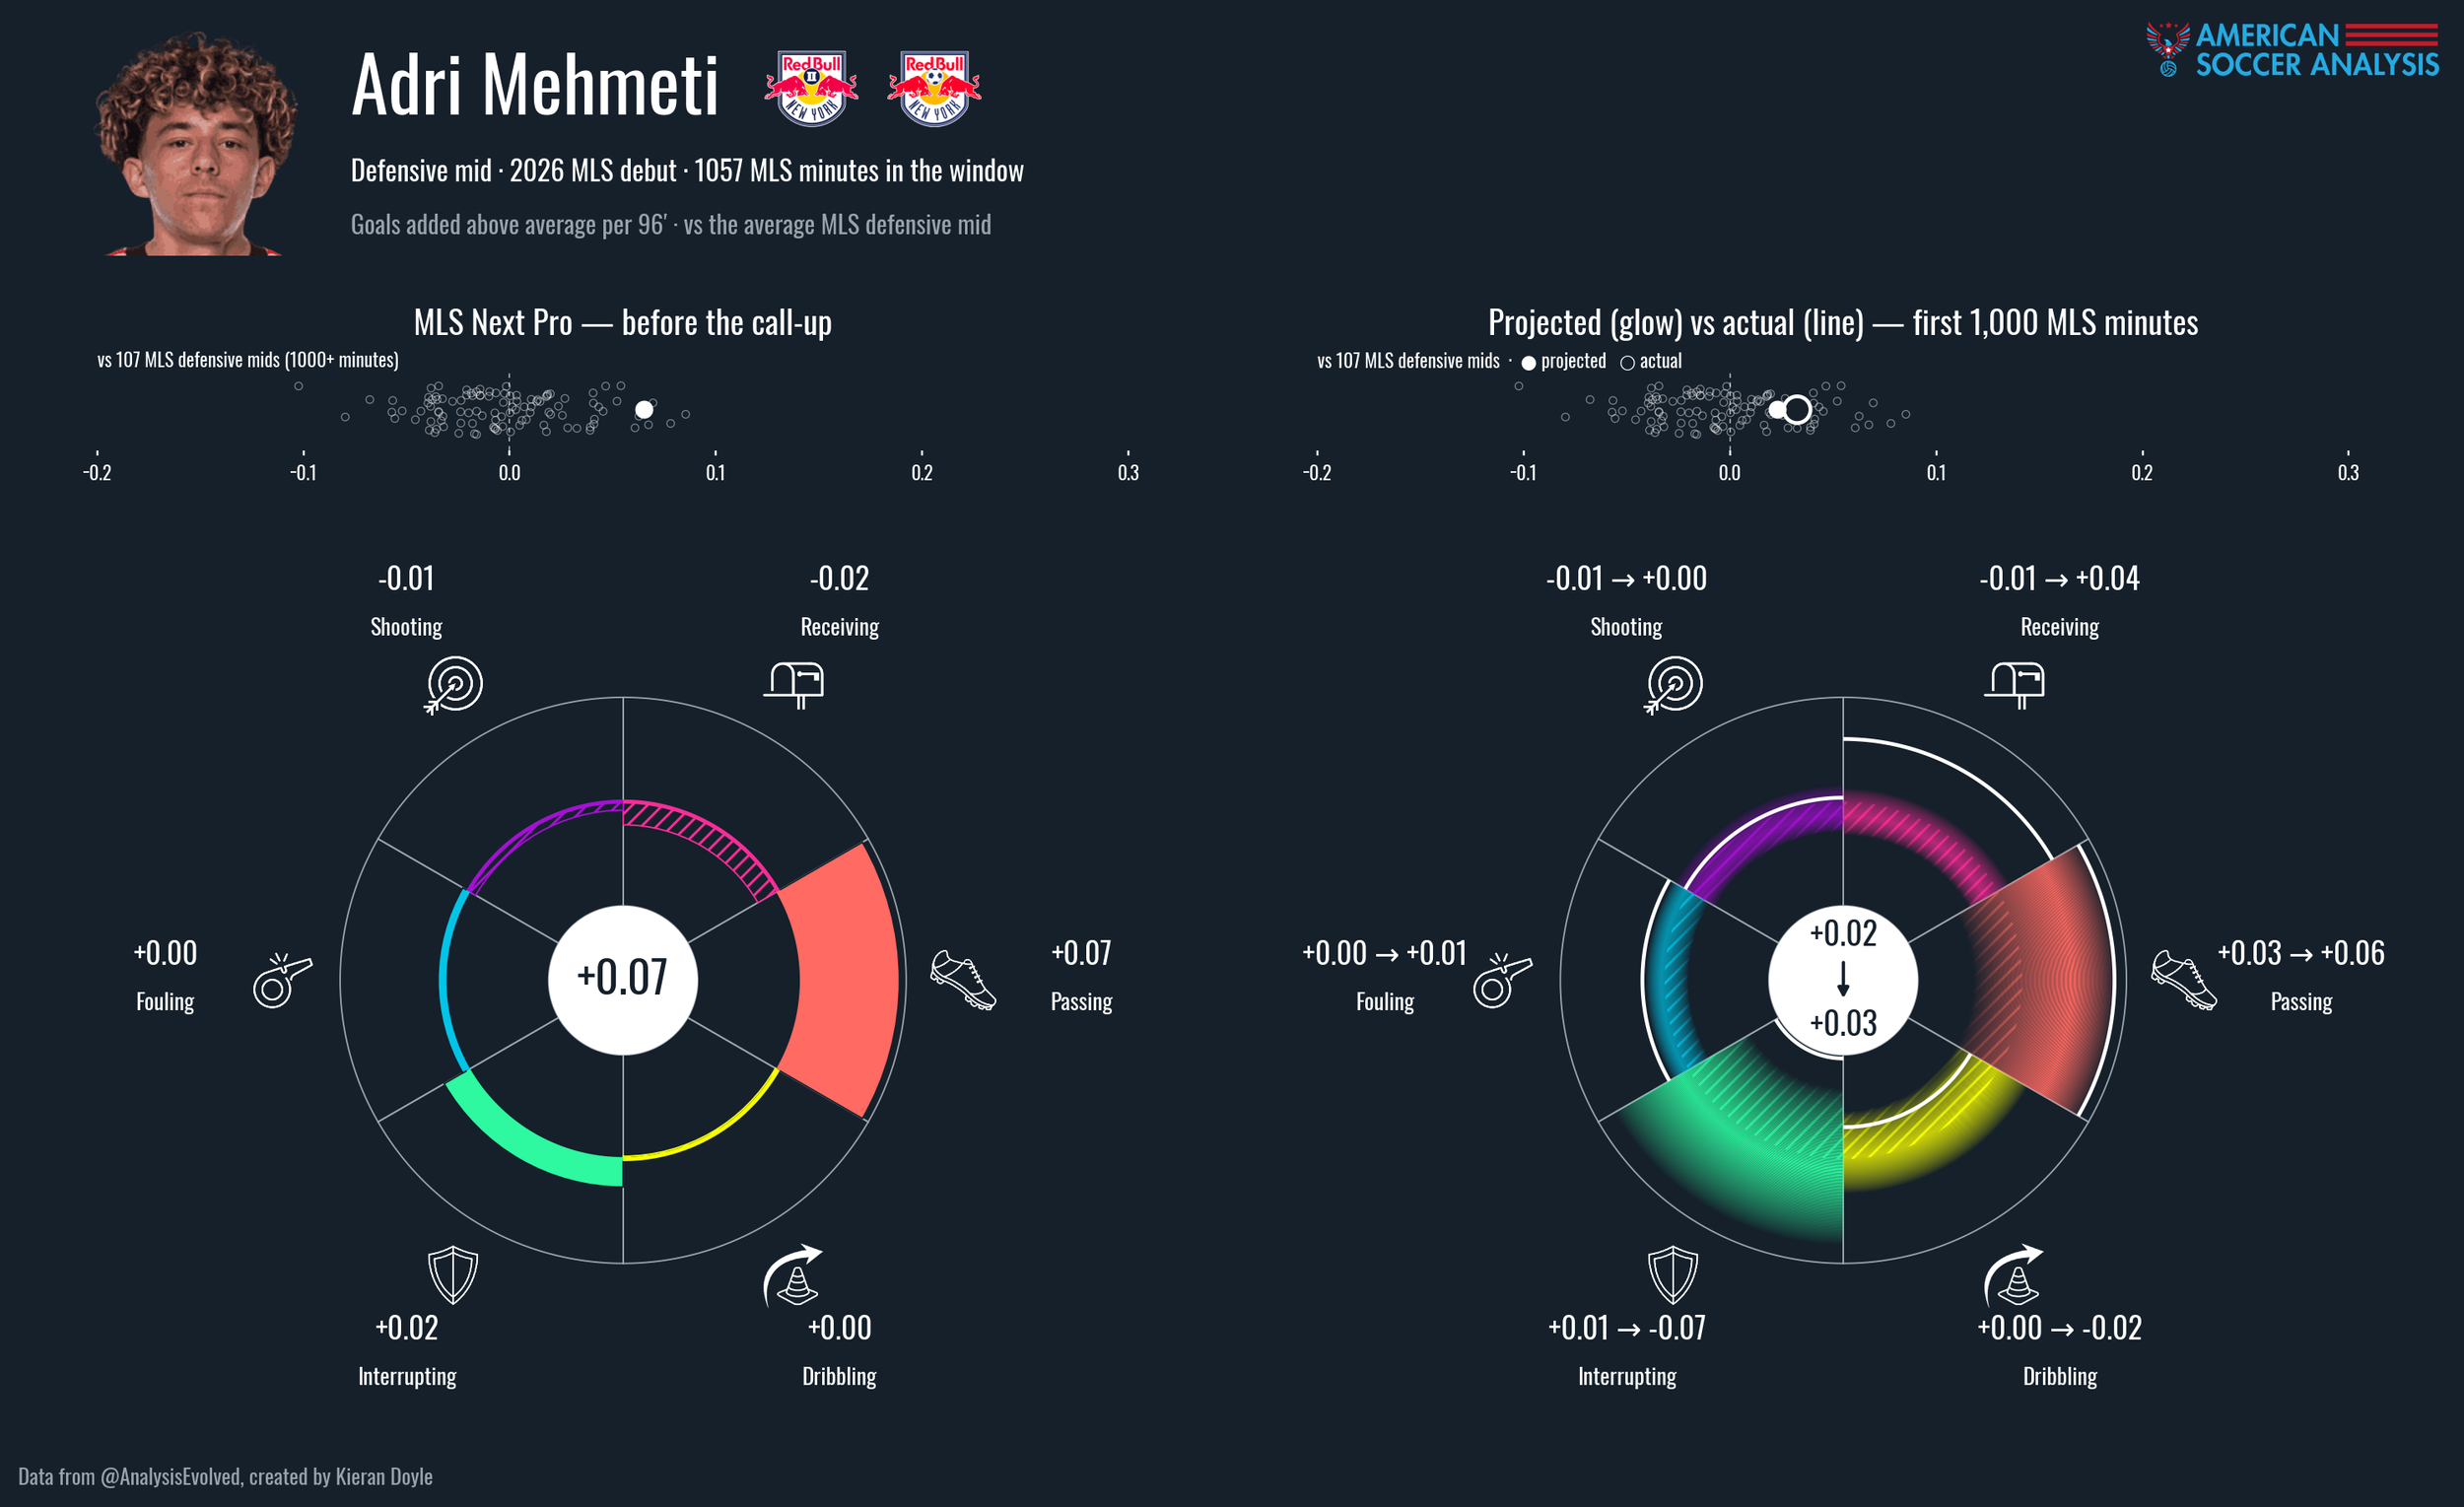
Adri Mehmeti, DM, 2026 MLS Debut - New York Red Bulls
Mehmeti has been one of the surprise young stars of the 2026 season after being one of the best sixes in the entire MLSNP pool. His strong passing was projected to translate, and it has done so better than expected. Where it’s missed has been on the interrupting and receiving side. Mehmeti has been inserted into a much more attacking role, frequently making runs beyond the back line into the penalty area, and less the metronomic hub breaking up play he was with the Baby Bulls.
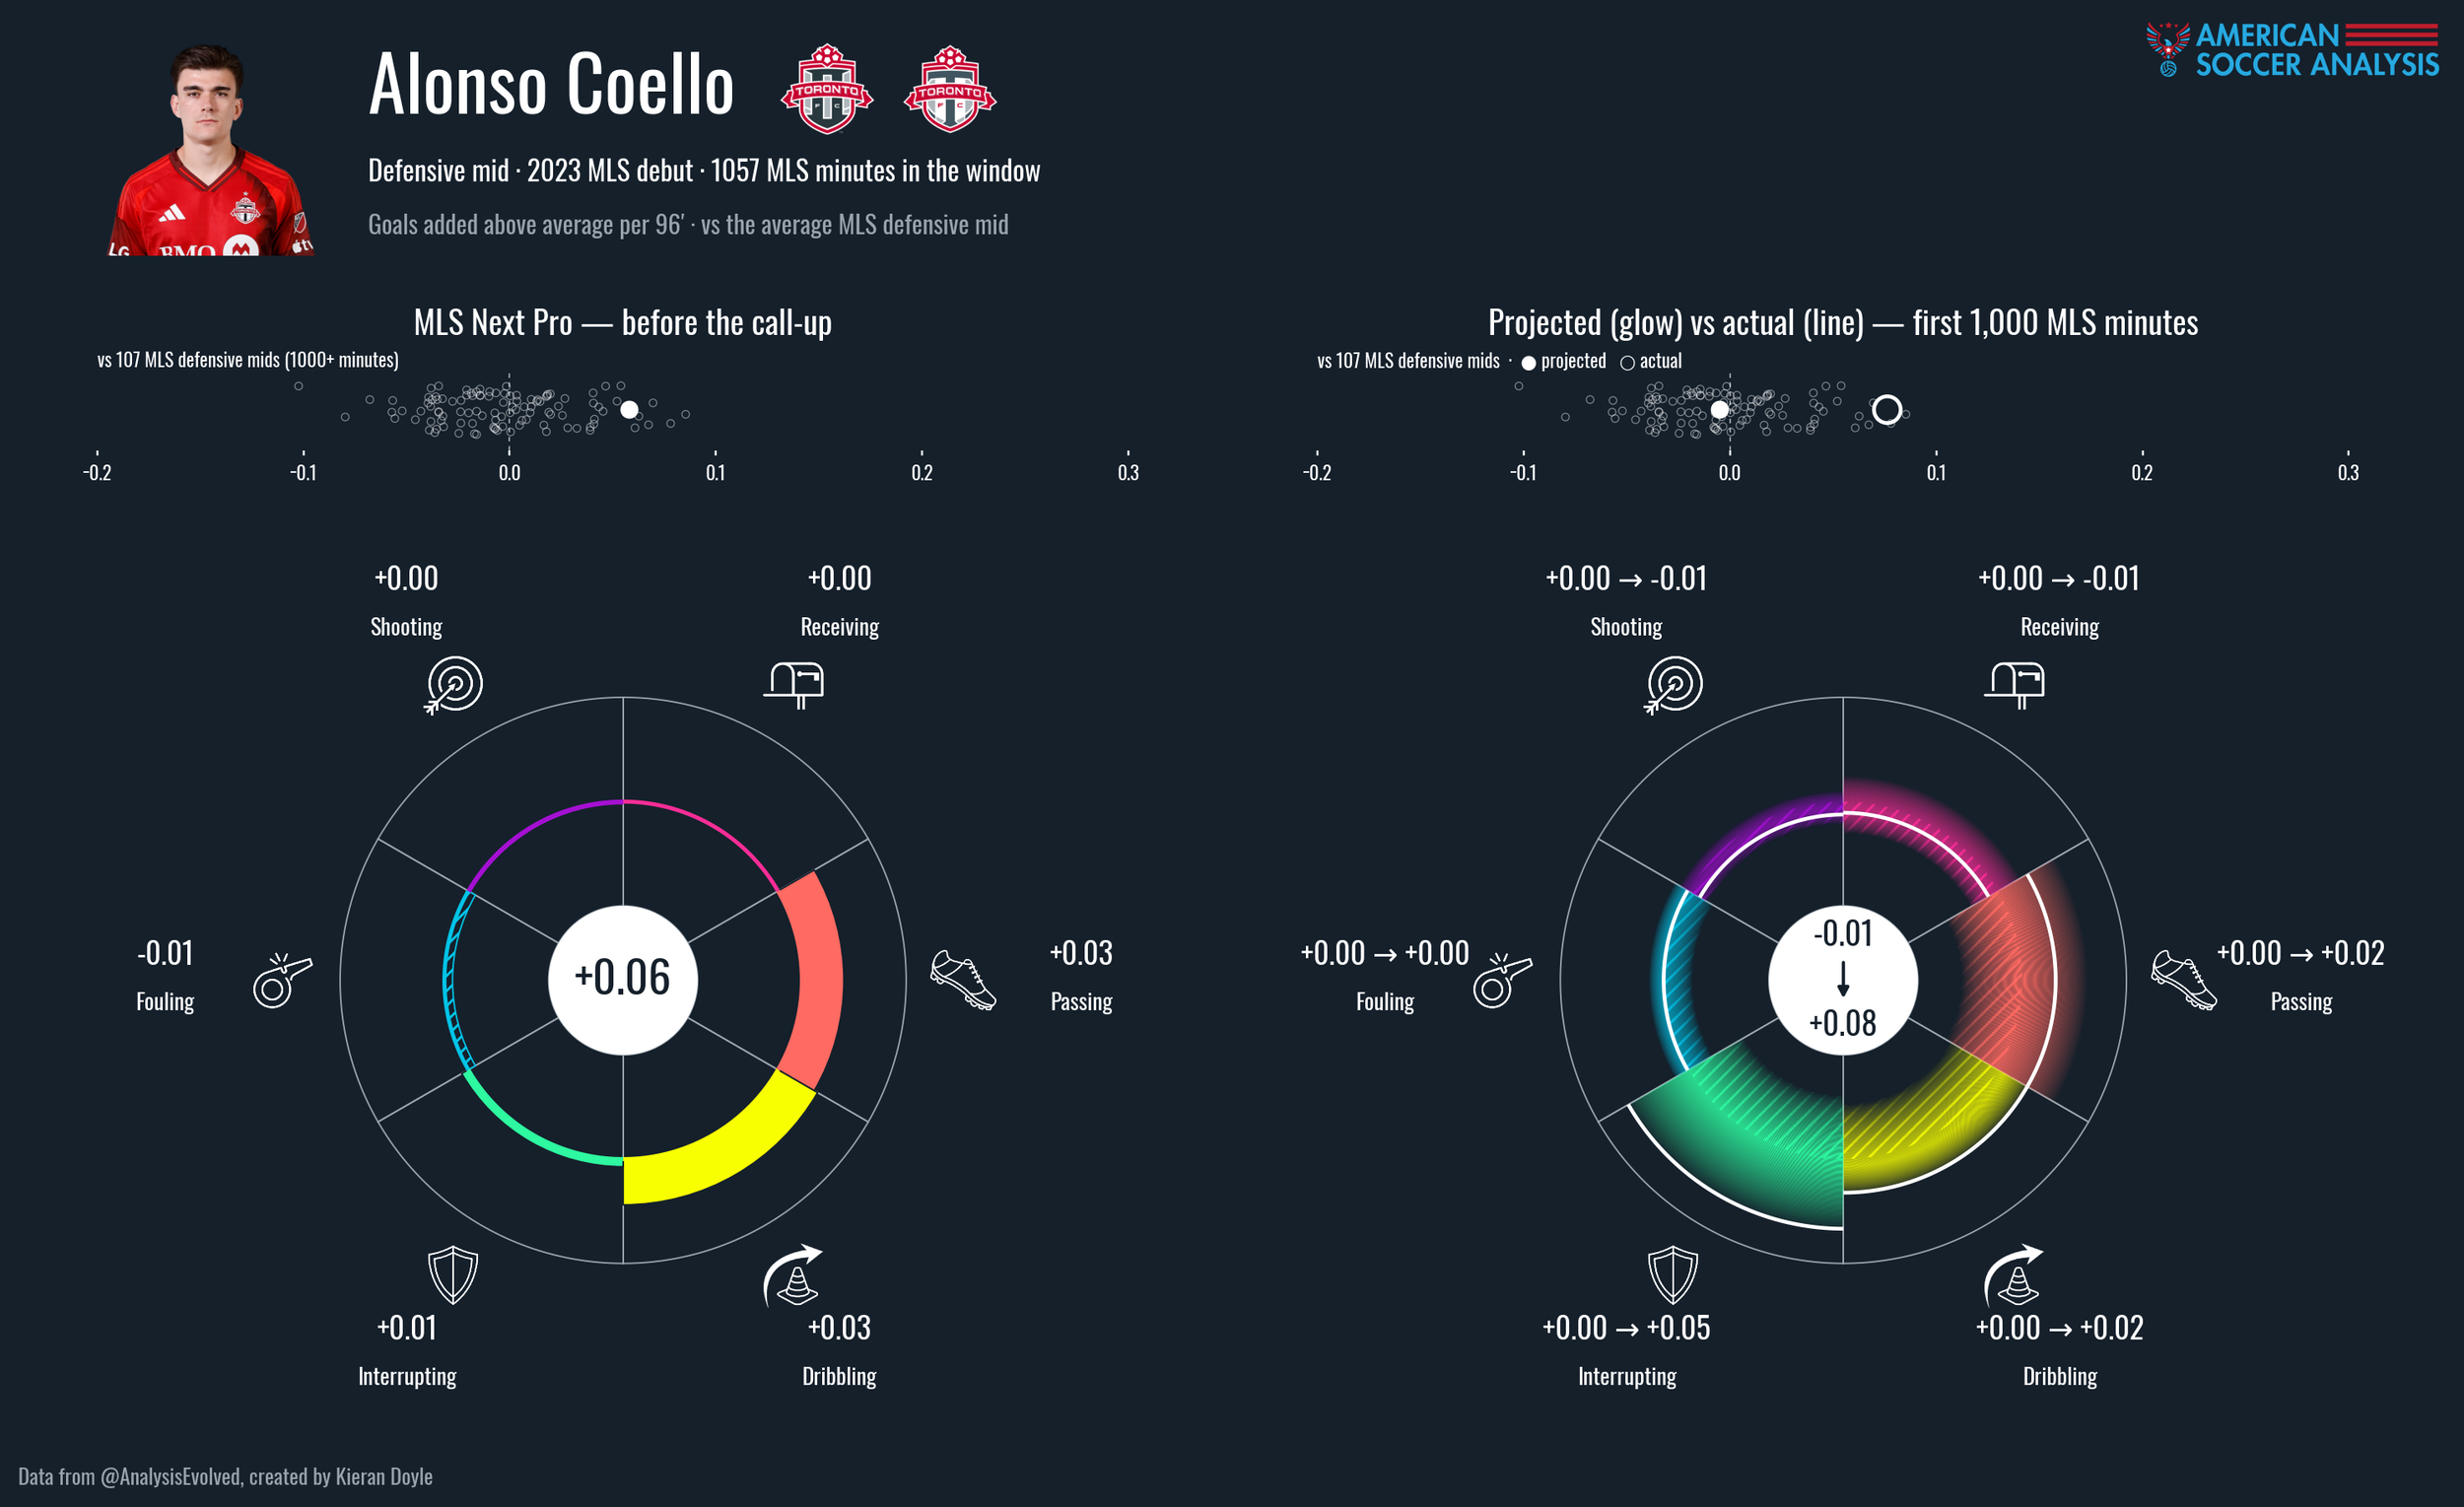
Alonso Coello, DM, 2023 MLS Debut - Toronto FC
Coello is in some ways the opposite of Mehmeti. His projection looks like a perfectly cromulent, well rounded defensive midfielder, that’s a useful player. His passing and carrying as a progressive hub held up somewhat better than expected, but where it mostly missed was on the interrupting g+ side. Coello’s first season with the first team was a lot of defending the penalty area, racking up interrupting g+
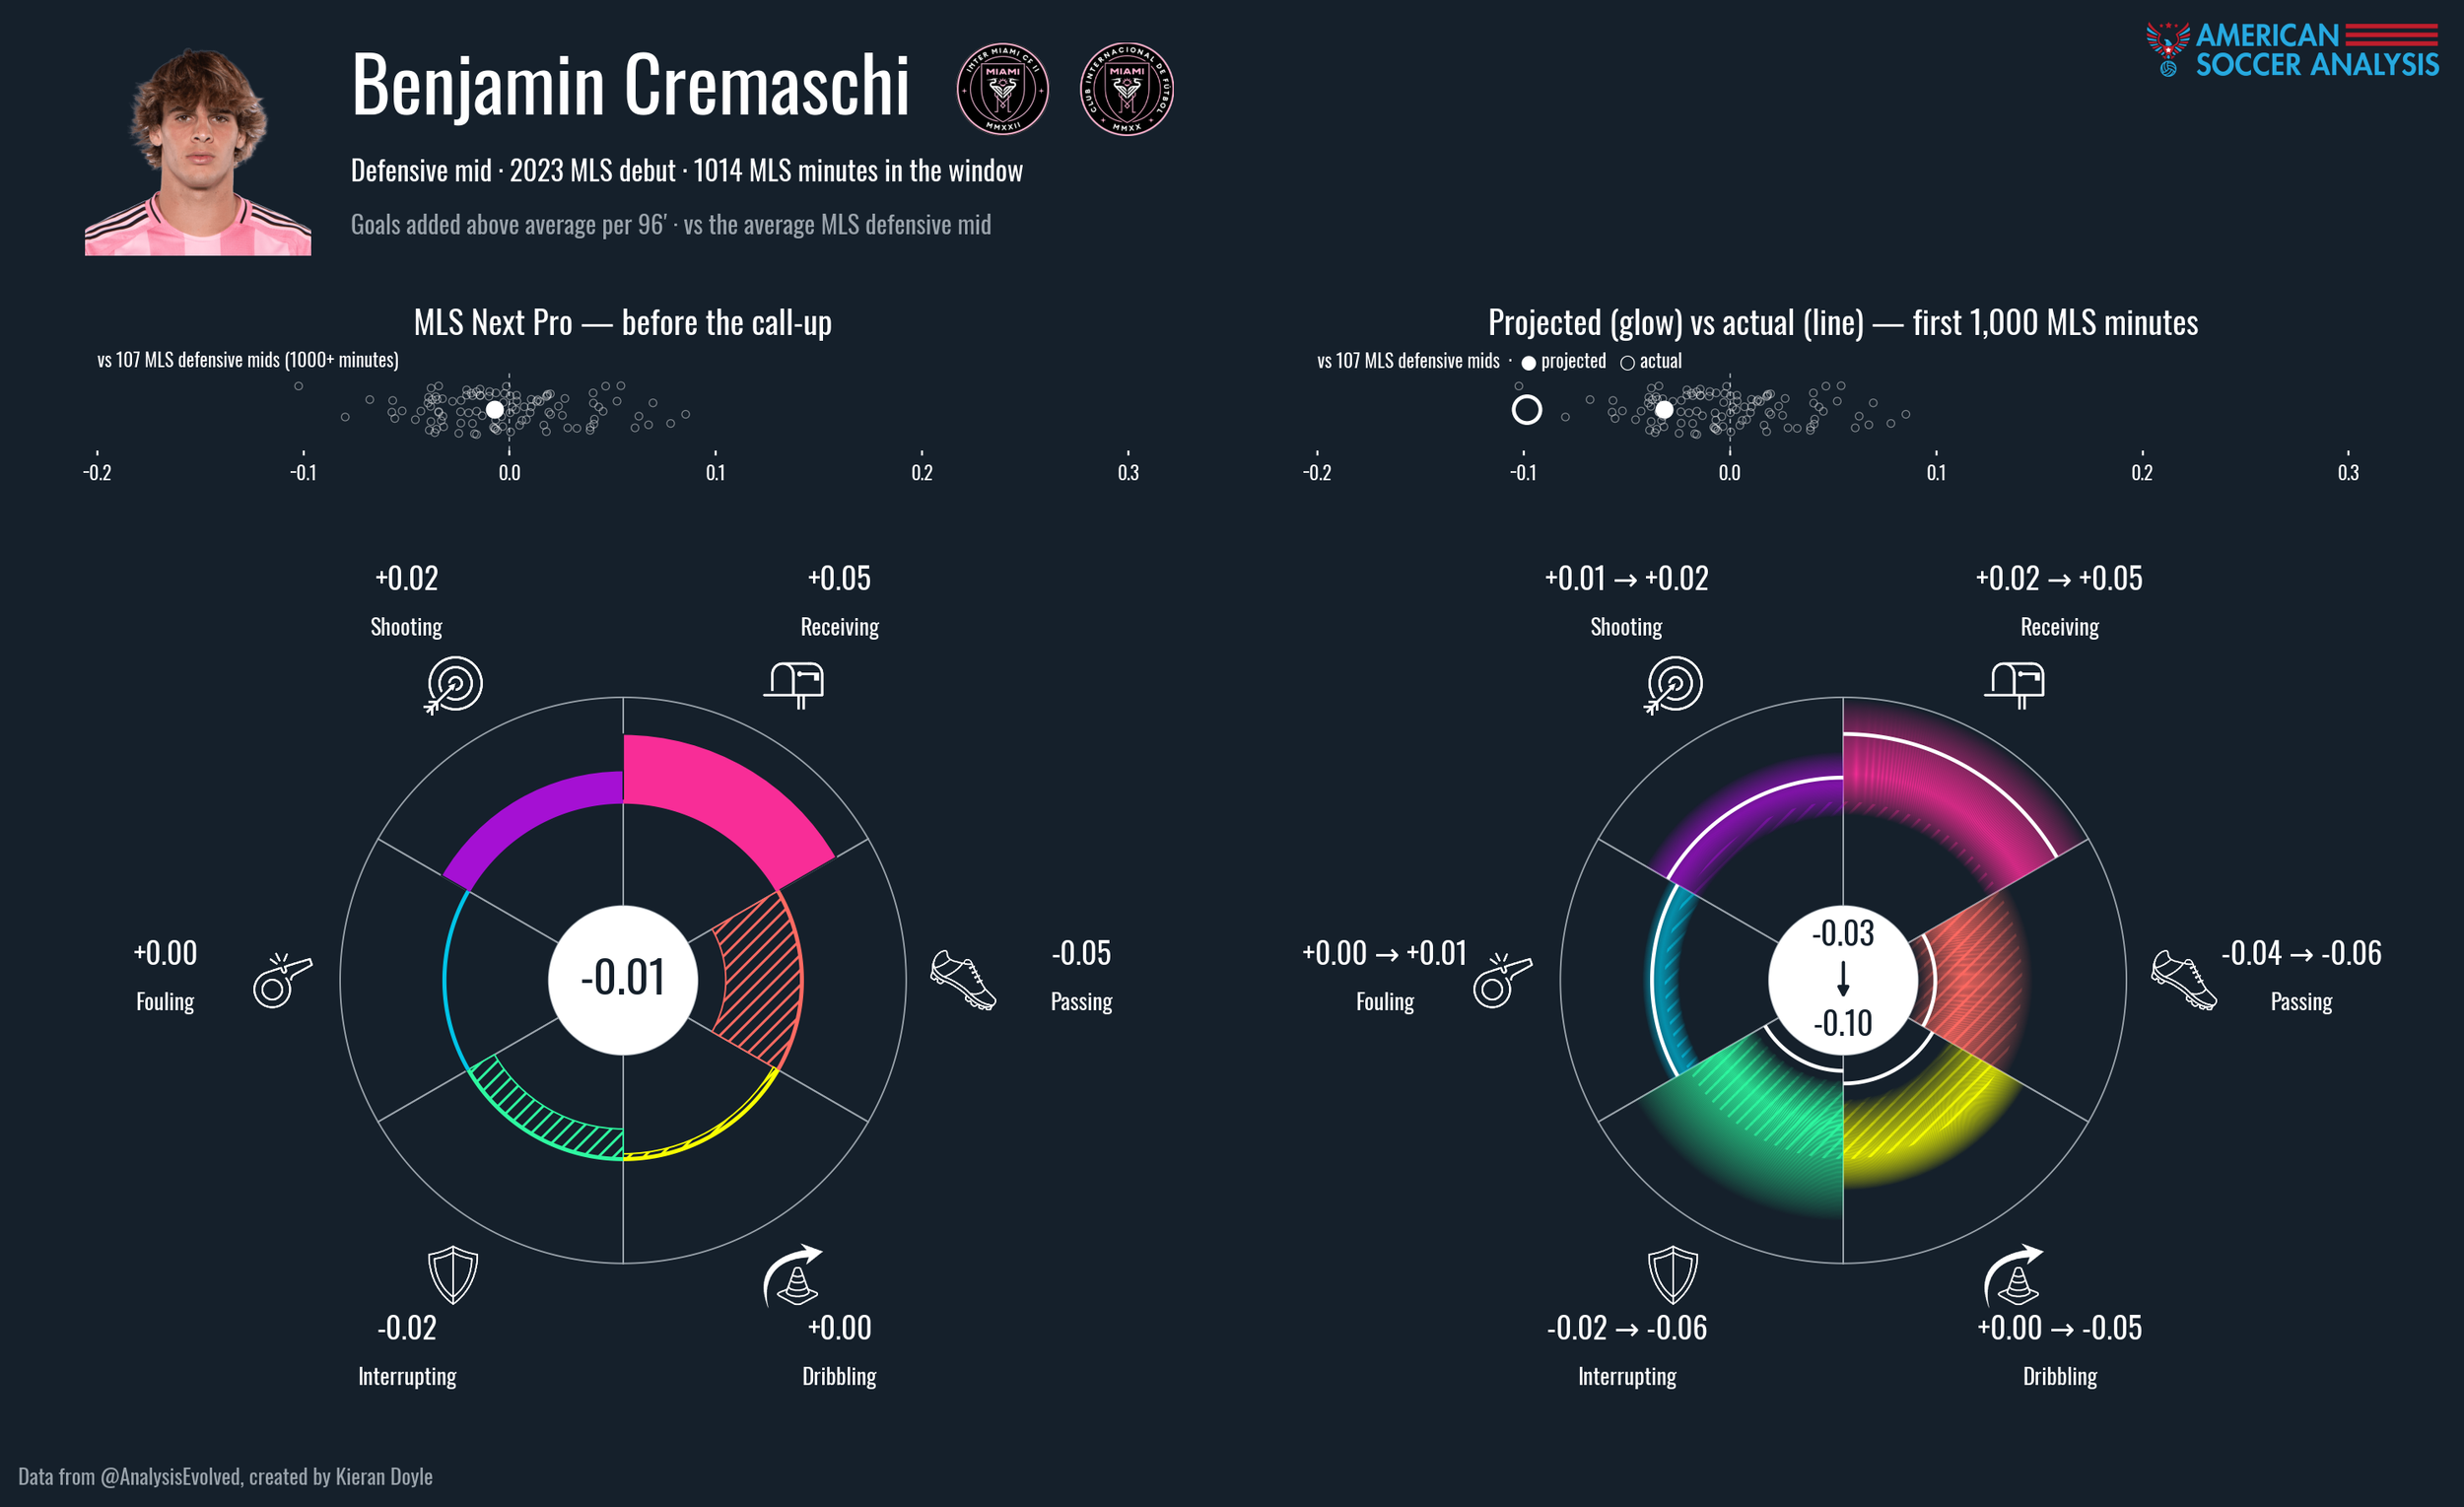
Benjamin Cremaschi, CM, 2023 MLS Debut - Inter Miami
I’m quite happy with how accurate the Cremaschi prediction was. A somewhat below average midfielder who struggles to progress the ball enough goes up to the first team and is a below average midfielder who struggles to progress the ball enough. What the model didn’t know is that Cremaschi would get to play with the greatest creative passer of all time and become a willing box runner to receive Messi passes to juice that receiving all the way up.
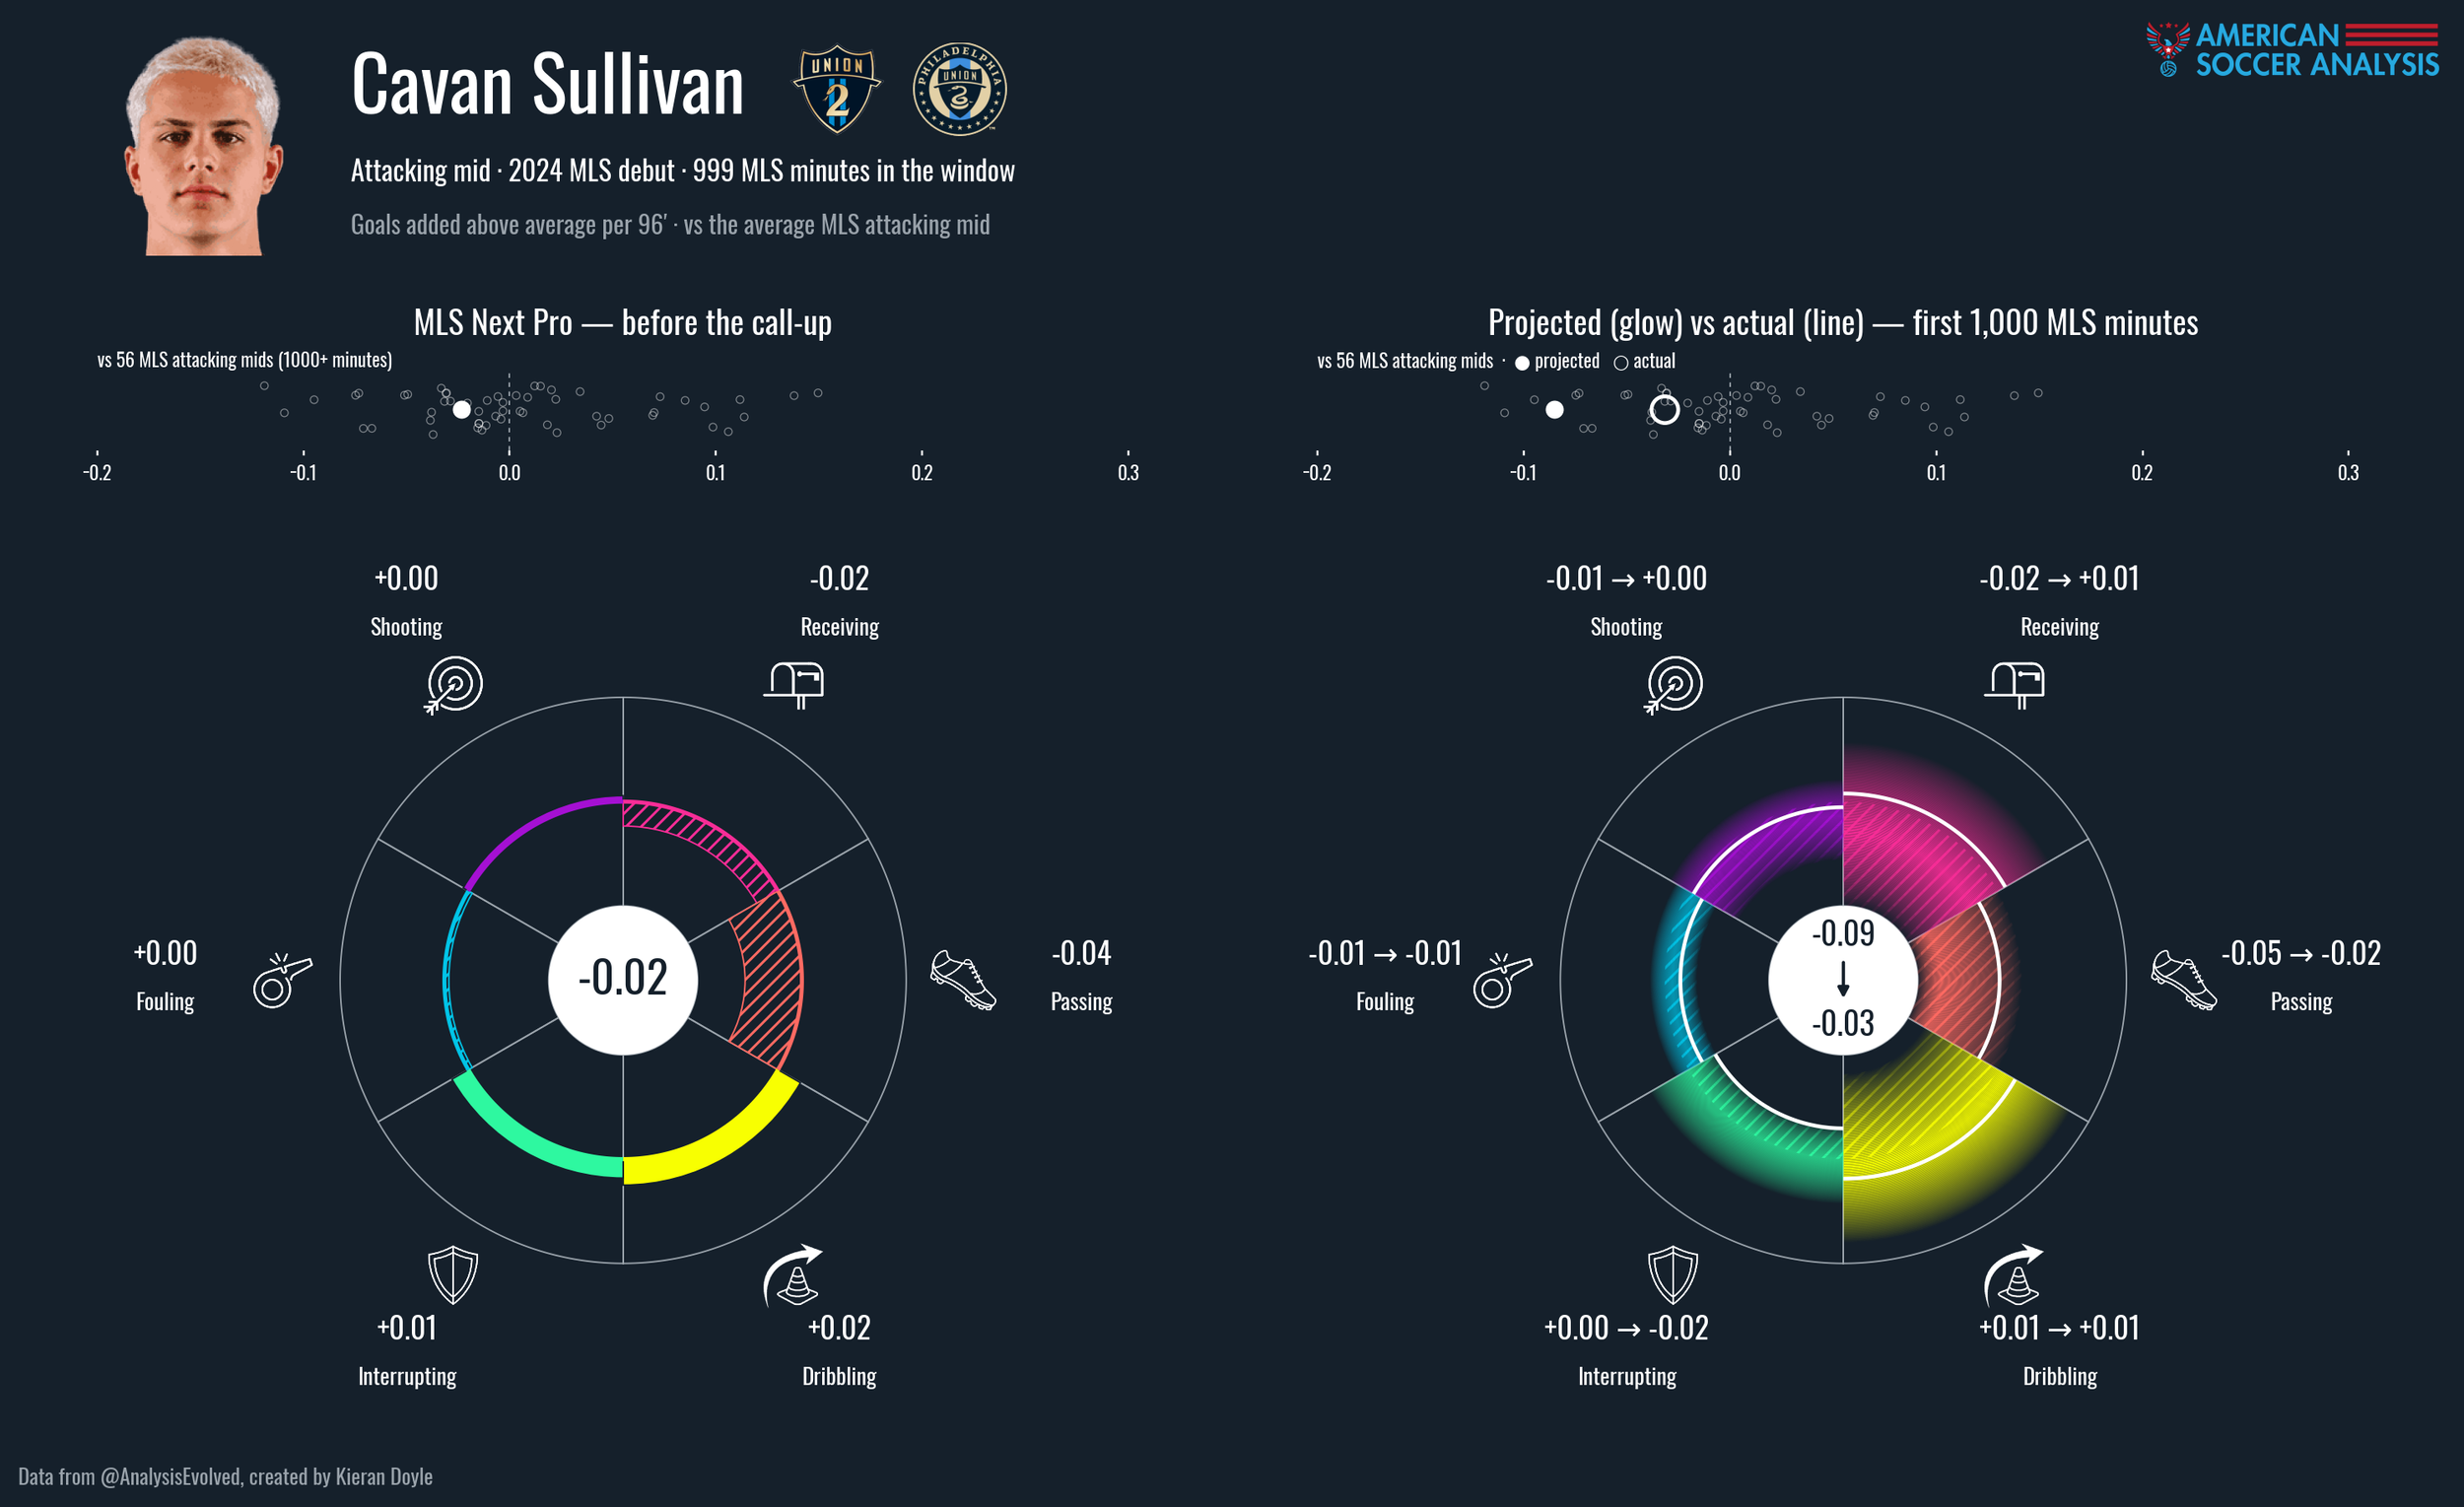
Cavan Sullivan, AM, 2024 MLS Debut - Philadelphia Union
This is a good edge case example for what this model does tell you, and what it doesn’t. 17 of Sullivan’s 19 metrics fall in his P25-P75 band, with take ons and pass completion falling outside. But it all looks wrong to the eye. However, Sullivan has one of the widest projection bands in the entire class for a few important reasons.
His extremely young MLSNP age basically makes him a total wildcard.
The model stops tracking your MLSNP production once you make your MLS debut (more on this later), so he only had 500 MLSNP minutes, while it took him two more years to hit 1000 MLS minutes, during which he played another 2000 MLSNP minutes (and became dominant in the NP league).
Because of 2, and his growth from 14 to 16 from a passing AM into a risk taking dynamic wide attacker, the profile looks extremely different. So it’s just wrong.
There are exactly three MLSNP AMs promoted to the first team listed as an AM, Dado Valenzuela, Cavan Sullivan, and Kenji Mboma Dem, and only Valenzuela made it all the way to 1000 minutes, so it makes transitions awkward to map.
Regardless, Sullivan has developed into a really effective wide attacker both as a passer and off ball mover. Good for him.
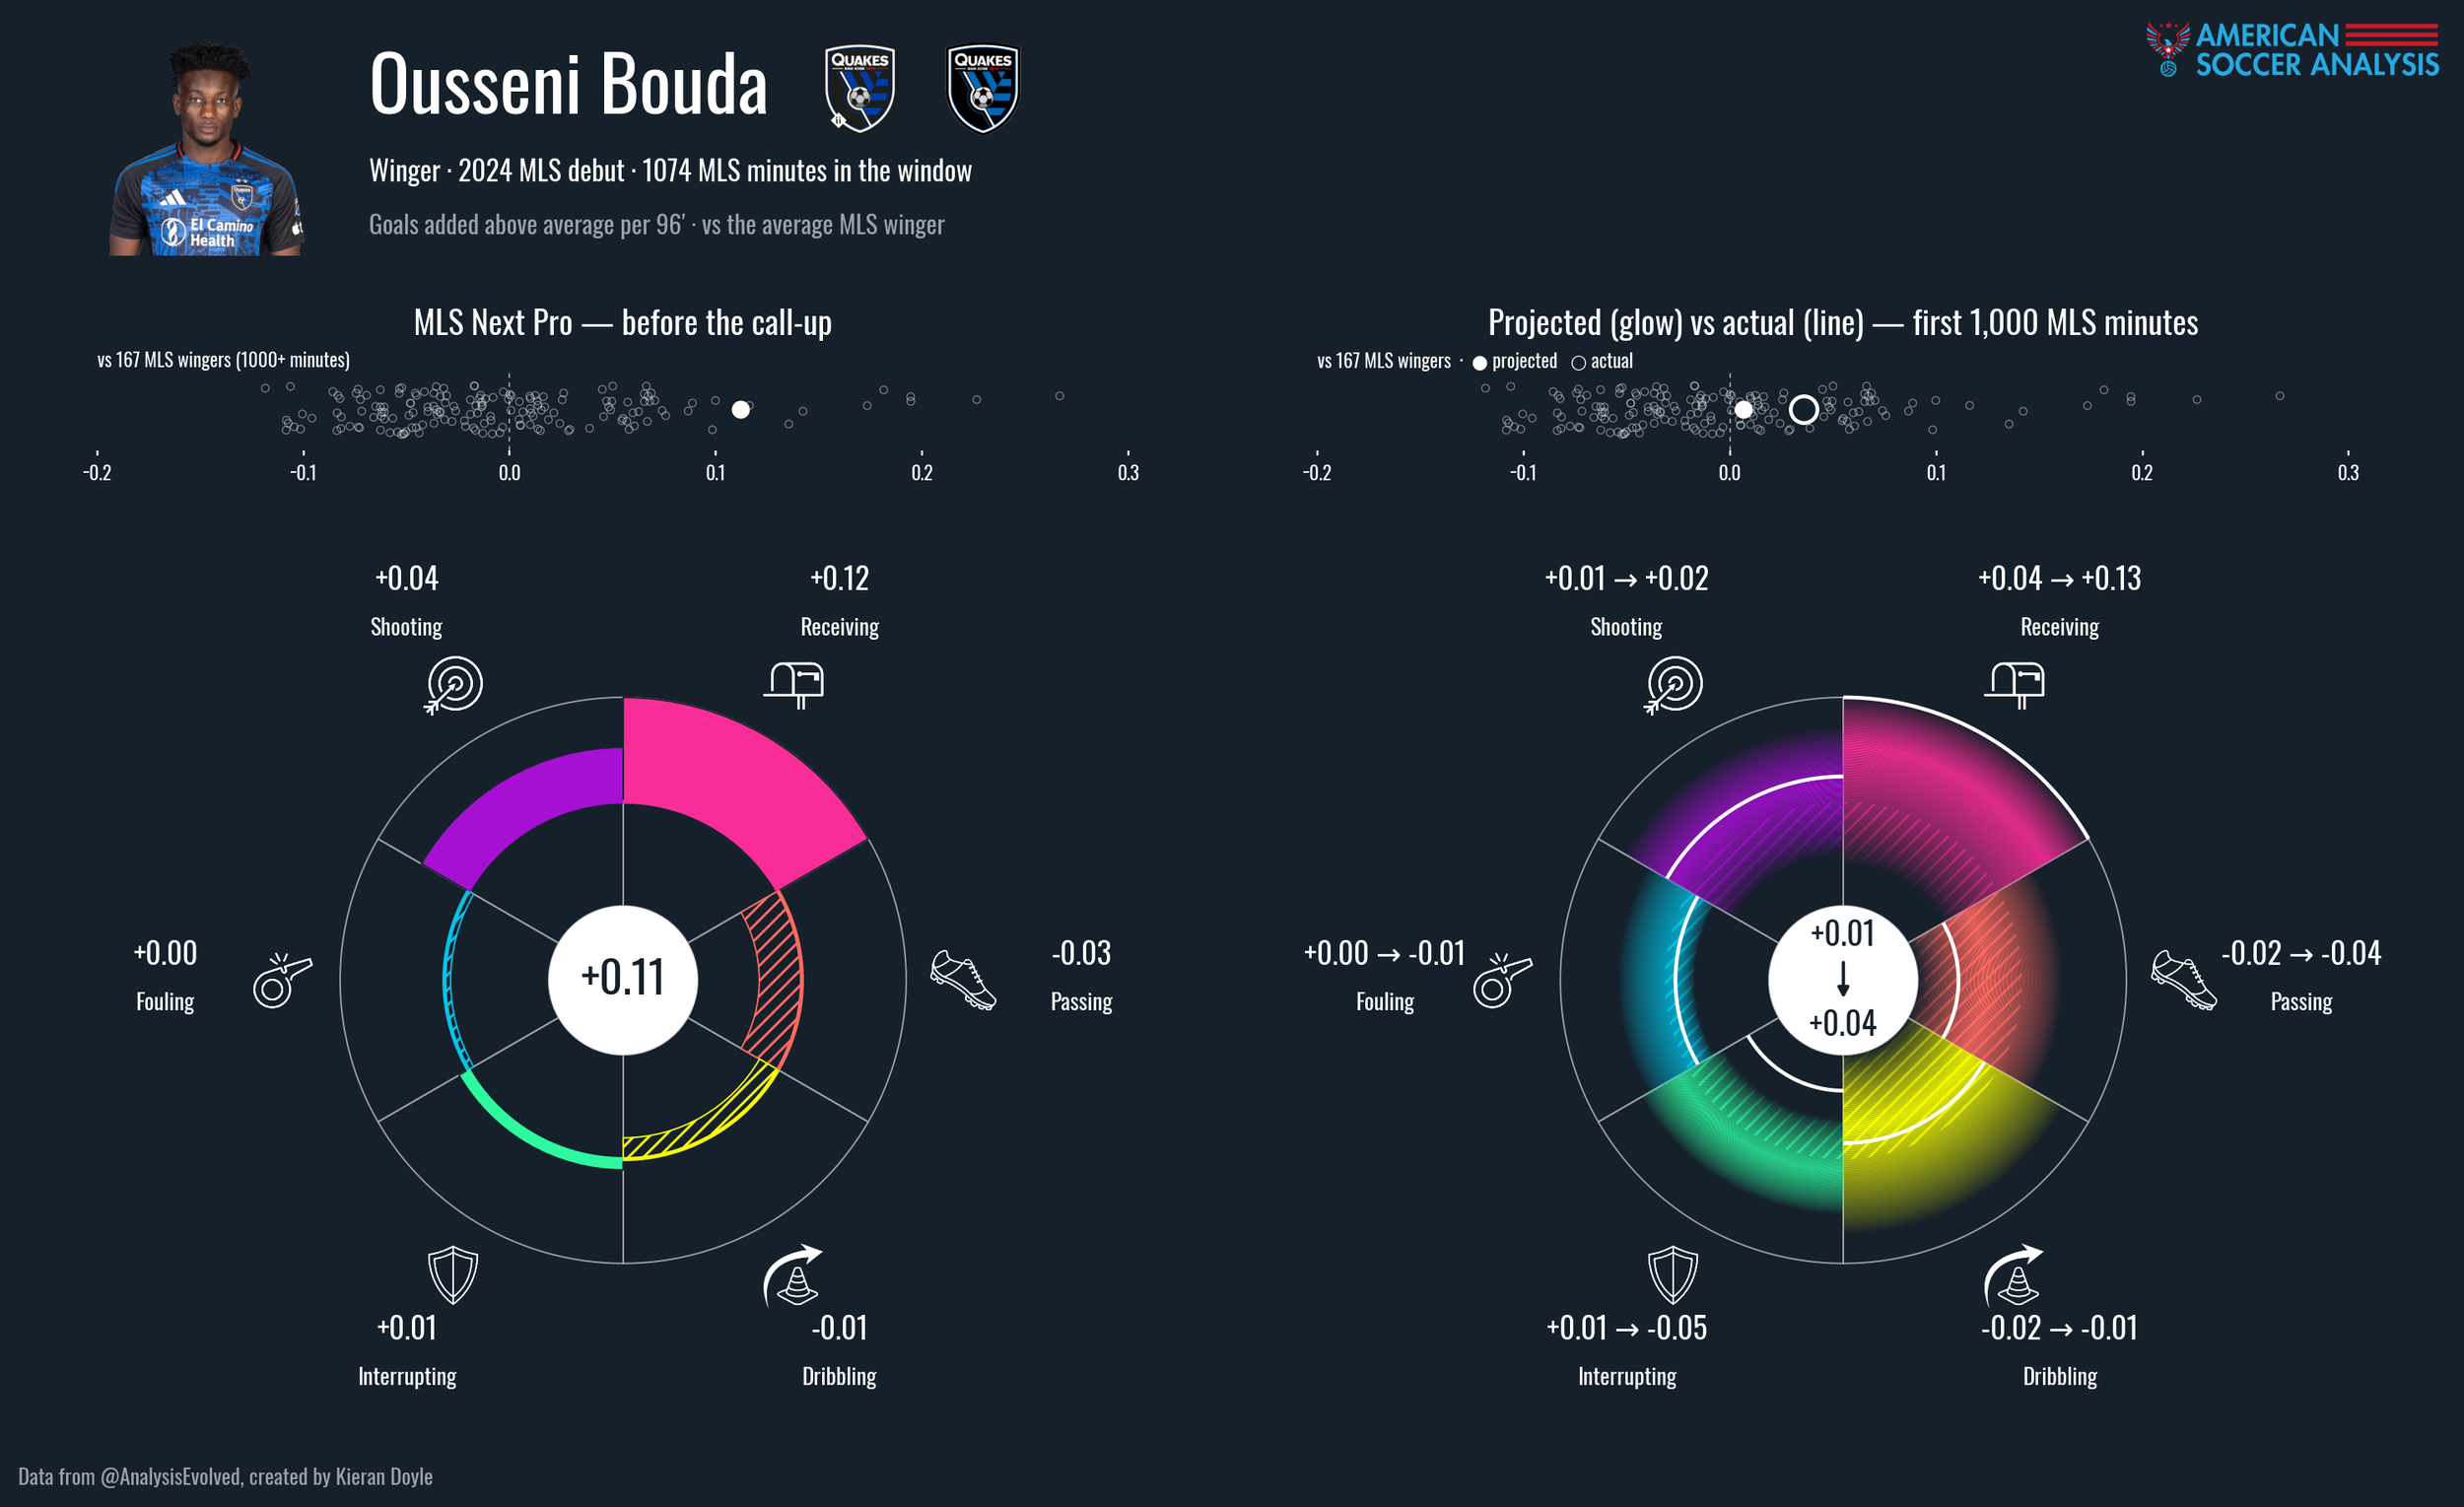
Ousseni Bouda, W, 2024 MLS Debut - San Jose Earthquakes
Some things translated better than expected, but the projection captures the shape of the player he’s become quite well!
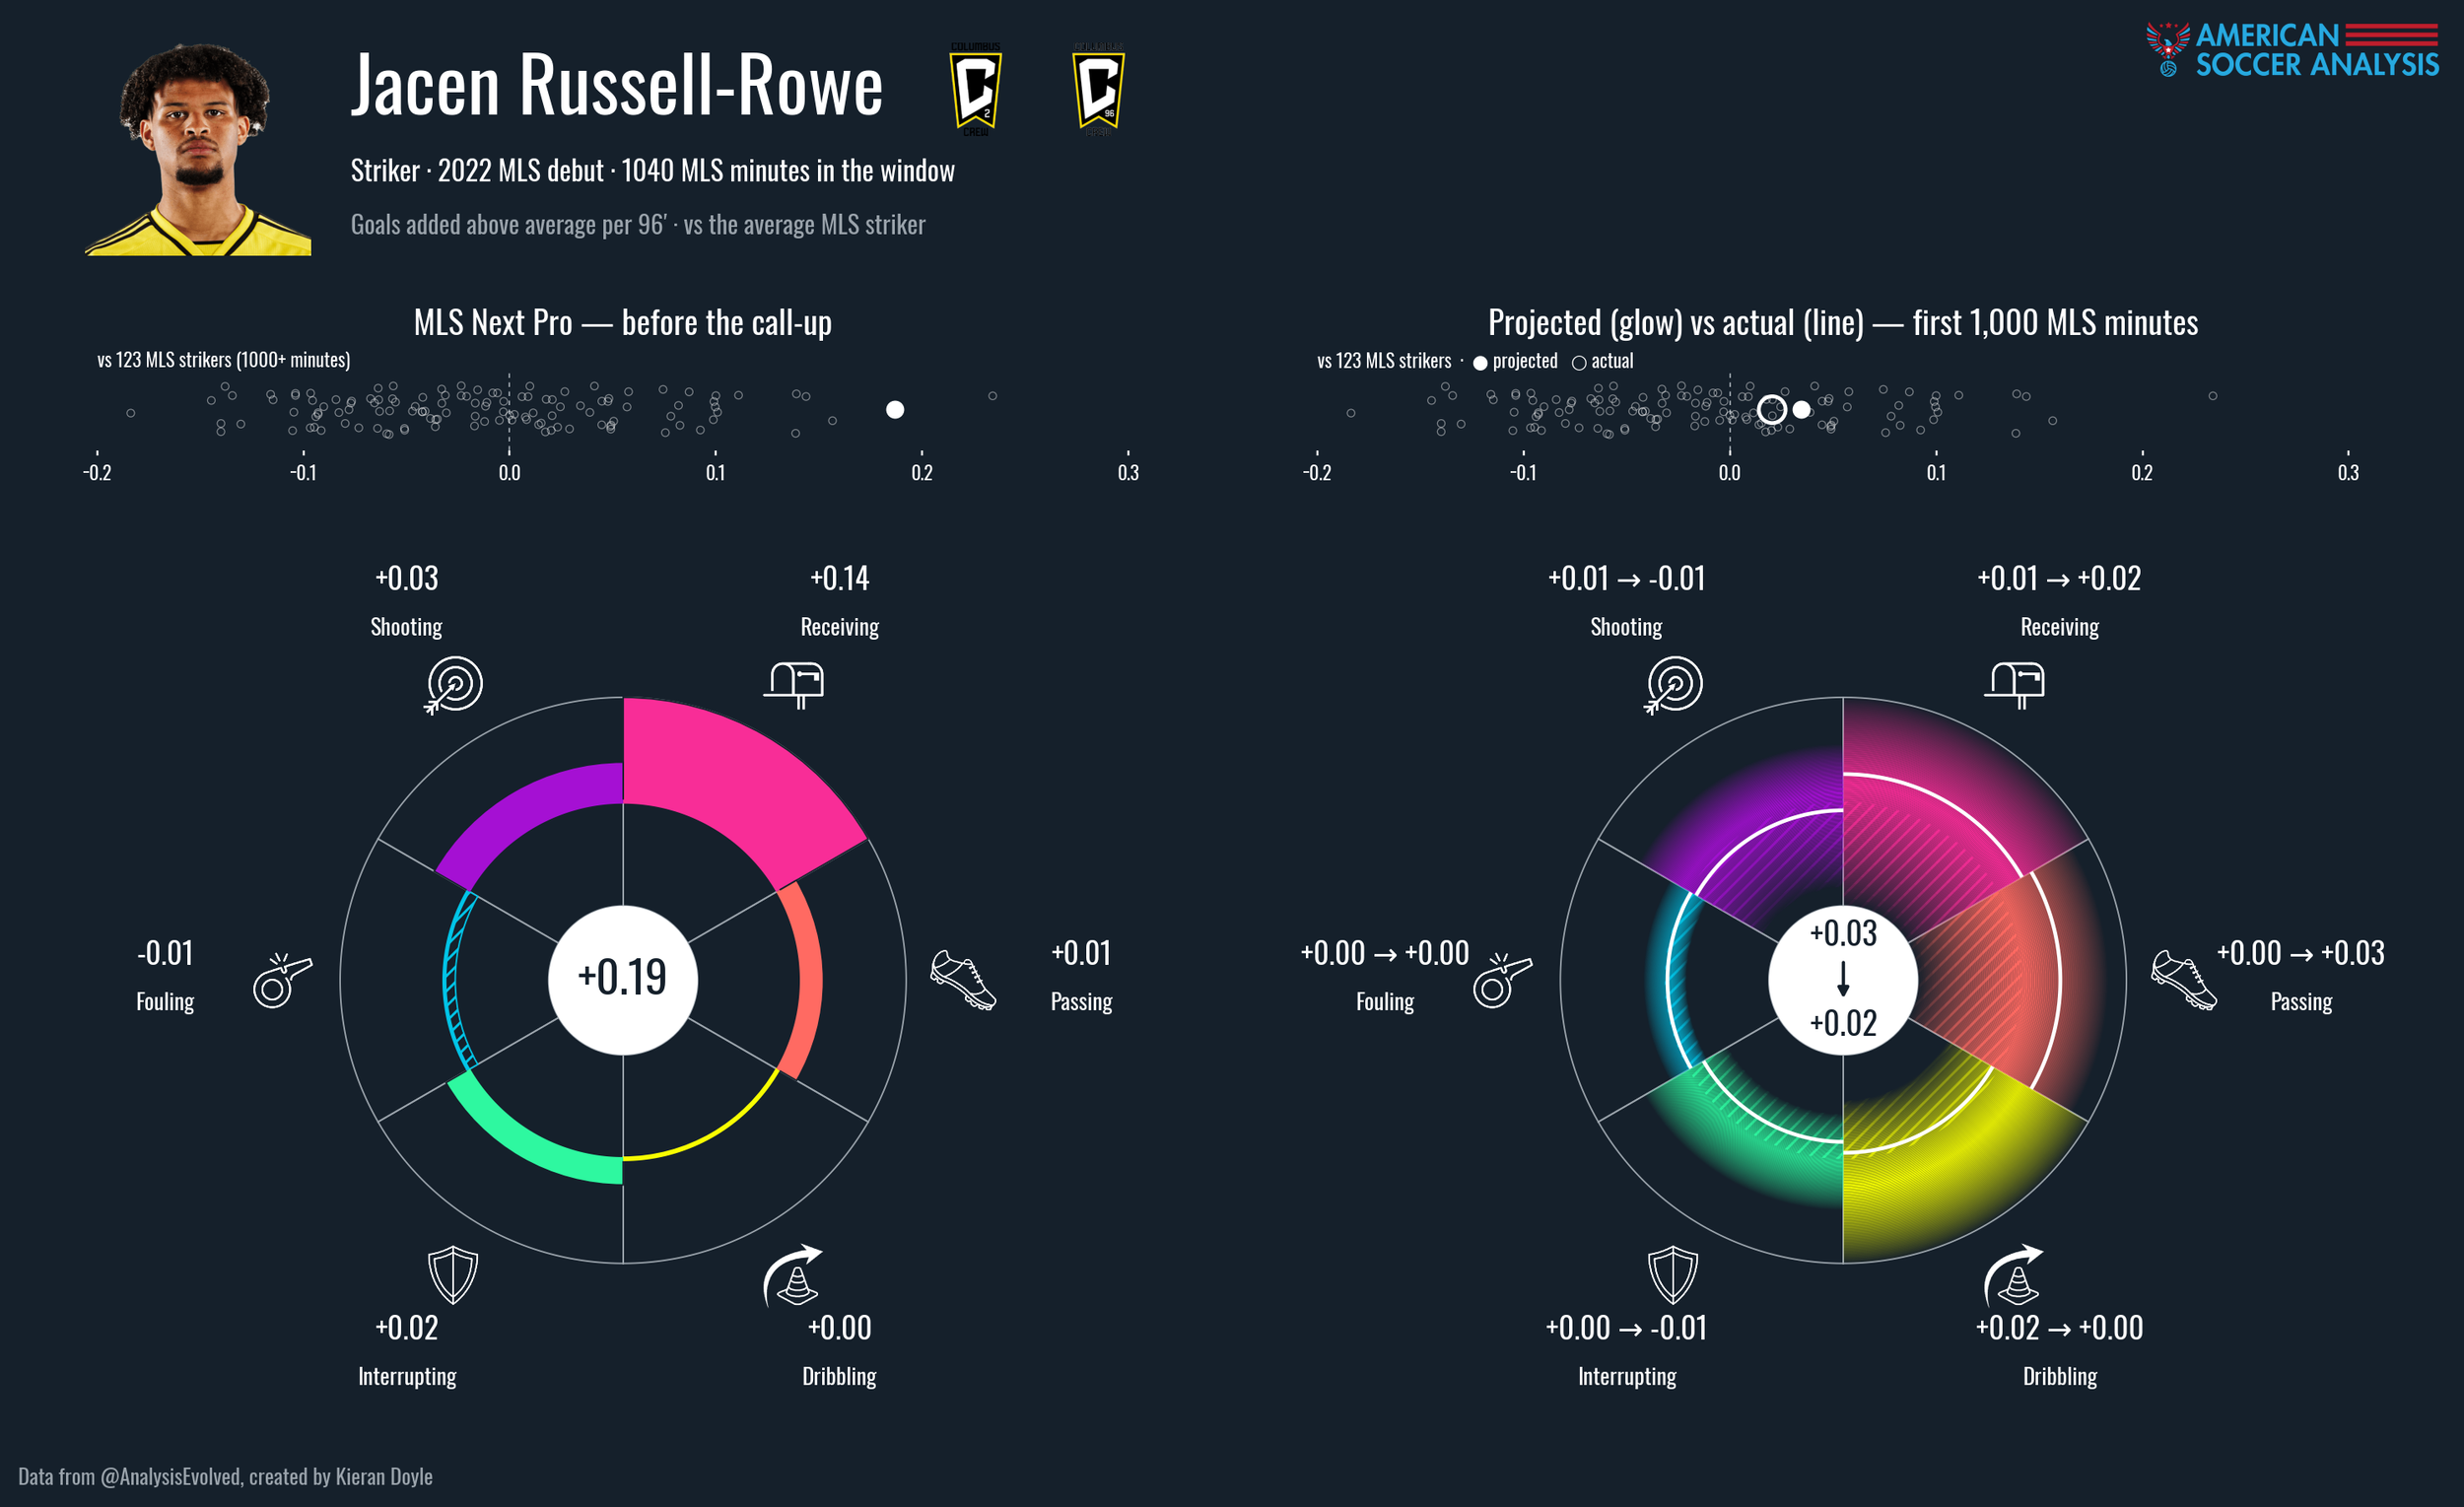
Jacen Russell-Rowe, ST, 2022 MLS Debut - Columbus Crew
JRR was one of the original MLSNP graduates that had people’s ears perking up at how viable it was to generate first teamers, and the projection model handles him really well. Basically dead on what his first 1000 MLS minutes looked like.
It’s a fun exercise to go through and compare some of the noteworthy names back against it, it certainly doesn’t hit on everyone, but it feels pretty good given how little data we still have.
Model Limitations
The biggest limitation is that we simply don’t have enough transitions between the two leagues. To try and be cute about this, I used a technique called K-fold cross validation. Normally, we’d train the model on the first four MLSNP seasons and then test it on the most recent one. The problem is that’s a test set of approximately 50 players in 2026, and there’s just going to be huge noise there. So instead, we run the model where one fifth of the player-transition set gets to be the test dataset, and the four remaining are the training set. Then we can take the average across those five folds. This gives us a more stable view of what changes to the model are helping and hurting. I chose five folds somewhat arbitrarily (there are five seasons), but have gotten some feedback since that with such a small player-transition set, we could have done “leave-one-out” cross validation. This would be effectively training the model on 199 players to predict one, and then doing that 200 times. A quick unoptimized trial of this improved the GK model by 2%, and the player model by 1%, perhaps some ground to cover there. Nonetheless, I would bet that in 10 years this model has tightened up considerably.
Similarly, some of these metrics have considerable season-to-season variability even for players who play the exact same role for the exact same club. A perhaps more accurate way to evaluate the model would be error above regular, run of the mill, variance. We see in many of the largest misses, it’s goalkeepers whose shot stopping value swung massively season over season, and strikers who maintained an unbelievably high level of receiving value.
Another thing I quite dislike is that the model stops tracking the MLSNP performance once the player makes their MLS debut. This is similar to how a transfer model would work, given you cannot play for two teams at the same time, but you can do that with a youth team and a first team! In fact, across the 197 graduating players only 15% don’t come back down, 50% play another five 90’s, and 10% play another 20 90’s with their respective reserve team. The vast majority of players continue to play MLSNP over the time it takes them to accrue 1000 senior minutes (about a calendar year on average), so you have this weird, blended period. I tried including these minutes into the model and it didn’t seem to help across the board (MSE reduction of 0% on the CV folds, 6% on the 25/26 holdout), though I’m sure in specific use cases it would and there’s a more clever way to handle this.
The model includes some information about how the players in their position with the first team are doing. I think there are probably significantly more insights to dig into about the specifics of the transition that could make a model much better, but given the limited data now I didn’t spend much time fleshing out tiny slices. If you have thoughts, I’m always open to hear more.
This feels like a good place to point out that the model is only predicting the first 1000 MLS minutes of a player, not how likely they are to figure it out from there. These are likely to be the least productive minutes of a player’s career. For example, Julian Hall was a frequently requested backtest candidate that I left out, because his first 1000 MLS minutes were actually quite weak and the model gets that mostly right. But minutes 1000 to 3000 have been excellent.
One thing I don’t account for at all is that generally talent evaluators are largely quite good at their jobs. There aren’t droves of USMNT players in your local park that were just incorrectly evaluated, so the players that do get called up are generally the best players. I suspect in actuality, the transitions for the bottom 50% of MLSNP players would be worse than this model suggests.
The Technical Details
To actually generate the projections, I used six potential models for each metric.
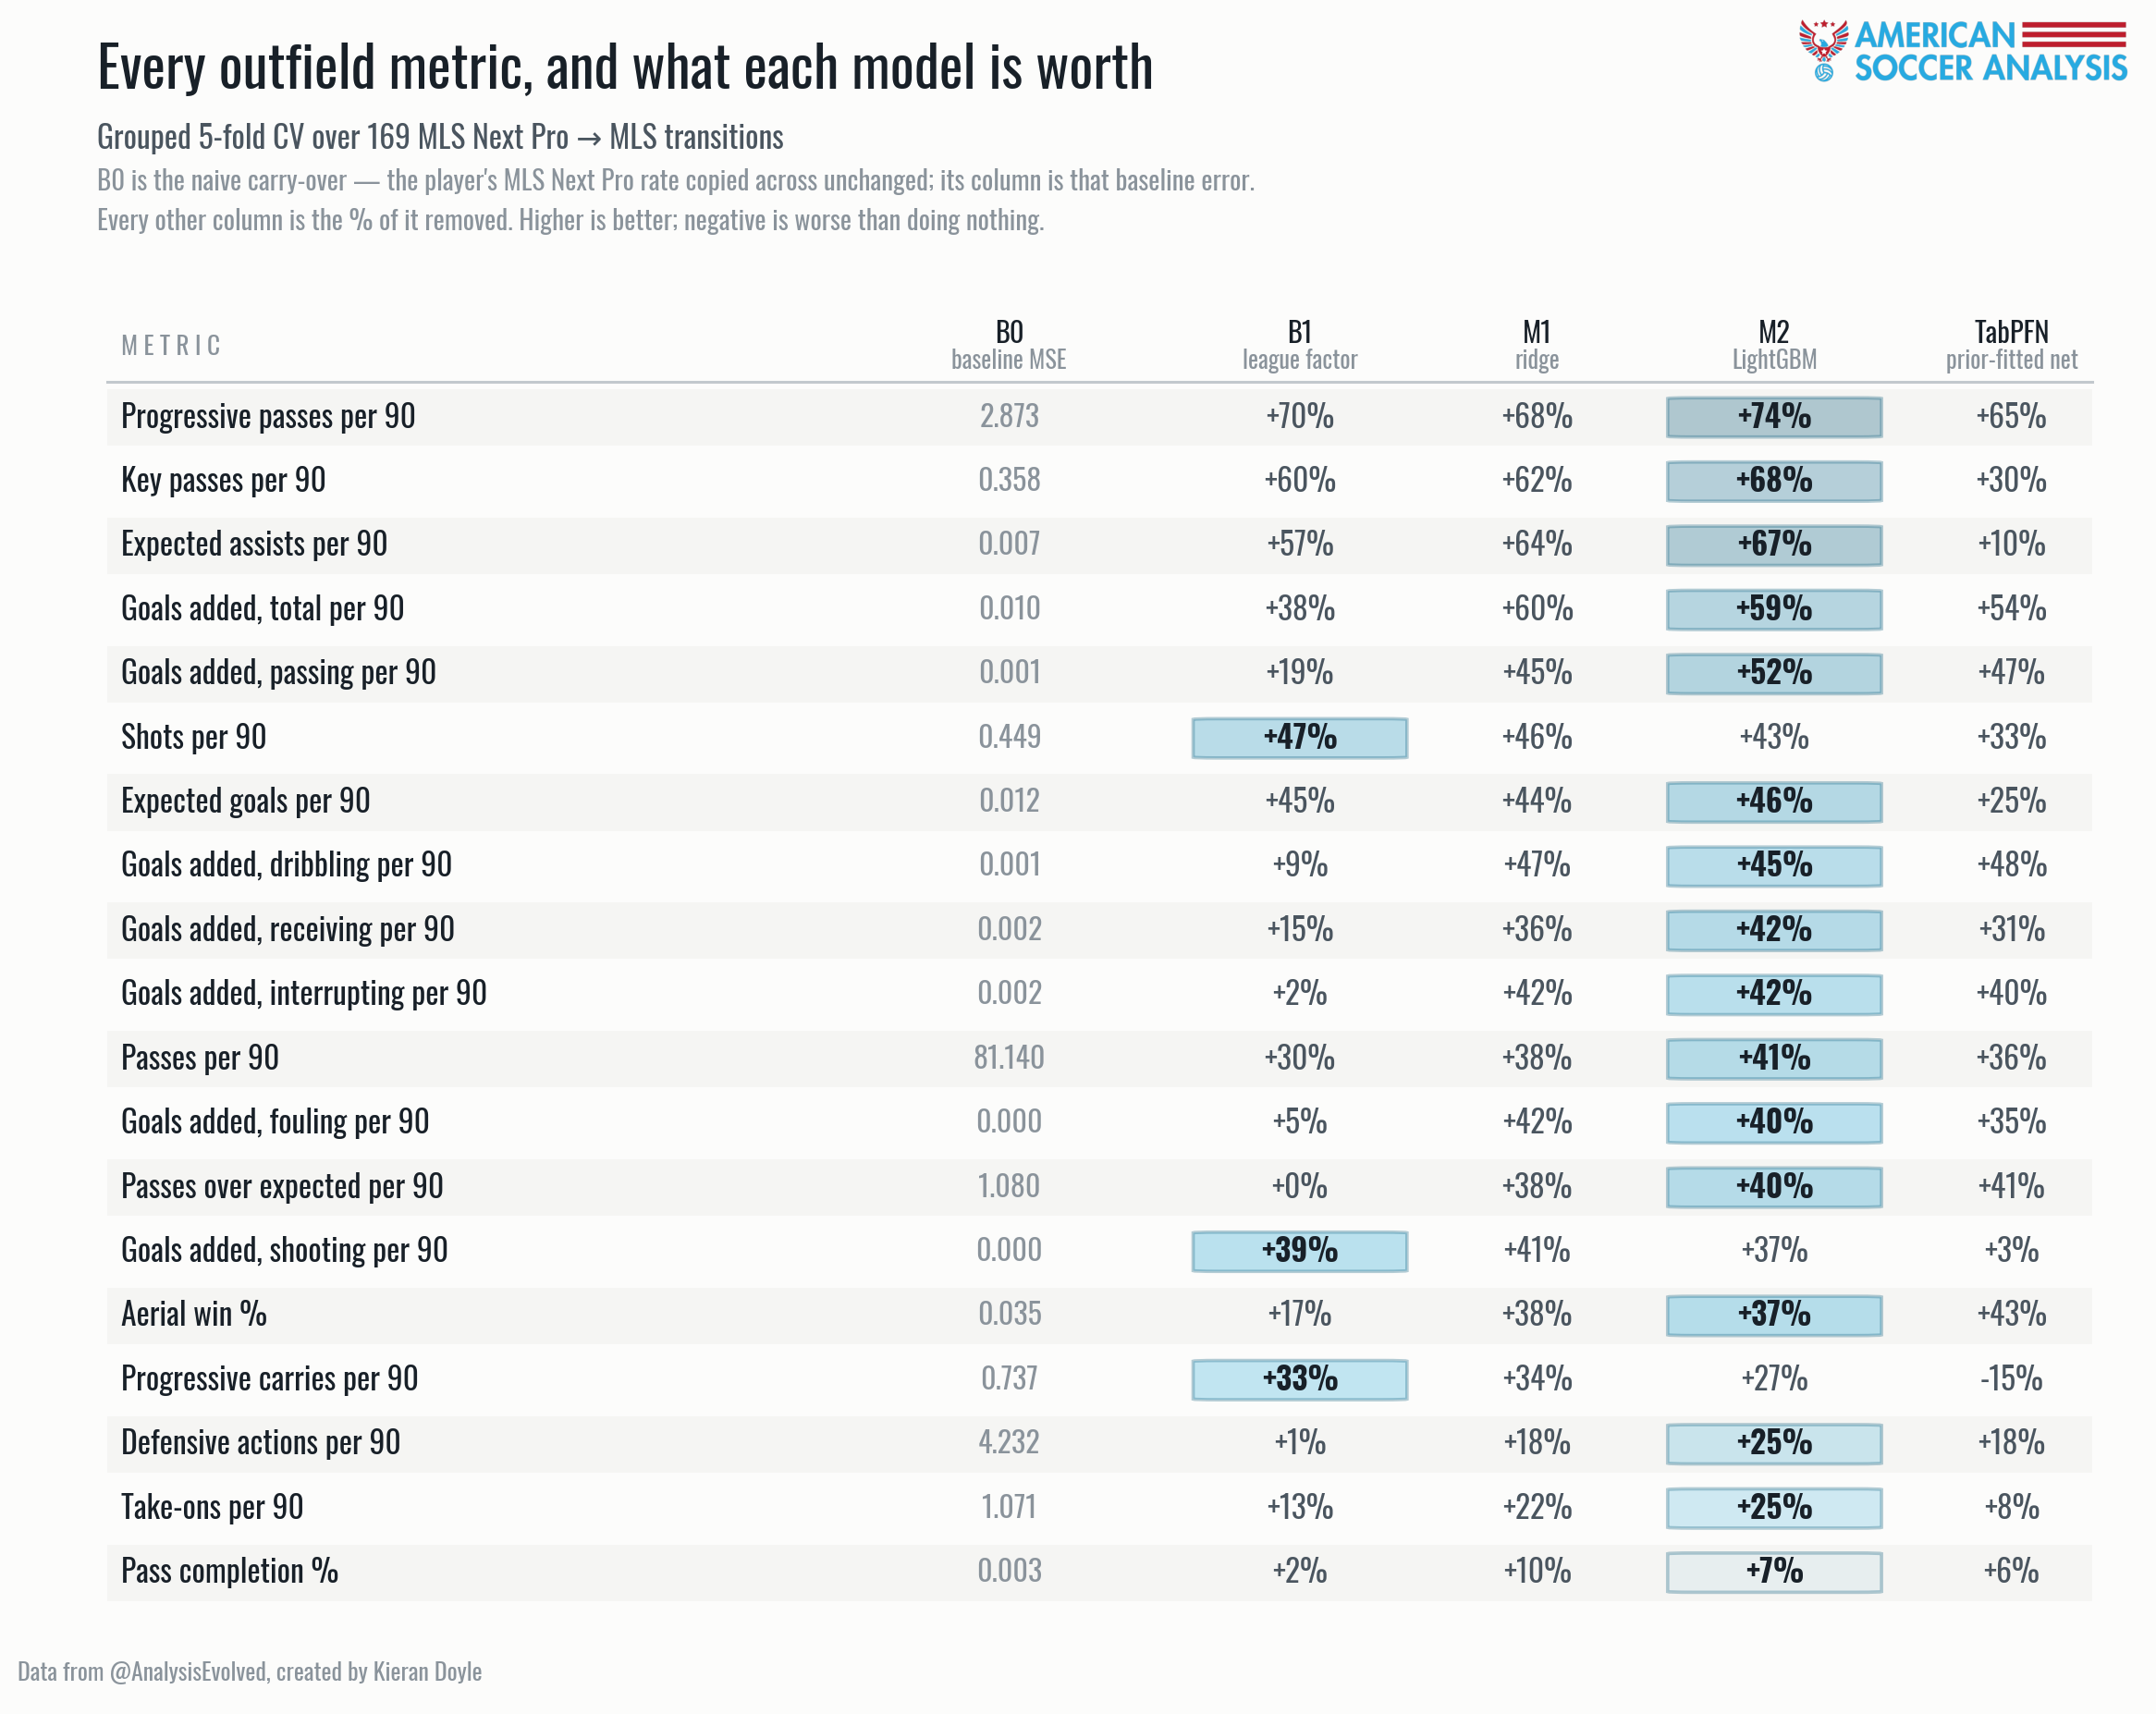
B0, Direct Translation of MLSNP Performance: Take whatever the player was doing in MLS Next Pro and write it down unchanged as the MLS prediction. No adjustment at all. Every "+42%" in the project means "42% less error than B0’s guess”.
B1, League-Position Translation Factor: Work out, across all past call-ups, how much a player's numbers change graduating from MLSNP then apply that same haircut to everyone in the position. One translation factor per position per metric.
M1, Ridge Regression from B1: Starting with the league-position translation factor, use a ridge regression model based on the two clubs, the player metrics, and the players age.
M2, LightGBM: Gradient boosted model with the entire context block we mentioned at the beginning, with a quantile objective. More on this later.
GKRidge, a GK version of B1: There are so few GK transitions that it’s basically just B1 with much harder pushing towards a flat translation factor.
TabPFN, a prior fitted transformer: We met our friend TabPFN in the goalkeeper cross claiming model and it did a good job with a small dataset there, and given we’ve got an even smaller one here I figured I’d give it a shot.
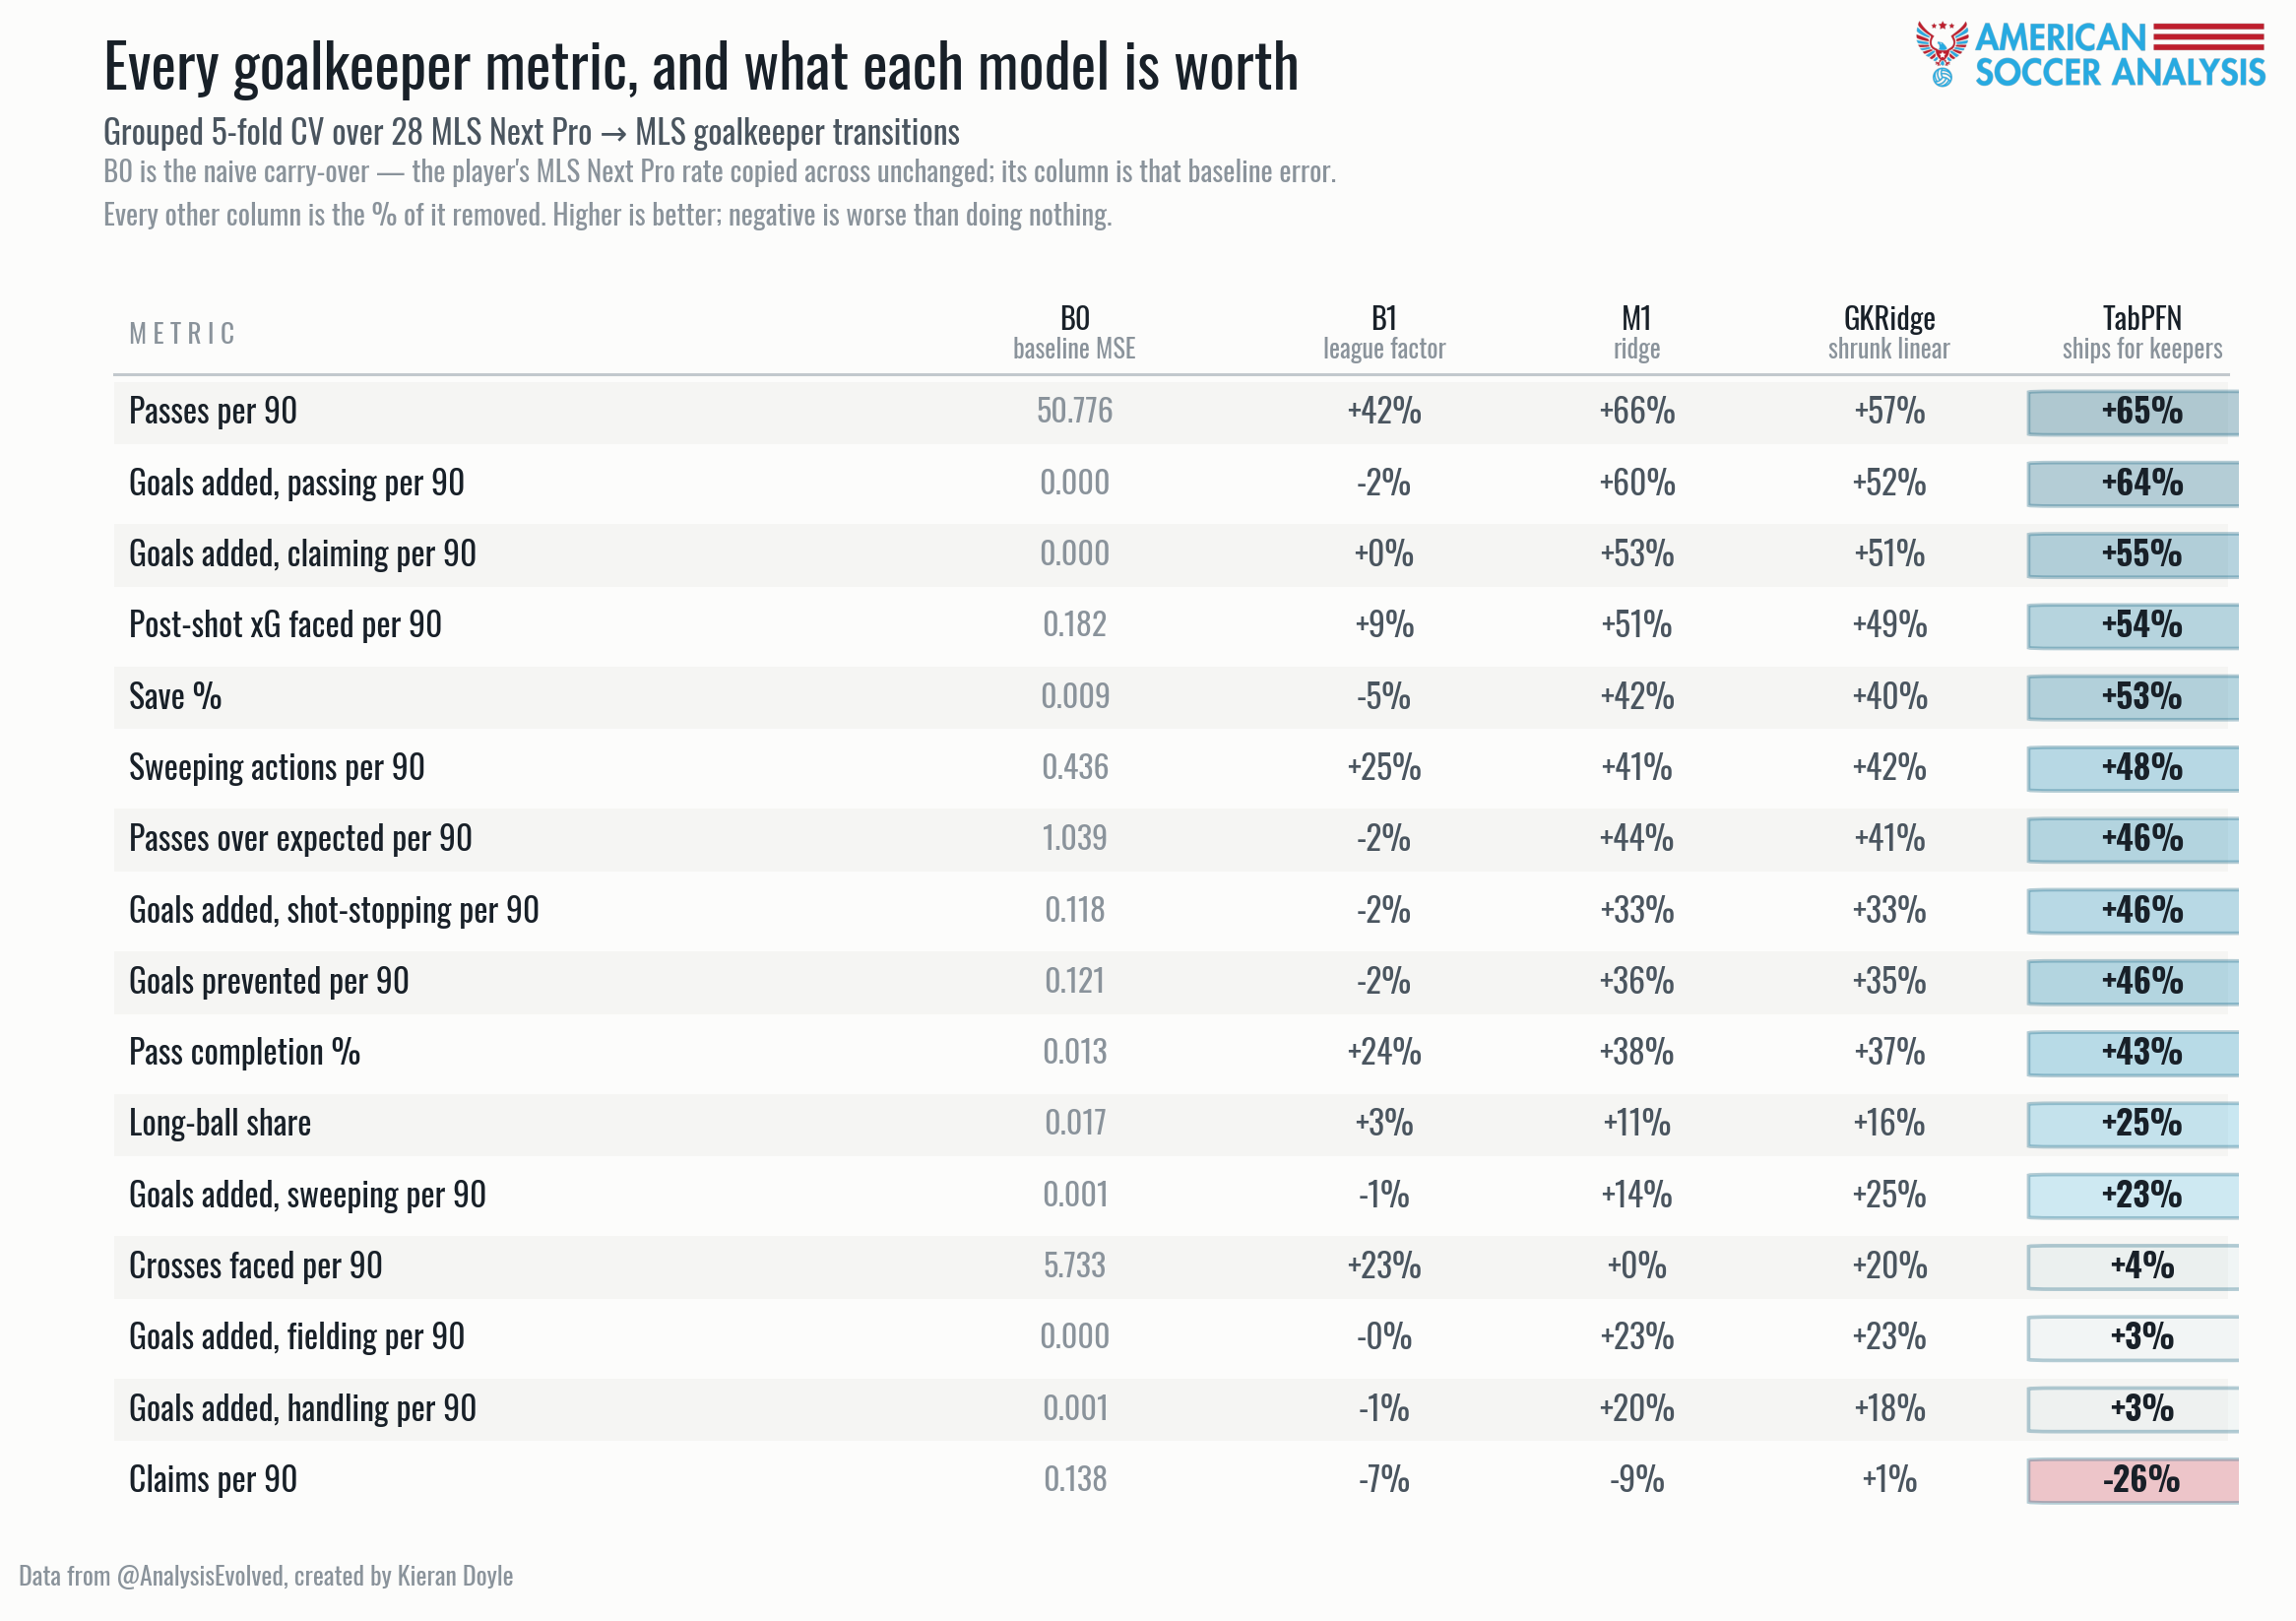
We tried out these 6 models on all of the metrics, with GKRidge being exclusive to goalkeepers (duh) and picked whichever one was best for a given metric. You can see their comparison in terms of MSE% reduction in the graphics below and the model selected for each metric as well. For outfielders, LightGBM is the model used for 16 of 19 metrics for outfielders, with a flat translation factor for shots, goals added shooting, and progressive carries. Surprisingly, TabPFN improves upon Light GBM for only a few metrics (and narrowly so) and is much worse for most. I’m not really sure why, but I’m far from an expert on these foundational transformer models so if you know, hit me up. As such, because TabPFN is a bit annoying to implement due to the necessity for a GPU, unless it was better than everything, I didn’t want to use it for any of the metrics.
For goalkeepers, TabPFN does a better job with the extremely small dataset here. For the bottom four metrics (crosses faced, claims, handling, fielding), it actually performs very poorly, but those metrics are A) somewhat less important to me or B) very small in magnitude, so the errors are extremely small anyways. For simplicity’s sake it’s TabPFN for everything for GKs.
On M2, I chose LightGBM here because I’ve used XGBoost for all my gradient boosting needs because it’s the model I’m most exposed to, so I wanted to try something different. Generally, LightGBM is actually used to save on compute costs when you have very large datasets, and something like XGBoost would probably do a better job here if this model was at a place to be optimized. I did a quick screen of a few alternative gradient boosting models and it seemed like mostly noise between them, so maybe not. Similarly, I tried a few different flavours of the tabular foundation models and they all came in somewhat lacking compared to the gradient boosting and ridge regression models. TabFM (Google’s competitor), currently leading TabArena, has a suggested minimum context row size of 2000 rows, so I suspect we’re just “too small” still.
Previously I mentioned using quantile objectives; for each of the probability outcomes (10th, 25th, 50th, 75th, 90th) we run a separate model. This data has a huge amount of heteroscedasticity, that is the variance in a given metric varies greatly across the dataset, largely by position. For example, the P25-P75 window for a striker’s xG is 5x larger than a centerback’s. By running five separate fits we can assess the shape of the data much more accurately. Similarly, the data has some pretty significant tails from star players, and if we just fit off of reducing MSE across the whole window, your P50 is going to get dragged up to the point of over-predicting every single player. As is, we underpredict 48% of players and overpredict 52% of players, which is close enough to 50/50 for me.
Anyways, that’s everything. Your reward for reading all 4000 words of this is you can generate a projection wheel for any of your prospects. Have fun.