MLS Possession with Purpose Week 3: The best (and worst) performances

Here's my weekly analysis for your consideration as Week 3 ended Sunday evening with a 2-nil Seattle victory over Montreal. To begin, for those new to this weekly analysis, here's a link to PWP. It includes an introduction and some explanations; if you are familiar with my offerings then let's get stuck in.

First up is how all the teams compare to each other for Week 3:

Observations:

Note that Columbus remains atop the League while those who performed really well last year (like Portland) are hovering near the twilight zone. A couple of PKs awarded to the opponent and some pretty shoddy positional play defensively have a way of impacting team performance.

Note also that Toronto are mid-table here but not mid-table in the Eastern Conference standings; I'll talk more about that in my Possession with Purpose Cumulative Blog later this week.

Also note that Sporting Kansas City are second in the queue for this week; you'll see why a bit later.

A caution however - this is just a snapshot of Week 3; so Houston didn't make the list this week but will surface again in my Cumulative Index later.

The bottom dweller was not DC United this week; that honor goes to Philadelphia. Why? Well, because like the previous week, their opponent (Columbus) is top of the heap.

So how about who was top of the table in my PWP Strategic Attacking Index? Here's the answer for Week 3:

As noted, Columbus was top of the Week 3 table again this week, with FC Dallas and their 3-1 win against Chivas coming second, and Keane and company for LA coming third.

With Columbus taking high honors, and all the press covering Bernardo Anor, it is no surprise he took top honors in the PWP Attacking Player of the Week. But he didn't take top honors just for his two wicked goals, and the diagram below picks out many of his superb team efforts as Columbus defeated Philadelphia 2-1.

One thing to remember about Bernardo; he's a midfielder and his game isn't all about scoring goals. Recoveries and overall passing accuracy play a huge role in his value to Columbus, and with 77 touches he was leveraged quite frequently in both the team's attack and defense this past weekend.

Anyhoo... the Top PWP Defending Team of the Week was Sporting Kansas City. This is a role very familiar to Sporting KC, as they were the top team in defending for all of MLS in 2013. You may remember that they also won the MLS Championship, showing that a strong defense is one possible route to a trophy.

Here's the overall PWP Strategic Defending Index for your consideration:

While not surprising for some, both New England and Vancouver finished 2nd and 3rd respectively; a nil-nil draw usually means both defenses performed pretty well.

So who garnered the PWP Defending Player of the Week?  Most would consider Aurelien Collin a likely candidate, but instead I went with Ike Opara, as he got the nod to start for Matt Besler.  Here's why:

Although he recorded just two defensive actions inside the 18-yard box compared to five for Collin, Opara was instrumental on both sides of the pitch in place of Besler. All told, as a Center-back, his defensive activities in marshaling the left side were superb as noted in the linked MLS chalkboard diagram here. A big difference came in attack where Opara had five shots attempts with three on target.

In closing...

My thanks again to OPTA and MLS for their MLS Chalkboard; without which this analysis could not be offered.

You can follow me on twitter @chrisgluckpwp, and also, when published you can read my focus articles on the New York Red Bulls PWP this year at the New York Sports Hub. My first one should be published later this week.

All the best, Chris

In Defense of the San Jose Earthquakes and American Soccer

Note: This is part II of the post using a finishing rate model and the binomial distribution to analyze game outcomes. Here is part I. As if American soccer fans weren’t beaten down enough with the removal of 3 MLS clubs from the CONCACAF Champions League, Toluca coach Jose Cardozo questioned the growth of American soccer and criticized the strategy the San Jose Earthquake employed during Toluca’s penalty-kick win last Wednesday. Mark Watson’s team clearly packed it in defensively and looked to play “1,000 long balls” on the counterattack. It certainly doesn’t make for beautiful fluid soccer but was it a smart strategy? Are the Earthquakes really worthy of the criticism?

Perhaps it’s fitting that Toluca is almost 10,000 feet above sea level because at that level the strategy did look like a disaster. Toluca controlled the ball for 71.8% of the match and ripped off 36 shots to the Earthquakes' 10. It does appear that San Jose was indeed lucky to be sitting 1-1 at the end of match. The fact that Toluca only scored one lone goal in those 36 shots must have been either unlucky or great defense, right? Or could it possibly have been expected?

The prior post examined using the binomial distribution to predict goals scored, and again one of the takeaways was that the finishing rates and expected goals scored in a match decline as shots increase, as seen below. This is a function of "defensive density," I’ll call it, or basically how many players a team is committing to defense. When more players are committed to defending, the offense has the ball more and ultimately takes more shots. But due to the defensive intensity, the offense is less likely to score on each shot.

 source: AmericanSoccerAnalysis

Mapping that curve to an expected goals chart you can see that the Earthquakes expected goals are not that different from Toluca’s despite the extreme shot differential.

source data: AmericanSoccerAnalysis

Given this shot distribution, let’s apply the binomial distribution model to determine what the probability was of San Jose advancing to the semifinals of the Champions League. I’m going to use the actual shots and the expected finishing rate to model the outcomes. The actual shots taken can be controlled through Mark Watson’s strategy, but it's best to use expected finishing rates to simulate what outcomes the Earthquakes were striving for. Going into the match the Earthquake needed a 1-1 draw to force a shootout. Any better result would have seen them advancing and anything worse would have seen them eliminated.

Inputs:

Toluca Shots: 36

Toluca Expected Finishing Rate: 3.6%

San Jose Shots: 10

San Jose Expected Finishing Rate: 11.2%

Outcomes:

Toluca Win: 39.6%

Toluca 0-0 Draw: 8.3%

Toluca 1-1 Draw: 13.9% x 50% PK Toluca = 6.9%

Total Probability Toluca advances= 54.9%


San Jose Win: 32.3%

2-2 or higher Draw = 5.8%

San Jose 1-1 Draw: 13.9% x 50% PK San Jose = 6.9%

Total Probability San Jose Advances = 45.1%


The odds of San Jose advancing with that strategy are clearly not as bad as the 10,000-foot level might indicate. Counterattacking soccer certainly isn’t pretty, but it wouldn’t still exist if it weren’t considered a solid strategy.

It’s difficult, but we can also try to simulate what a “normal” possession-based strategy might have looked like in Toluca. In MLS the average possession for the home team this year is 52.5% netting 15.1 shots per game. In Liga MX play, Toluca is only averaging about 11.4 shots per game so they are not a prolific shooting team. They are finishing at an excellent 15.2%, which could be the reason San Jose attempted to pack it in defensively. The away team in MLS is averaging 10.4 shots per game. If we assume that a more possession oriented strategy would have resulted in a typical MLS game then we have the following expected goals outcomes.

source data: AmericanSoccerAnalysis

Notice the expected goal differential is actually worse for San Jose by .05 goals. Though it may not be statistically significant, at the very least we can say that San Jose's strategy was not ridiculous.

Re-running the expected outcomes with the above scenario reveals that San Jose advances 43.3% of the time. A 1.8% increase in the probability of advancing did not deserve any criticism, and definitely not such harsh criticism. It shows that the Earthquakes probably weren’t wrong in their approach to the match. And if we had factored in a higher finishing rate for Toluca, the probabilities would favor the counterattack strategy even more.

Even though the US struck out again in the CONCACAF Champions League, American's don't need to take abuse for their style of play. After all, soccer is about winning, and in the case of a tie, advancing. We shouldn't be ashamed or be criticized when we do whatever it takes to move on.


Predicting Goals Scored using the Binomial Distribution

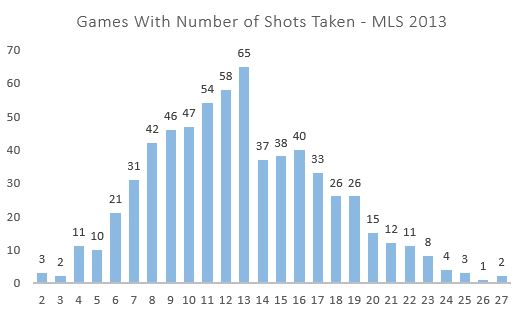
Much is made of the use of the Poisson distribution to predict game outcomes in soccer. Much less attention is paid to the use of the binomial distribution. The reason is a matter of convenience. To predict goals using a Poisson distribution, “all” that is needed is the expected goals scored (lambda). To use the binomial distribution, you would need to both know the number of shots taken (n) and the rate at which those shots are turned into goals (p). But if you have sufficient data, it may be a better way to analyze certain tactical decisions in a match. First, let’s examine if the binomial distribution is actually dependable as a model framework. Here is the chart that shows how frequently a certain number of shots were taken in a MLS match.

source data: AmericanSoccerAnalysis

The chart resembles a binomial distribution with right skew with the exception of the big bite taken out of the chart starting with 14 shots. How many shots are taken in a game is a function of many things, not the least of which are tactical decisions made by the club. For example it would be difficult to take 27 shots unless the opposing team were sitting back and defending and not looking to possess the ball. Deliberate counterattacking strategies may very well result in few shots taken but the strategy is supposed to provide chances in a more open field.

Out of curiosity let’s look at the average shot location by shots taken to see if there are any clues about the influence of tactics. To estimate this I looked expected goals by each shot total. This does not have any direct influence on the binomial analysis but could come in useful when we look for applications.

source: AmericanSoccerAnalysis

The average MLS finishing rate was just over 10 percent in 2013. You can see that, at more than 10 shots per game, the expected finishing rate stays constant right at that 10-percent rate. This indicates that above 10 shots, the location distribution of those shots is typical of MLS games. However, at fewer than 10 shots you can see that the expected goal scoring rate dips consistently below 10%. This indicates that teams that take fewer shots in a game also take those shots from worse locations on average.

The next element in the binomial distribution is the actual finishing rate by number of shots taken.

 source: AmericanSoccerAnalysis

Here it’s plain that the number of shots taken has a dramatic impact on the accuracy rate of each shot. This speaks to the tactics and pace of play involved in taking different shot amounts. A team able to squeeze off more than 20 shots is likely facing a packed box and a defense less interested in ball possession. What’s fascinating then is that teams that take few shots in a game have a significantly higher rate of success despite the fact that they are taking shots from farther out. This indicates that those teams are taking shots with significantly less pressure. This could indicate shots taken during a counterattack where the field of play is more wide open.

Combining the finishing accuracy model curve with number of shots we can project expected goals per game based on number of shots taken.

ExpGoalsbyShotsTaken

What’s interesting here is that the expected number of goals scored plateaus at about 18 shots and begins to decline after 23 shots. This, of course, must be a function of the intensity of the defense they are facing for those shots because we know their shot location is not significantly different. This model is the basis by which I will simulate tactical decisions throughout a game in Part II of this post.

Now we have the two key pieces to see if the binomial distribution is a good predictor of goals scored using total shots taken and finishing rate by number of shots taken. As a refresher, since most of us haven’t taken a stat class in a while, the probability mass function of the binomial distribution looks like the following:

source: wikipedia

Where:

n is the number of shots

p is the probability of success in each shot

k is the number of successful shots

Below I compare the actual distribution to the binomial distribution using 13 shots (since 13 is the mode number of shots from 2013’s data set), assuming a 10.05% finishing rate.

source data: AmericanSoccerAnalysis, Finishing Rate model

The binomial distribution under predicts scoring 2 goals and over predicts all other options. Overall the expected goals are close (1.369 actual to 1.362 binomial). The Poisson is similar to the binomial but the average error of the binomial is 12% better than the Poisson.

If we take the average of these distributions between 8 and 13 shots (where the sample size is greater than 40) the bumps smooth out.

source data: AmericanSoccerAnalysis, Finishing Rate model

The binomial distribution seems to do well to project the actual number of goals scored in a game, and the average binomial error is 23% lower than with the Poisson. When individually looking at shots taken 7 to 16 the binomial has 19% lower error if we just observe goal outcomes 0 and 1. But so what? Isn’t it near impossible to predict the number of shots a team will take in the game? It is. But there may be tactical decisions like counterattacking where we can look at shots taken and determine if the strategy was correct or not. And a model where the final stage of estimation is governed by the binomial distribution appears to be a compelling model for that analysis. In part II I will explore some possible applications of the model.

Jared Young writes for Brotherly Game, SB Nation's Philadelphia Union blog. This is his first post for American Soccer Analysis, and we're excited to have him!

MLS Prediction Contest - We Have a Winner!

After two weeks of Major League Soccer wins, losses, and, this week, mostly draws, the best predictors were... [googleapps domain="docs" dir="spreadsheet/pub" query="key=0At6qSdpic03PdE4zOE12WWNlSm0zeVBnaXd6SnpDQ0E&output=html&widget=true" width="500" height="300" /]

MLSAtheist and timbertyler tied for first place with 13 correct answers each (out of 20). Normally, we would have gone to the tiebreaker to determine the grand prize winner, but MLSAtheist, a valued contributor to American Soccer Analysis, graciously decided to withdraw his prize eligibility. That leaves timbertyler as the winner of a subscription to MLS Live 2013!

Congratulations to timbertyler; maybe Portland will follow his lead and start amassing some wins of their own.

ASA Fantasy League Update Round 2: A Terrible Case of the Nagbe's

This is your weekly reminder that you're doing MLS fantasy, and if you're taking part in our league you should probably set your rosters so you have an opportunity to win something TBD. And really, since you're probably not doing any work with the NCAA tournament going on, you have some time to make sure your lineup is good to go this week. If you aren't in our league yet, and for some reason you feel the strong need to join, you can do so by figuring out how to use this code: 9593-1668. We grade on a pass/fail scale. If you get in you passed. Here is the current week's worth of data. It's in a jpeg format because, frankly, tables show up for crap on our site and we'll be moving soon enough to this other site that... well, we'll tell you more when we're at that stage.

week2MLSFANTASYHere are the main take aways for this week.

- Stop making Darlington Nagbe your Captain.

- Will Bruin continues to make me look stupid.

- I'm average, and if you are below me, you are not doing yourself any favors.

- I'm ahead of both Matthias and Drew, so while I'm the idiot of the podcast I've so far shown to be the better fantasy player.

- I totally lucked out with Zack MacMath this week.

Now the below image is for the week 2 "dream team" which is basically how you could have gotten the most points last week. Interesting that no one from our league sported a 3-5-2 formation this week and that three main formations were kind of cycled through for everyone.

DreamTeam-week2

Good luck to you all, and we'll see if we can ever catch up to either Bazzo, Cris Pannullo or Chris Gluck. They look poised to possibly run away with this thing. Hopefully this week will set them back so the rest of us can feel better about ourselves.

xGD in CONCACAF Champions League

Understanding that not everything has to mean something, we still try to provide meaning to things. Deriving meaning becomes infinitely harder when sample sizes are small: what size sample is important when considering a specific set of data? We don't always know, but I present you the CONCACAF Champions League data anyway. Below is the Expected Goals 1.0 data from the group stage of the CCL that I've compiled in the last couple of days.

Team  xGF   xGA   xGD 
Cruz Azul 8.578 4.112 4.466
Toulca 7.528 3.488 4.04
Tijuana 6.617 3.018 3.599
America 6.975 4.017 2.958
Dynamo 5.683 3.417 2.266
LA Galaxy 7.052 4.95 2.102
Sporting KC 4.785 2.699 2.086
    SJ Earthquakes 4.768 2.962 1.806
Montreal I.    3.816    8.796    -4.98

To be honest, this is my inventive way to present this information to you. I wanted to do an article about various things concerning CCL, but the problem always kind of leads back to sample size. Four games just isn't that much. The thing is, while you may not be able to draw any solid conclusions from this, it does give us a rough assessment for how Liga MX compares to MLS at this juncture, and it tells us that for the most part, MLS and Liga MX teams are better than the competition.

Mind you, teams have changed between when they qualified for CCL 2013-14 and now. This San Jose Earthquakes squad, for example, has quite a few new faces. Houston also has added a couple of pieces and underwent a some changes in the defensive rotation scheme.

xGD wasn't going to tell us too much about the semi-final matches that were played the last two nights. We knew that it was improbable that even two clubs were going to move forward. Furthermore it seems awkward to even consider that San Jose was the closest to advancing--and had it not been for a bad call, it probably would have.

What xGD did tell us is that all four Mexican clubs performed better in that short period than any of the MLS sides. Sure, a "duh" statement is in order, but this clarifies that point further than a cute 1990's radio morning drive show with catchy sound effects could. Cruz Azul seemed a superior team, for example, as they were nearly two expected goals better than any MLS side. In a short tournament that says something stronger than their actual goal tallies.

Yes, I realize the whole sample size thing, and really it's funny submitting qualifying statements, but it's even more silly to consider that we qualify them despite the fact that we don't actually know if we need to. For all we know xGD stabilizes as a metric at six games or maybe even four. We'll get Matty on that...

Mexico's teams were better, and judging from everything going down on  Twitter and how the fragile psyche of the average US Soccer fan seems almost devastated by this fact, the reality is that MLS is better than it has been. The league has grown so much, and considering the issues that still limit organizations from competing against Mexico, it's surprising how well we really do in this competition.

Now American teams aren't yet on the "elite" level yet. But they are still very good and are nearing the imaginary line of being able to compete on a greater level with Mexico. As the budgets of MLS increase, and the depth charts along with the academies grow deeper, you're only going to see MLS teams get better. Stating that an MLS team will never win the CCL is one of those hyperbole statements that is just crazy to me. I think it's an eventuality at this point that some club somewhere will knock Mexico off it's perch...sooner rather than later.

ASA Podcast: XLI An MLS Week 2 Review

Okay, here is a podcast. This is our weekly podcast that is just simply a podcast. A podcast that stars myself and Drew. A Podcast that I edited to make sound not bad and some what interesting. I encourage you to listen to it. Drew makes lots of good points, I make some too. [audio http://americansocceranalysis.files.wordpress.com/2014/03/asa-podcast-xli-the-do-over.mp3]

Passing: An oddity in how it's measured in Soccer (Part II)

If you read my initial article on "Passing - An oddity in how it's measured in Soccer Part I"; I hope you find this article of value as well as the onion gets peeled back a bit further  to focus on Crosses. To begin please consider the different definitions of passing identified in Part I and then take some time to review these two additional articles (Football Basics - Crossing) & (Football Basics - The Passing Checklist) published by Leo Chan - Football Performance Analysis, adding context to two books written by Charles Hughes in 1987 (Soccer Tactics and Skills) and 1990 (The Winning Formula).   My thanks to Sean McAuley, Assistant Head Coach for the Portland Timbers, for providing these insightful references.

In asking John Galas, Head Coach of newly formed Lane United FC in Eugene, Oregon here's what he had to offer:

"If a cross isn’t a pass, should we omit any long ball passing stats? To suggest a cross is not a pass [is] ridiculous, it is without a doubt a pass, successful or not - just ask Manchester United, they ‘passed’ the ball a record 81 times from the flank against Fulham a few weeks back.”

In asking Jamie Clark, Head Coach for Soccer at the University of Washington these were his thoughts...

"It's criminal that crosses aren't considered passing statistically speaking. Any coach or player knows the art and skill of passing and realizes the importance of crossing as it's often the final pass leading to a goal. If anything, successful passes should count and unsuccessful shouldn't as it's more like a shot in many ways that has, I'm guessing, little chance of being successful statistically speaking yet necessary and incredibly important."

Once you've taken the time to read through those articles, and mulled over the additional thoughts from John Galas and Jamie Clark, consider this table.

 Stat Golazo/MLS STATS Squawka Whoscored MLS Chalkboard My approach Different (Yes/No)?
Total Passes 369 356 412  309+125 = 434 309+125+9=443 Yes
Total Successful Passes 277 270 305 309 309 + 9 = 318 Yes
Passing Accuracy 75% 76% 74% NOT OFFERED 71.78% Yes
Possession Percentage 55.30% 53% 55% NOT OFFERED 55.93% Yes
Final Third Passes 141 NOT OFFERED NOT OFFERED FILTER TO CREATE 140 Yes
Final Third Passing Accuracy 89/141= 63.12% NOT OFFERED NOT OFFERED FILTER TO CREATE 92/140 = 65.71% Yes
Total Crosses 35  vs 26 (MLS Stats) NOT OFFERED 35 35 35 No
Successful Crosses 35*.257=9 NOT OFFERED 9 9 9 No
KEY PASSES NOT OFFERED 7 9 6 6 Yes
 

* NOTE: MLS Chalkboard includes unsuccessful crosses as part of their unsuccessful passes total but does not include successful crosses as part of their total successful passes; it must be done manually.

For many, these differences might not mean very much but if looking for correlations and considering R-squared values that go to four significant digits these variations in datum might present an issue.

I don't track individual players but Harrison and  Matthias do, as does Colin Trainor, who offered up a great comment in the Part I series that may help others figure out where good individual data sources might come from.

What's next?

My intent here is not to simply offer up a problem without a solution; I have a few thoughts on a way forward but before getting there I wanted to offer up what OPTA responded with first:

I (OPTA representative) have has (had) a word with our editorial team who handle the different variables that we collect. There is no overlay from crosses to passes as you mentions, they are completely different data variables. This is a decision made as it fits in with the football industry more. Crosses are discussed and analysed as separate to passes in this sense. We have 16 different types of passes on our F24 feed in addition to the cross variable.

So OPTA doesn't consider a cross a pass - they consider it a 'variable'?!?

Well I agree that it is a variable as well and can (and should) be tracked separately for other reasons; but for me it's subservient to a pass first and therefore should be counted in the overall passing category that directly influences a teams' percentage of possession.  Put another way; it's a cross - but first and foremost it's a pass.

(Perhaps?) OPTA (PERFORM GROUP now) and others in the soccer statistics industry may reconsider how they track passes?

I am also hopeful that OPTA might create a 'hot button' on the MLS Chalkboard that allows analysts the ability to filter the final third consistently, from game to game to game, as an improvement over the already useful 'filter cross-hairs'...

In closing...

My intent is not to call out any statistical organizations but to offer up for others, who have a passion for soccer analyses, that there are differences in how some statistics can be presented, interpreted and offered up for consideration.  In my own Possession with Purpose analysis every ball movement from one player to another is considered in calculating team passing data.

Perhaps this comparison is misplaced, but would we expect the NFL to call a 'screen pass' a non-pass and a variation of a pass that isn't counted in the overall totals for a Team and Quarterback's completion rating?

Here's a great exampleon how Possession Percentage is being interpreted that might indicate a trend.

Ben has done some great research and sourced MLS Stats (as appropriate) in providing his data - he's also offered up that calculating possession is an issue in the analytical field of soccer as well.

In peeling back the data provided by MLS Stats he is absolutely correct that the trend is what it is... When adding crosses and other passing activities excluded by MLS Stats the picture is quite different and lends credence to what Bradley offers.

For example--when adding crosses and other passing activities not included by MLS Stats--the possession percentages for teams change, and the R-squared between points in the league table comes out as 0.353, with only 7 of 8 possession-based teams making the playoffs. New York, with most points, New England and Colorado all had possession percentages last year that fell below 50%, and only one team in MLS last year that didn't make the playoffs finished with the worst record (16 points) DC United.

For me, that was superb research - a great conclusion that was statistically supported. Yet, when viewed with a different lens on what events are counted as passes, the results are completely different.

All the best,

Chris

You can follow me on twitter @chrisgluckpwp


How It Happened: Week Two

I'll be frank: either week two of the MLS season was much less exciting than week one, or I did a poor job of picking games to watch and analyze this week. My bet is that both are true. Anyway, onto the show in which I take a look at three games from the weekend and pick a stat or Opta chalkboard image for each team that tells the story of how they played (last week's version is here if you missed it):

Sporting Kansas City 1 - 1 FC Dallas

Stat that told the story for Dallas: outpassed 418-213, including 103-41 in the game's first half hour

A thought occurred to me when watching this game: Sporting Kansas City has to look a lot like a prototype of what Oscar Pareja wants out of his teams. From the formation to the high-pressing, KC has long made their money by manhandling opponents as soon as they get on the ball and not letting them get comfortable. In this game, Sporting came out fired up at home and simply punched Dallas in the mouth (not even completely a figure of speech - this game was brutally physical). The high-pressing from KC's entire team had FCD out of sorts for most of the first half, particularly the first 30 minutes, when they mustered only 41 completed passes.

But the Hoops managed a road draw against the defending champs, so the game wasn't completely a story of getting worked over. As the game wore on and Sporting found it difficult to keep up the constant pressure, Dallas was able to grow into the game a bit. They certainly were never dominant, but another very good game from Mauro Diaz and some smart counter-attacks allowed Pareja's team to stem the tide for the majority of the game. In the end, it was fitting that the slugfest of a game saw just two goals, both from set pieces, but Dallas should feel good about how they played as the game progressed and were able to steal a point.

Stat that told the story for Kansas City: lack of production from forward line: 15 offensive actions in attacking third

kc2

Sporting KC won MLS Cup last year and has unquestionably been one of the league's best teams for the last few seasons. But few would argue that this success is built on a very strong defense and midfield. The forward line has often been sort of an Achilles' heel for this squad, especially now that Kei Kamara has moved on. In this game, Graham Zusi was held out so he could stay fresh for CONCACAF Champions League action, and DP forward Claudio Bieler only came on for the last 13 minutes. But the five players who saw time at a forward spot for KC (Bieler, Dom Dwyer, Sal Zizzo, CJ Sapong and Jacob Peterson) combined to register 15 offensive actions in the attacking third. 

To be clear, that 'offensive actions' stat that's illustrated above might have been made up by me just now, but it encompasses successful passes, dribbles, and all shot attempts. Too often on Saturday, and really for the last few years, Kansas City has dominated the game until the last thirty yards of the field, where they lack ideas. Getting Zusi back will likely help, as would playing Claudio Bieler for a full 90 minutes, but Sporting will need some more creativity and production from their forwards if they hope to lift another trophy this season.

Chivas USA 1 - 1 Vancouver Whitecaps

Stat that told the story for Vancouver: only 53 passes in the offensive third (23 of which were after Kekuta Manneh came on in the 60th minute)

I tuned in for the Chivas-Vancouver matchup excited to see an offensive battle between two sides that combined for 7 goals in week one. Instead, I saw an early red card to the Goats' Agustin Pelletieri followed by a lot of dull possession for Vancouver against a surprisingly organized team in red and white stripes. After looking so deadly in attack against New York, the Whitecaps looked completely lost for ideas on Sunday, with the only forays into the offensive third seeming to come from chips over the top from the superb Pedro Morales. That all changed when Kekuta Manneh came on, as he attacked the Chivas defense with and without the ball, causing fits for Eric Avila and eventually scoring the equalizer for the 'Caps. Still, after playing 87 minutes against 10 men, Vancouver has to be rightfully disappointed at only earning a point.

Stat that told the story for Chivas: Mauro Rosales turning back the clock: 151 actions

chv2

The Seattle Sounders traded Mauro Rosales to Chivas this offseason because he was too expensive and too old to fit into the club's plans for 2014. Nobody even really argued with the decision, though Rosales is undeniably a classy player and won the league's Newcomer of the Year award in 2011. So far in 2014, playing in the red and white of the Goat Zombies, Rosales has looked a lot like the 2011 playmaker that Sounders fans knew and loved. Playing down a man, Rosales was everything you could hope from a smart, skilled veteran; he hoofed it up field when in trouble so his team could get organized, he led smart counter-attacks and he kept the ball when possible (with the help of Erick Torres, who also played very well). All in all, he registered 151 actions in Opta's chalkboard, 12 more than any other player and a whopping 47 more than his nearest teammate. Not bad for a washed-up 33-year-old.

Houston Dynamo 1 - 0 Montreal Impact

Stat that told the story for Montreal: Marco Di Vaio's non-existant heat map

mtl2

I've watched about 120 minutes of Montreal Impact soccer in the season's first two weeks, and just about every one of those minutes has been more impressive than I expected from the Impact this season. Despite having zero points from their first two games (both on the road), they've actually looked pretty good on the field. Justin Mapp is doing Justin Mapp things (like this awesome run & assist from week 1), Hernan Bernardello and Patrice Bernier are pinging beautiful balls to open up space, and Felipe and Andrew Wenger are getting in pretty good goal-scoring spots. So what's the reason behind the zero points? Well, not putting chances away against the Dynamo killed Montreal. ASA's shot numbers had their xGF at 1.15 this week, but there were plenty of other times that they wasted dangerous opportunities (one particular Wenger near-breakaway early in the first half stands out). If All-Star Italian striker Marco Di Vaio wasn't suspended, I have a hard time believing the Impact gets shutout last week.

Stat that told the story for Houston: 8 fouls conceded in the defensive third

This was another game where what I ended up watching did not line up with the expectations I had going in. After an open, attack-filled opening game with New England, Houston came out and didn't really do much offensively against Montreal. It was actually sort of a gameplan of old-school Dom Kinnear, as the Dynamo got an early goal thanks to a deflected Will Bruin shot, and then packed it in and made themselves hard to beat. They sat in two organized banks of four so that only the perfect ball from Montreal would be enough to beat them, and when it looked like they might get beaten, they did the professional thing and took a foul. Eight of Houston's 14 fouls conceded were in their defensive third, and while I can't offer much perspective on whether that's a high proportion compared to league average, I can tell you that many of them occurred when Montreal players were breaking away and getting ready to provide a scoring chance.

Agree with my assessments? Think I'm an idiot? I always enjoy feedback. @MLSAtheist or MLSAtheist@gmail.com

MLS Week 2: Expected Goals and Attacking Passes

Truth be told, last week was kind of a failure on my behalf. I trusted the data and information that was supplied by Golazo, and I'm not sure it really worked out as intended. A few mistakes have been pointed out to me, and while in general that could have been avoided by double checking the MLS chalkboard, I'm not sure that I really wanted to double check their work. This week I went straight to the Chalkboard for the data and then verified the total amount based off MLS soccer numbers. The result of the total numbers this week were a bit surprising.

Team shot1 shot2 shot3 shot4 shot5 shot6 Total xGF
San Jose 0 15 1 8 2 1 27 3.231
Colorado 1 8 4 3 1 1 18 2.228
Portland 2 5 6 3 4 1 21 2.219
New York 1 7 1 0 2 0 11 1.667
Sporting KC 1 4 4 4 3 2 18 1.654
Philadelphia 2 2 4 3 2 0 13 1.465
Chicago 2 2 2 4 2 2 14 1.446
Chivas 2 1 2 6 4 0 15 1.351
Seattle 1 4 1 0 6 1 13 1.263
Houston 1 2 4 3 4 0 14 1.2
Montreal 1 2 2 3 8 0 16 1.15
RSL 0 3 3 2 4 0 12 0.942
Toronto 0 2 2 1 3 1 9 0.653
New England 1 1 1 1 1 0 5 0.635
Vancouver 0 2 1 1 3 1 8 0.582
FC Dallas 0 2 1 2 2 0 7 0.577
Total               22.26

*Expected Goals 1.0 used for this table.

It's weird the last couple of games (talking the CCL match against Toluca midweek); San Jose has done an incredible job at generating shots against talented opposition. First, against a very talented Deportivo Toluca that currently sits second in the Clausura 2014 table, the Quakes managed to put together 20 shots. Liga MX isn't what they once were to MLS, but this is a very efficient showing. With that they barely squeaked by with a draw. This weekend was a much different story as they put the pedal to the floor and crashed through Real Salt Lake to draw a game they really had no business even being in to that point.

Portland is another team that stood out, but for less good things than bad. As Chris already alluded to this morning (he stole my thunder!), they've had an incredible amount of shots that have been blocked even before they get to the keeper. They're obviously getting into advantageous locations and taking shots, but their opponents are getting out in front and deterring those attempts. Which, if you were going to deploy a method for the stopping the Timbers' offense, that would seem to be it. Stay in front of them and prevent as many shots from occurring as possible. Portland has shown itself to be a terribly direct team.

Team    xGF     Goals  
San Jose 3 3
Colorado 2 1
Portland 2 1
New York 2 1
Sporting KC 2 1
Philadelphia 1 1
Chicago 1 1
Chivas 1 1
Seattle 1 1
Houston 1 1
Montreal 1 0
RSL 1 3
Toronto 1 2
New England 1 0
Vancouver 1 1
FC Dallas 1 1
Total 22 19

As you saw last week, our metric predicted under the total amount of goals scored and this week we were actually over. Again this speaks to the strength of long-term averages, and you're frequency going to be bouncing around the total amount. But the important thing is that we're close, and that we understand where we came up short and where we went over. New England, Vancouver and FC Dallas are all clubs that were lucky to even make the "50%" cut off because they just barely projected for a goal. But that was because we round up to the nearest whole number.

New England was surprisingly the highest of the three clubs. I say surprising because they tallied the least amount of shots. Despite that they managed a couple of better shot locations.

    Team   Comp. Passes   Inc. Passes   Total     Pass%     KeyP
Philadelphia 76 35 111 68.47% 5
New England 44 22 66 66.67% 1
New York 53 38 91 58.24% 6
Colorado 26 20 46 56.52% 5
Seattle 59 54 113 52.21% 6
Toronto 15 19 34 51.72% 2
Sporting KC 38 29 67 56.72% 5
Dallas FC 26 11 37 70.27% 4
Houston 40 26 66 60.61% 8
Montreal 49 25 74 66.22% 8
San Jose 54 36 90 60.00% 10
RSL 50 15 65 76.92% 3
Portland 46 41 87 52.87% 5
Chicago 31 30 61 50.82% 7
Chivas 48 33 81 59.26% 8
Vancouver 31 22 53 58.49% 2

Lastly we have attacking third passing data. As you see, there were only two clubs over the "100" mark this week. Seattle and Philly both collected a large percentage of the total possession, which as we have talked about previously isn't necessarily what's important. It's about WHERE you possess the ball. Well, for Philadelphia it worked out well as they pretty much dominated New England. Pushing the ball into the attacking third, the Zolos limited the total touches of New England in dangerous locations and created plenty of opportunities for themselves.

However, Seattle is a different story. As shown in PWP, they dominated a lot of the raw numbers and even managed to finally produce a goal despite shot frustrations. But Toronto preyed on the counter attack and mental mistakes by Marco Pappa. They didn't need many chances, but in the future we'll have to see if they can continue to finish as efficiently as they did on Saturday. They sported the least amount of attacking touches in all of MLS with only 34 and while that obviously doesn't correlate 100% to goals scored, the more opportunities you have the more likely you're going to find the back of the net.